Executive Summary Dashboard (ESD) offers overall performance metrics for:
- OnSite Campaigns with Control Group Analytics
- Mobile App Analytics
- Web Push Analytics
- Email Analytics
- Architect Analytics
- Custom Goal Metrics
Besides, the dashboard offers Discover and Current Active Campaigns sections.
You can drag and drop cards to customize your home page layout. You can simply drag and drop cards to the desired positions to rearrange your dashboard as needed.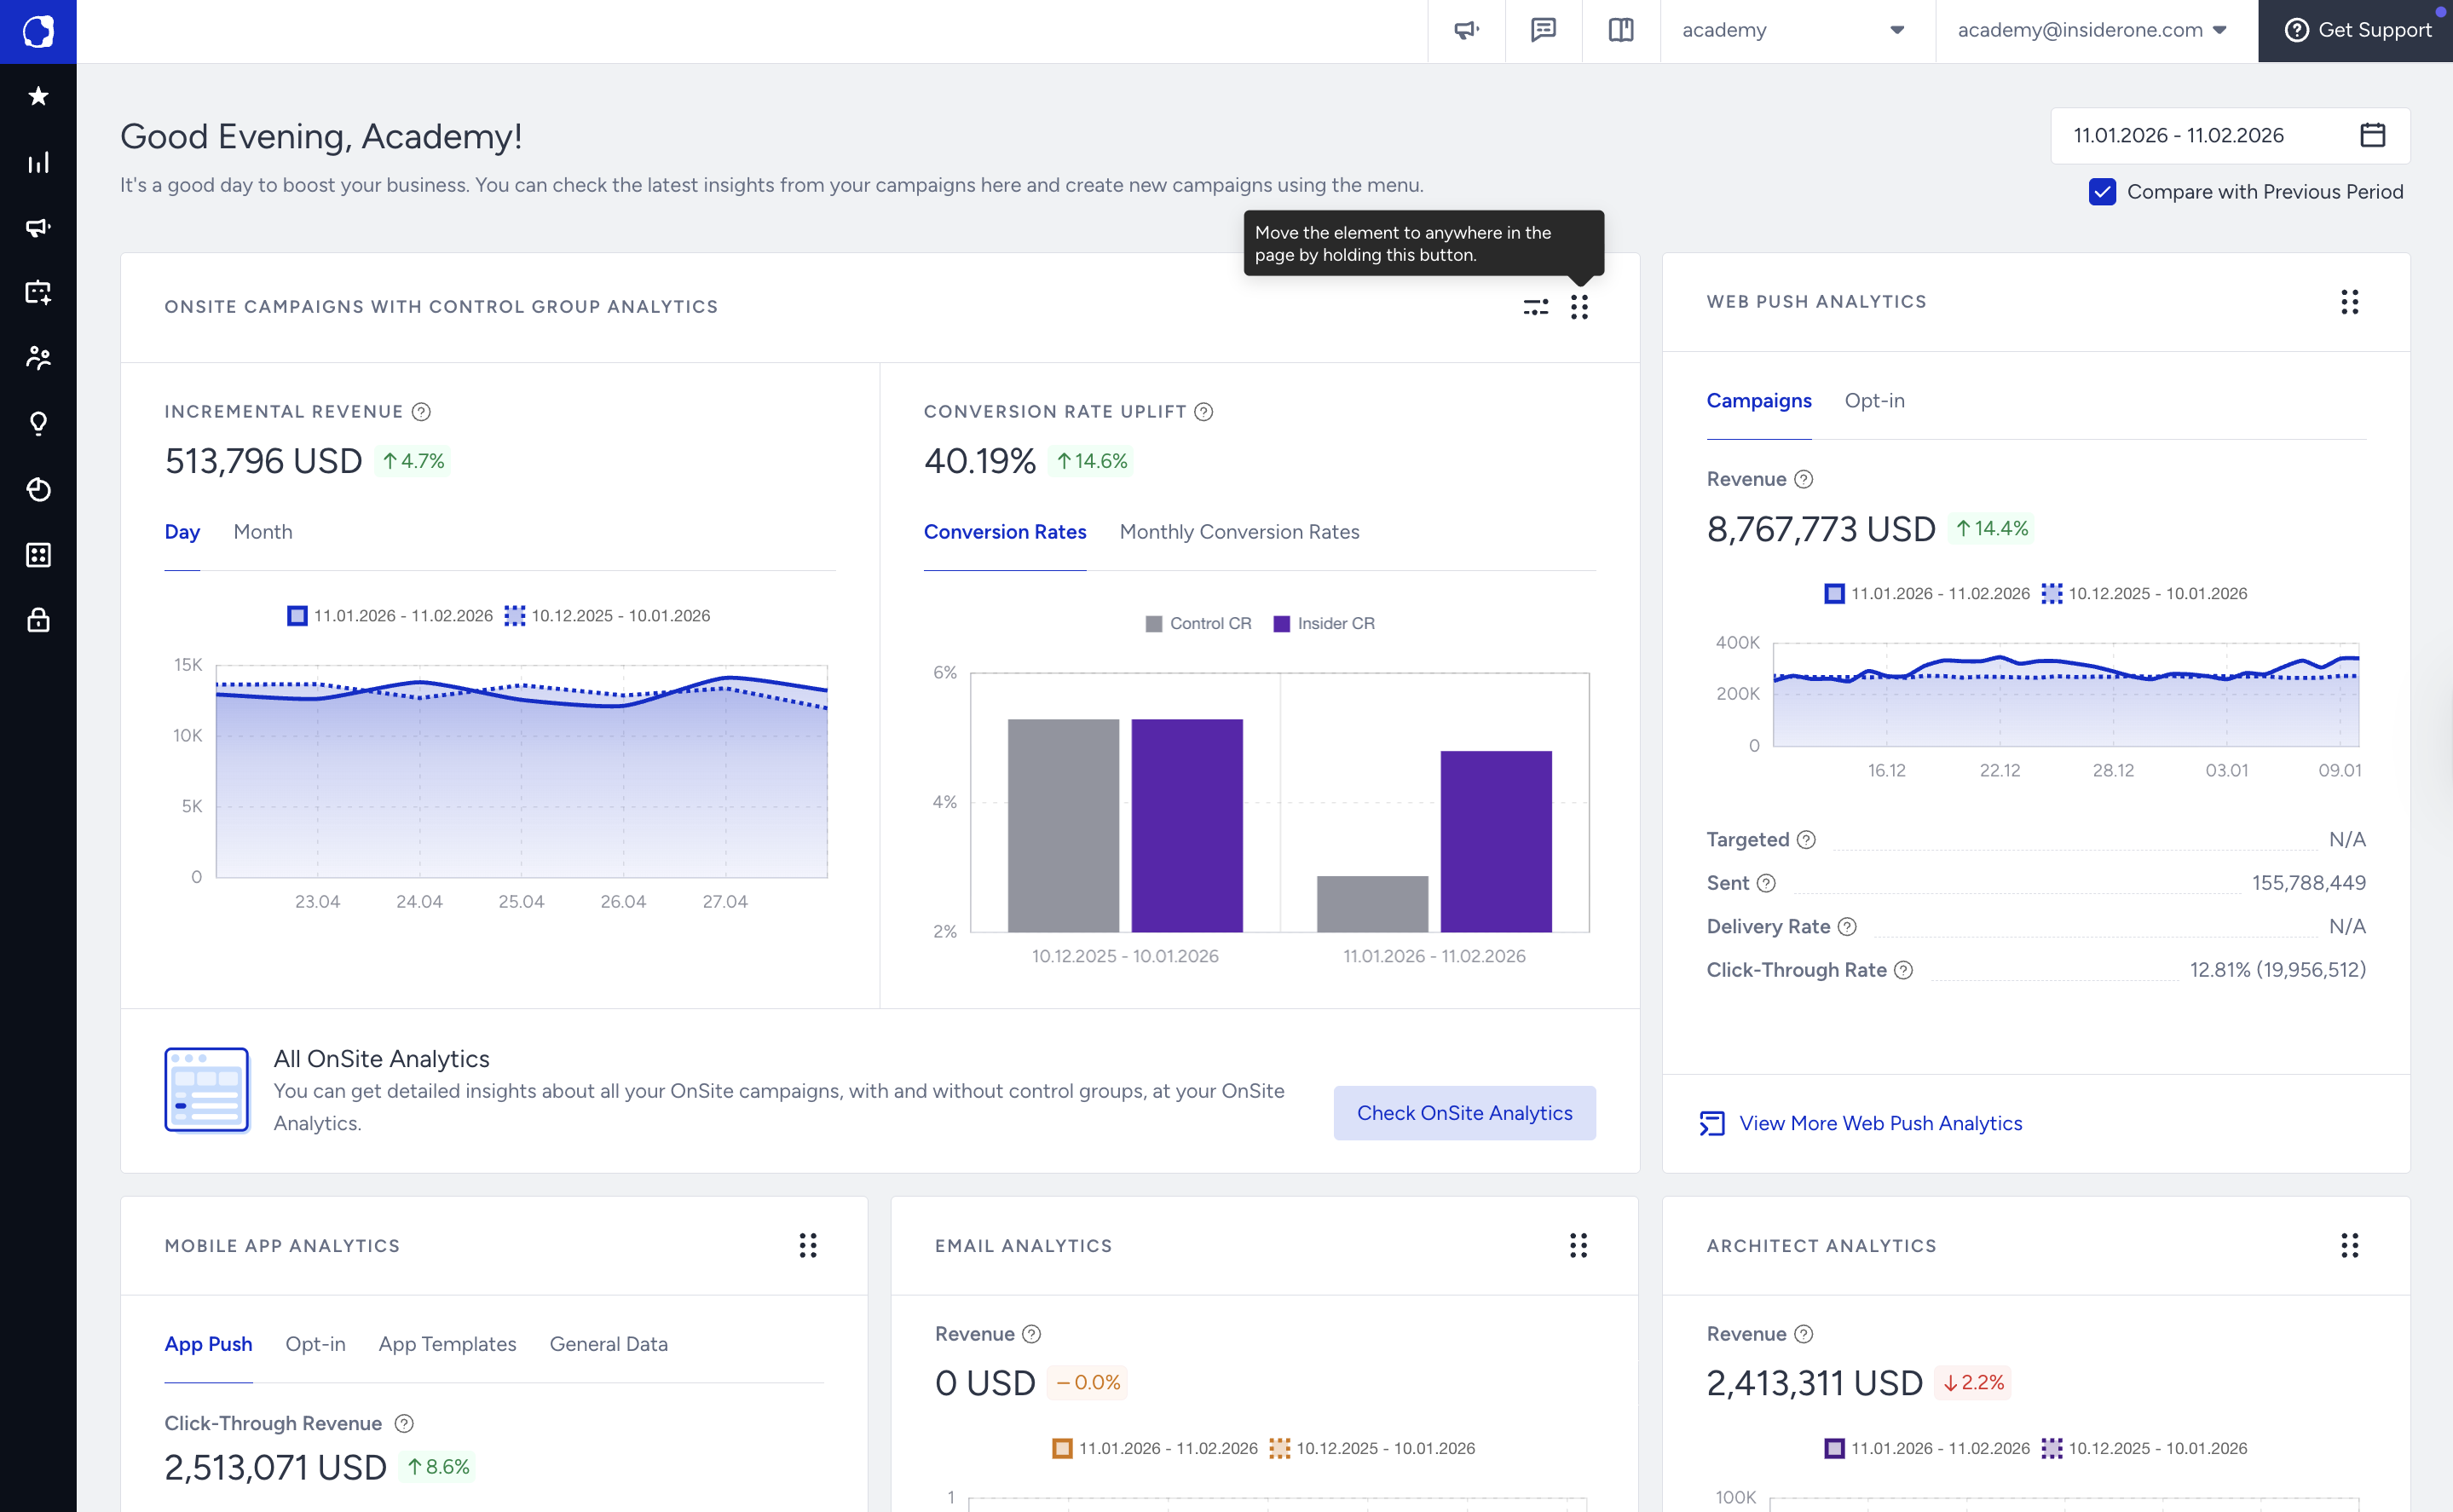
OnSite Campaigns with Control Group Analytics
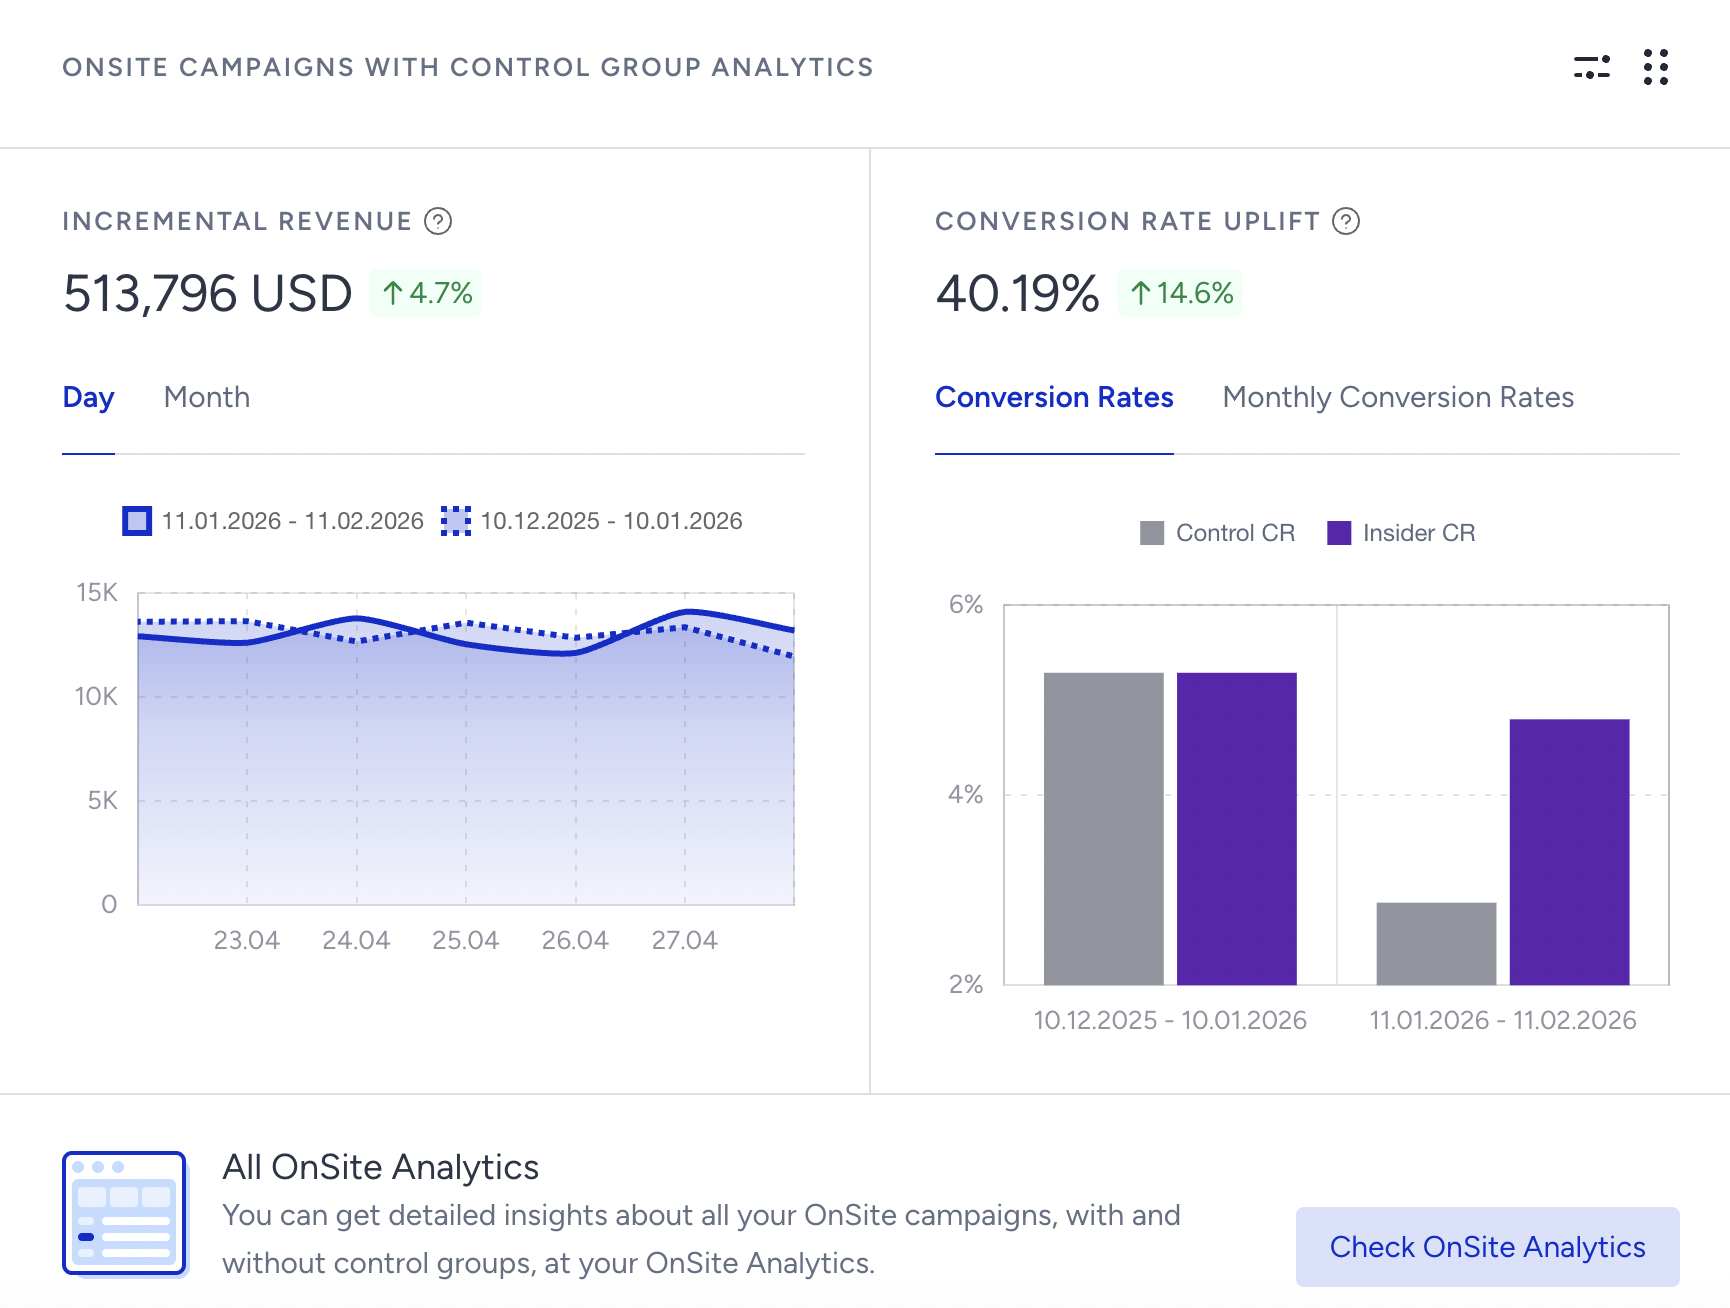
This dashboard section can provide insights into the incremental revenue and conversion rate uplift of on-site campaigns relative to the control group.
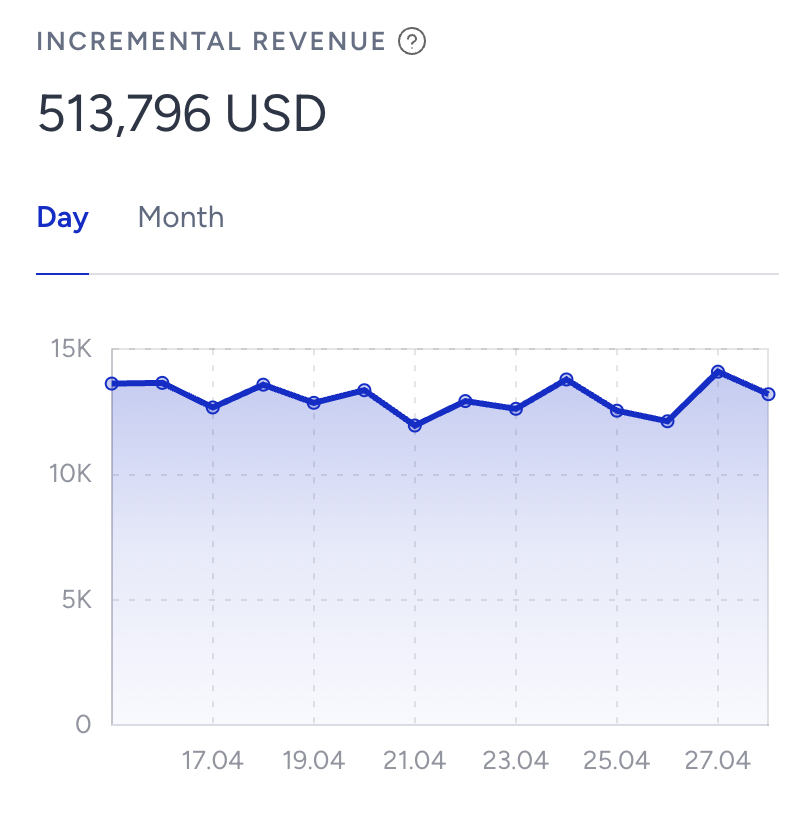
You can see the incremental revenue for the selected date range on the dashboard. Daily and monthly results are also represented.
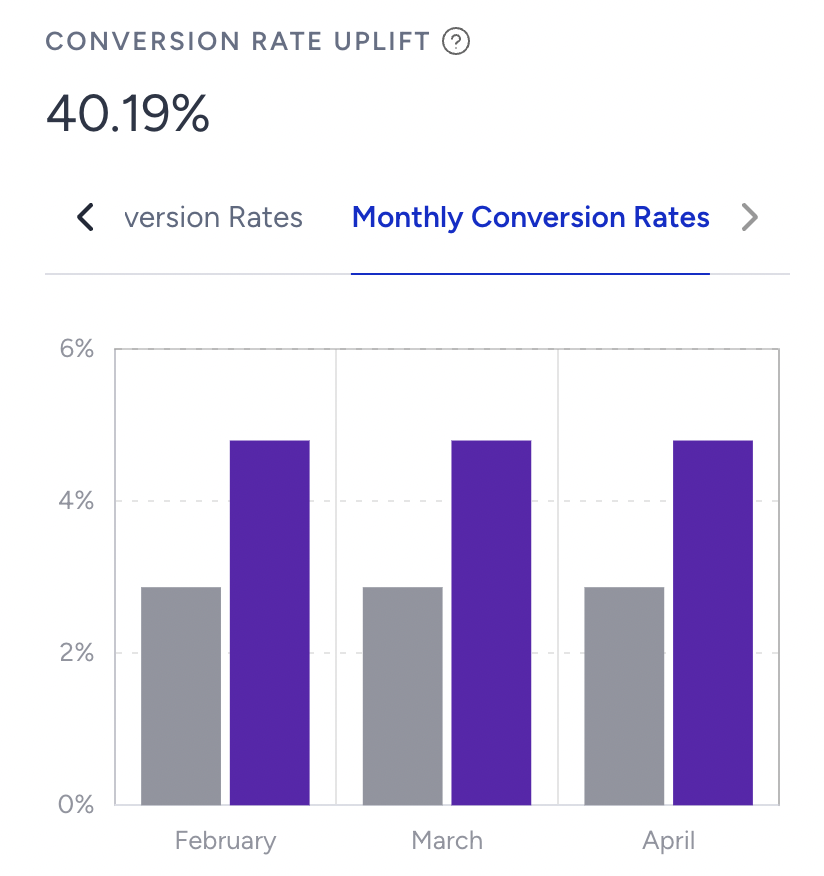
You can see the conversion rate uplift for the selected date range on the dashboard. This section compares the conversions for the control group and the Insider group, along with their monthly comparisons.
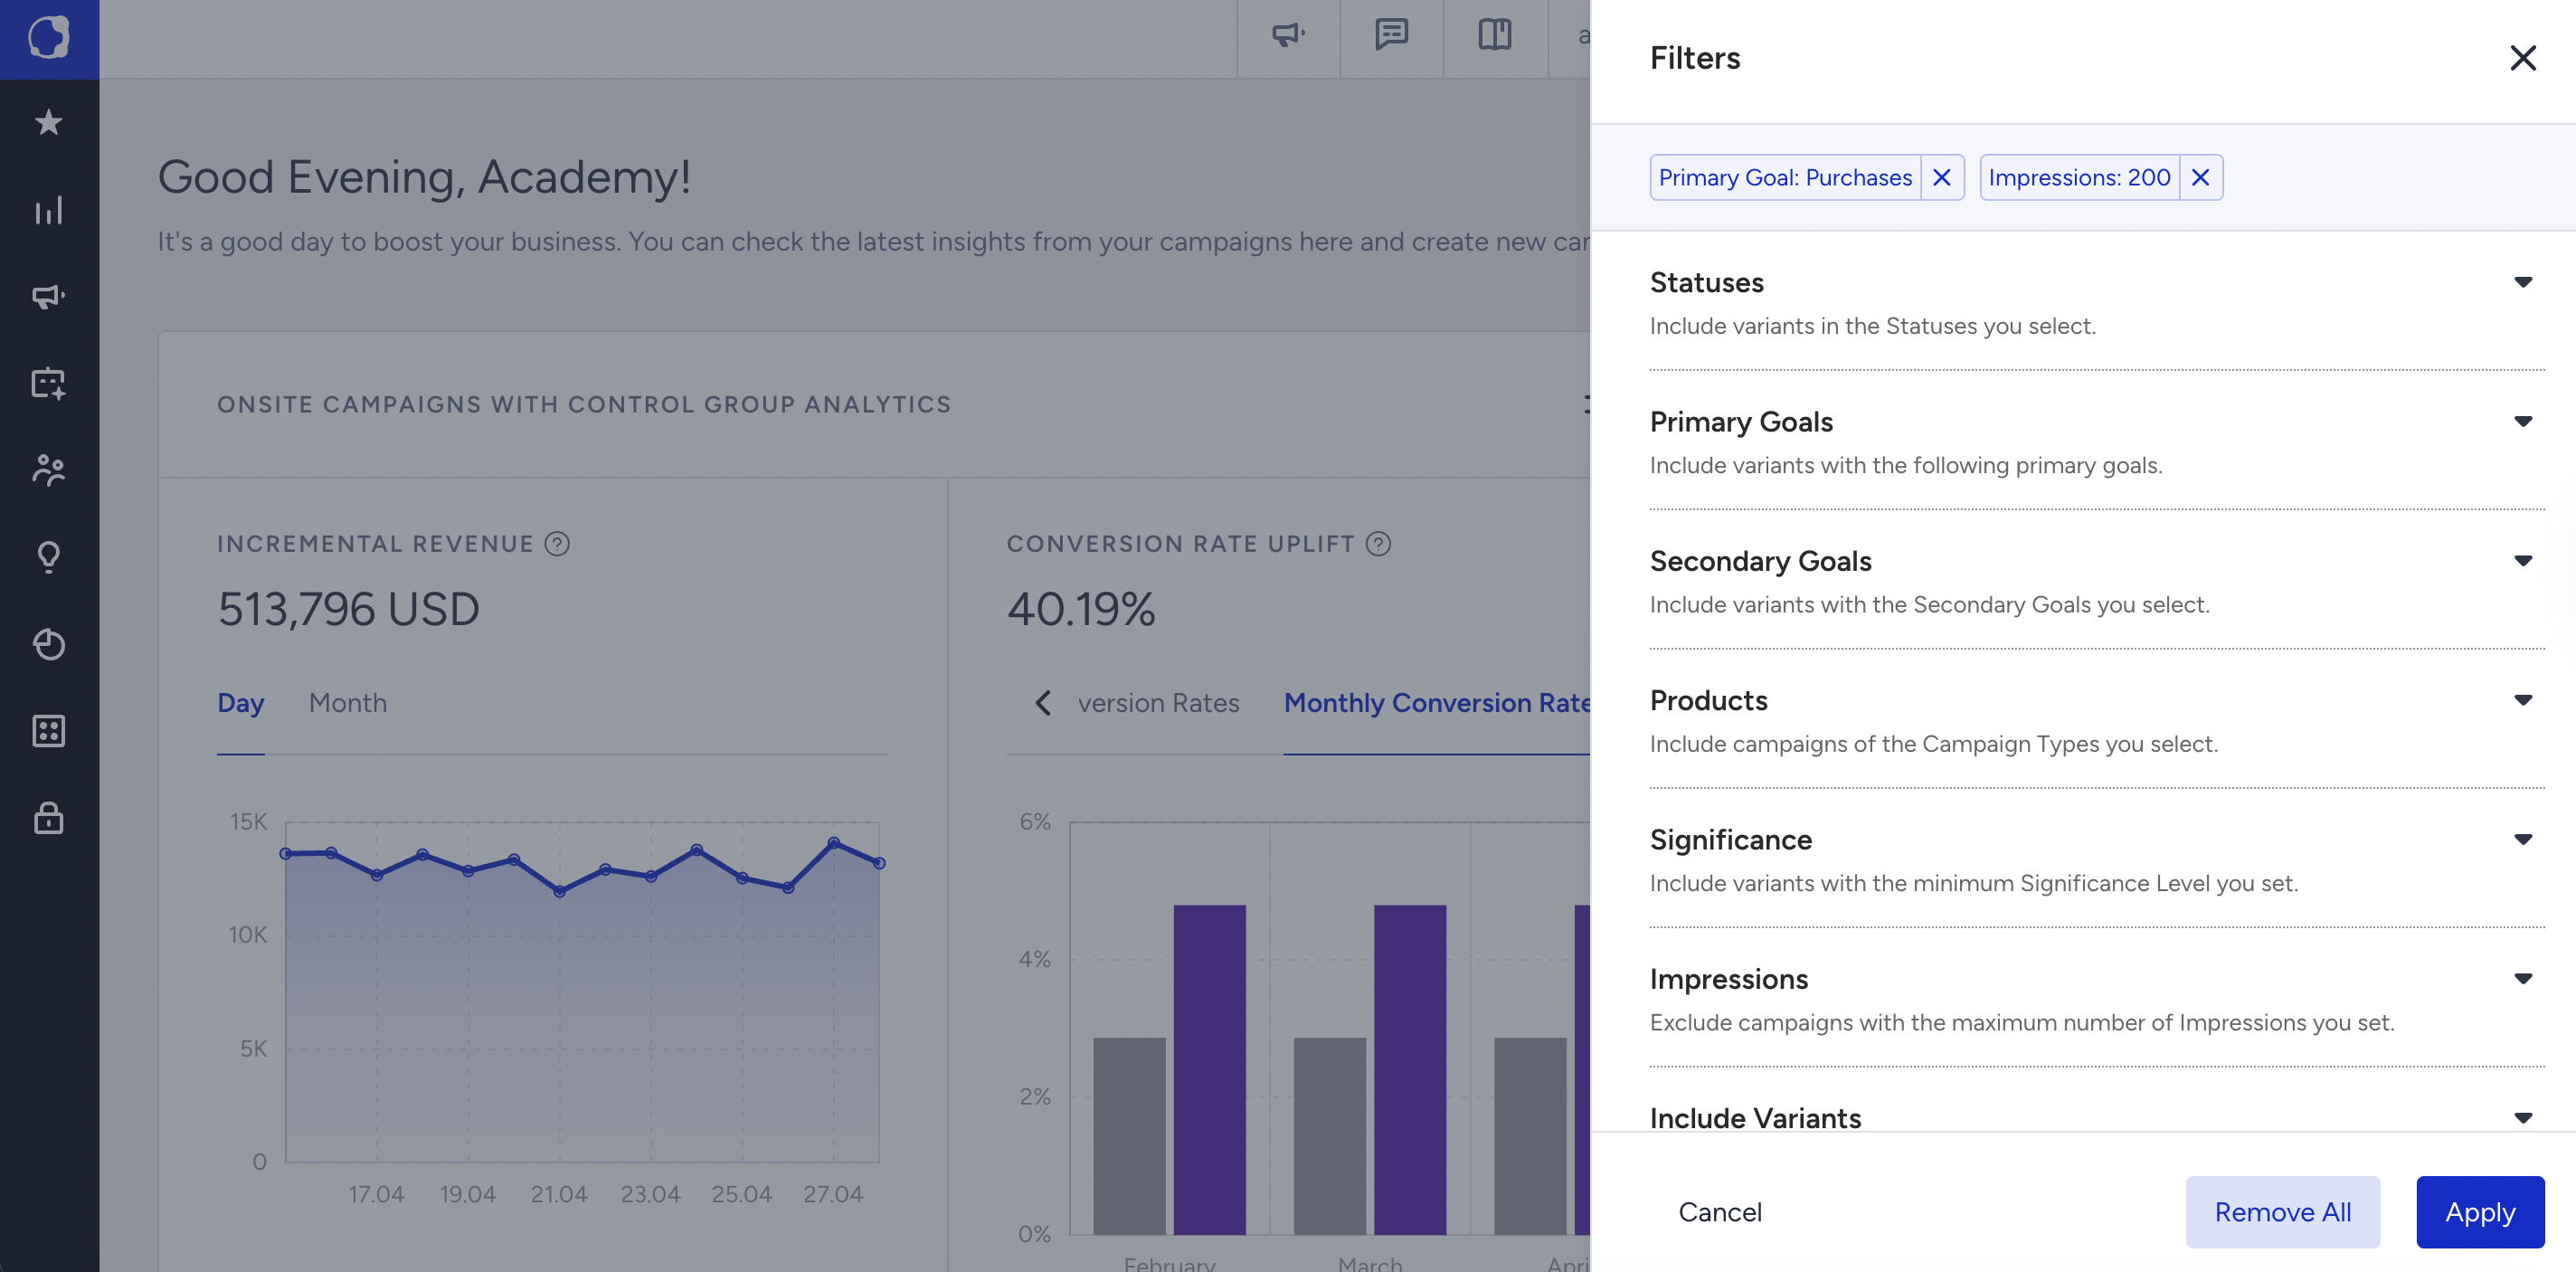
In OnSite Campaigns, you can also apply filters to the performance pages.

You can also see the All OnSite Analytics below this section. Detailed analytics let you view your campaign results using the filters and goals you select.
Mobile App Analytics
Mobile App consists of 4 sections: App Push, Opt-in, App Templates, and General Data.
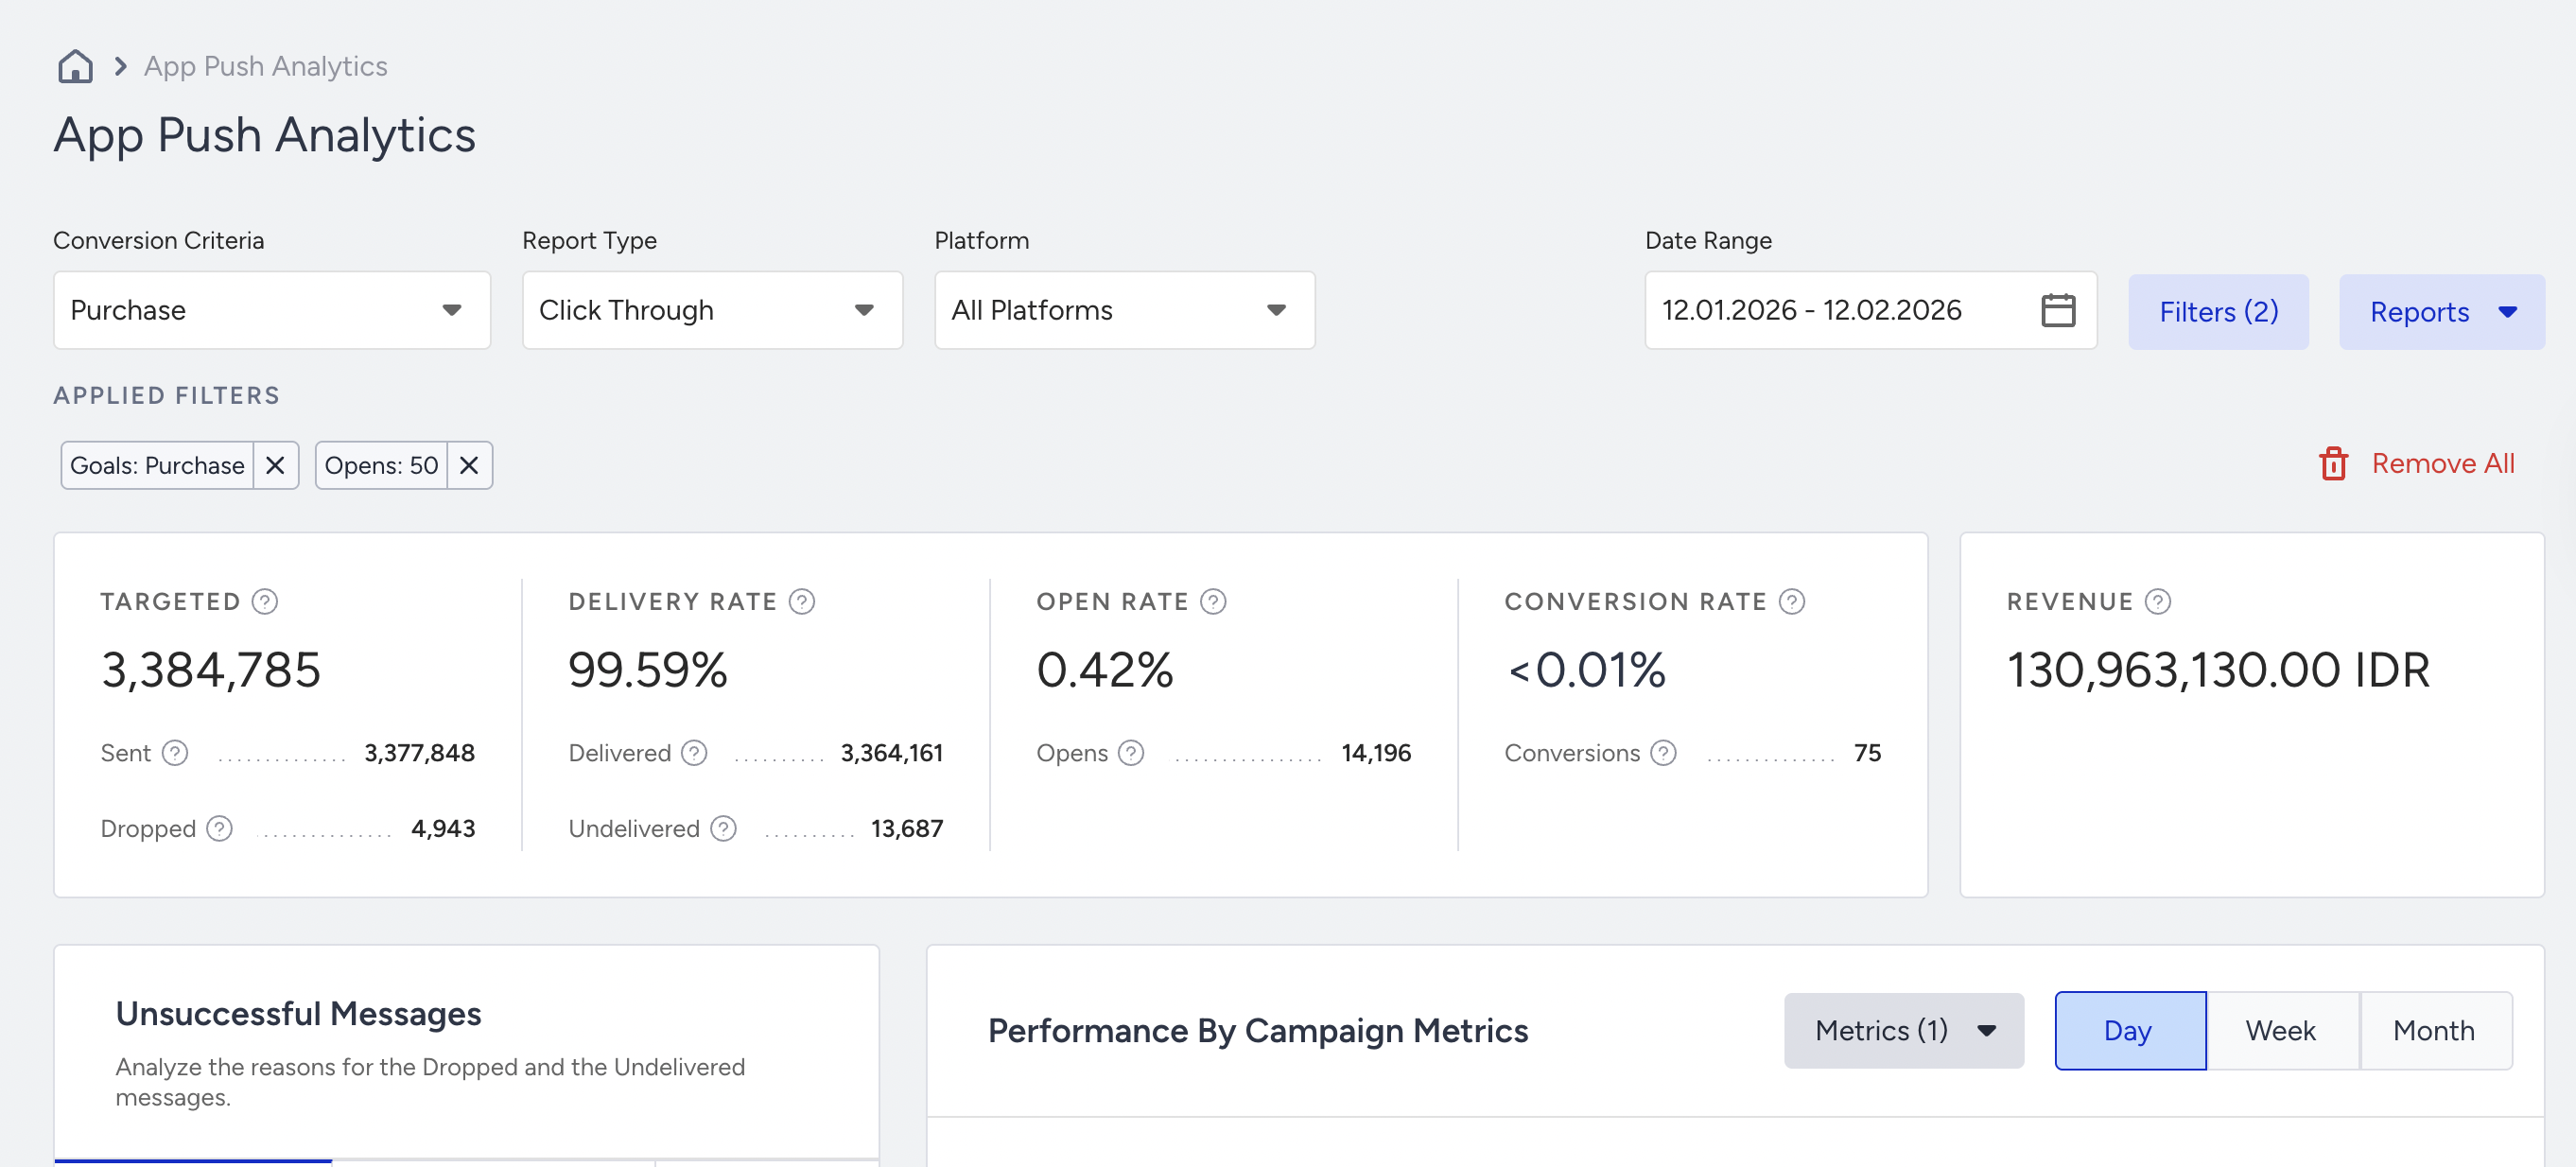
App Push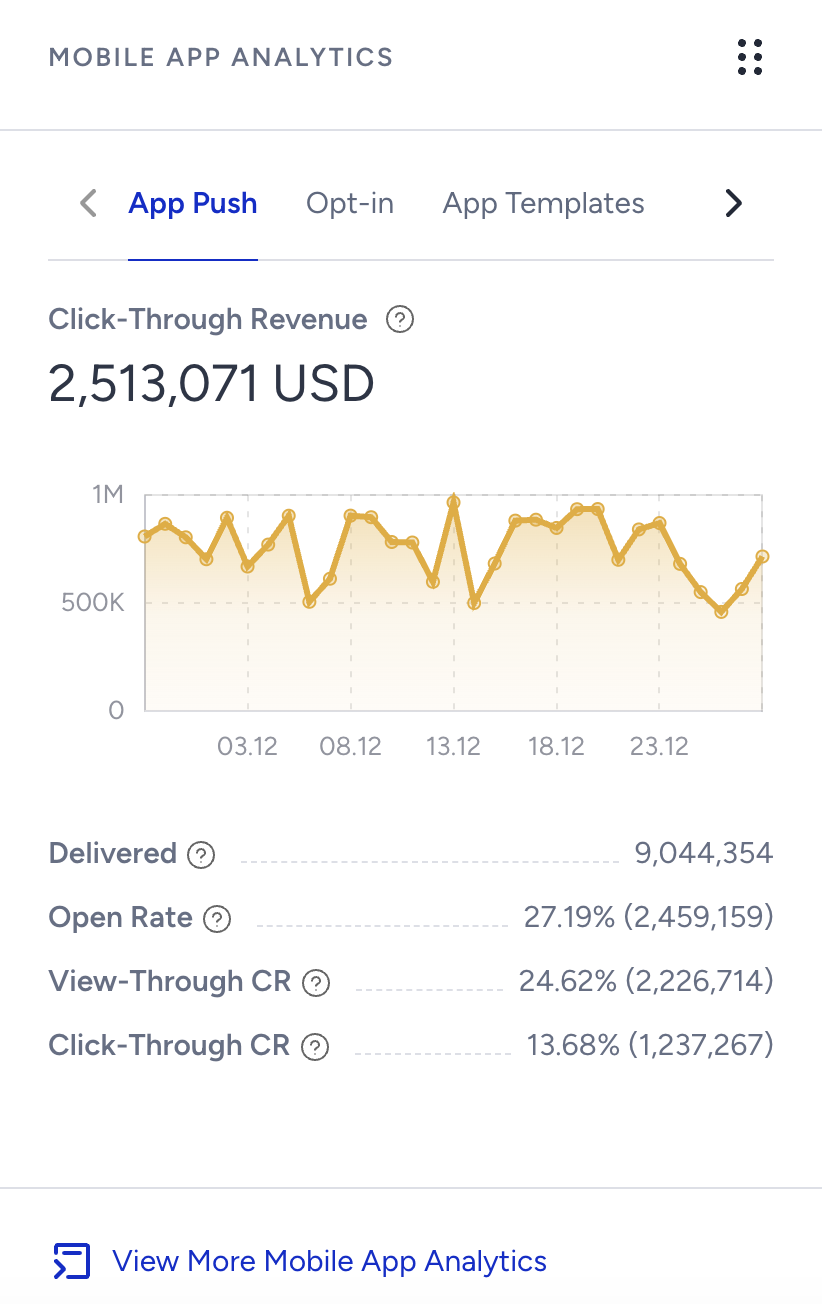
The App Push chart displays the following app push campaign metrics:
- Click-Through Revenue: The value of purchases made via clicks to your app push messages.
- Delivered: The number of app push messages successfully transferred to recipients.
- Open Rate: The percentage of opens to the number of delivered app push messages. Opens is the number of app push messages opened by the recipients.
- View-Through Conversion Rate: The percentage of the Primary Goal accomplishments in the set period by the recipients who viewed your App Push message to the number of Delivered messages.
- Click-Through Conversion Rate: The percentage of the Primary Goal accomplishments in the set period by the recipients who clicked your App Push message to the number of Delivered messages.
Opt-in
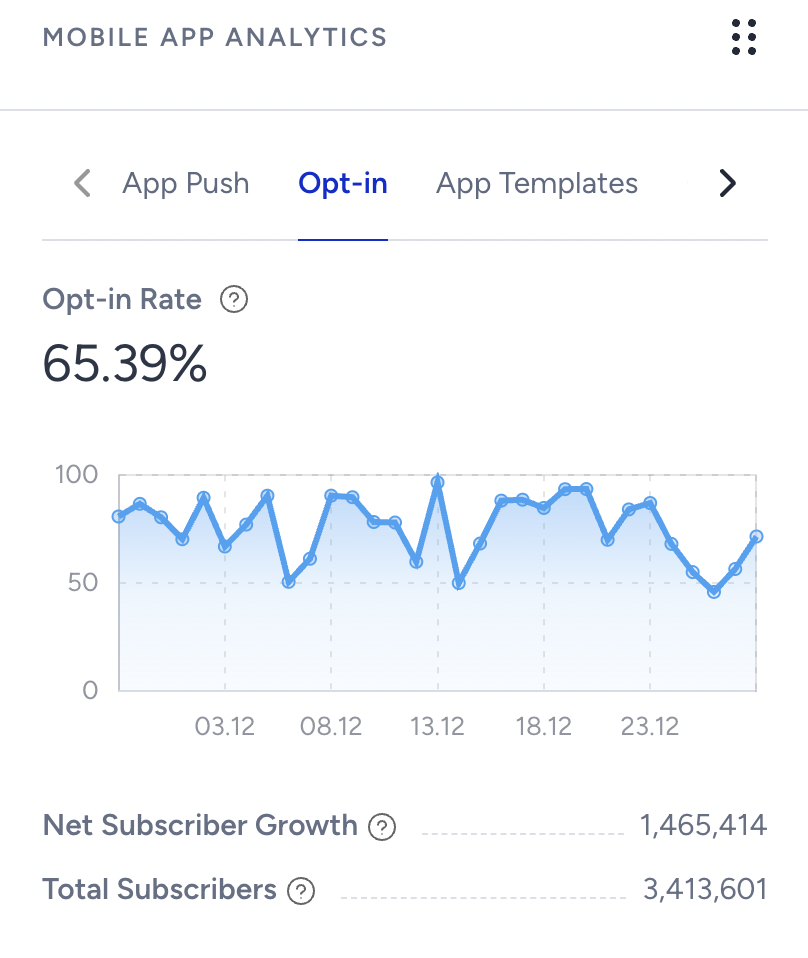
The Opt-in chart displays the following metrics:
- Opt-in Rate: The ratio of total subscribers (opt-ins) to the number of total engaged users for the last day. It is not responsive to the date picker.
The user's actions throughout the day are not tracked; only the last action at the end of the day is captured and logged. For example, the last updated data will be displayed if a user opts in in the morning, opts out at noon, and opts back in in the afternoon. In this case, it will be a single opt-in. - Net Subscriber Growth: The net increase in your total subscribers. The value shows the difference between the current subscribers' data and the initial data available for the customer.
- Total Subscribers: The total number of your current opted-in and active recipients. This is equal to the number of users whose opt-in = true and are active, meaning the users who have the app on their phone and have not uninstalled it. The value shows the current situation for the last day; it is not historical and is not responsive to the date picker selection.
App Templates
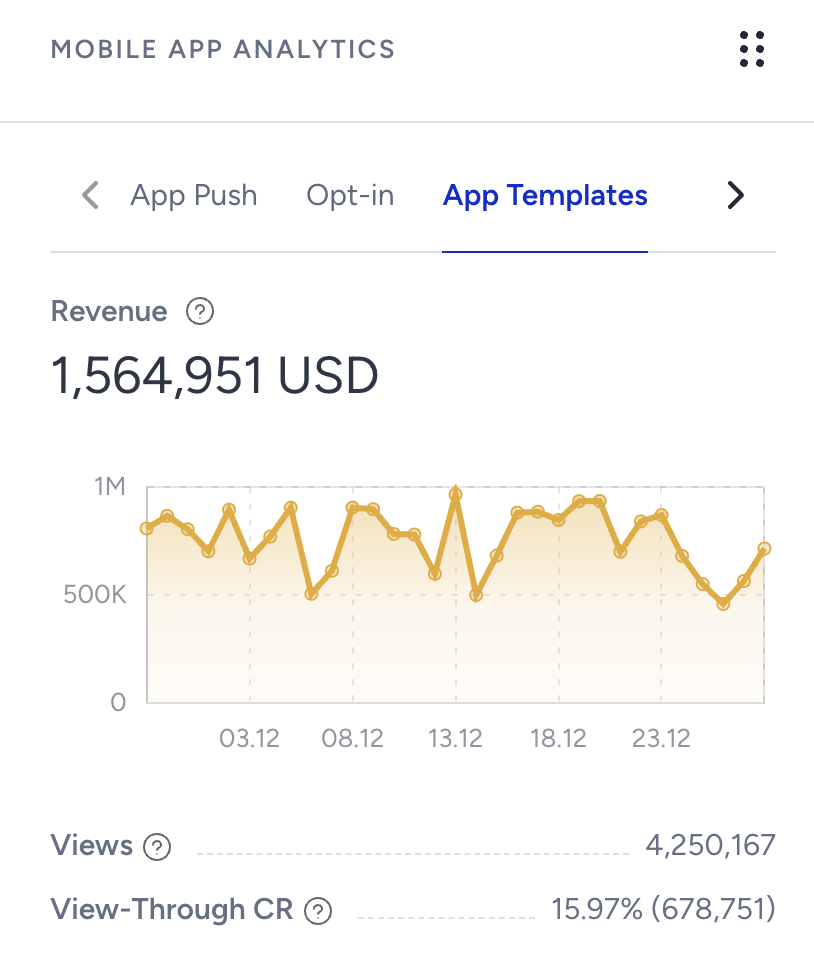
The InApp graph displays the following metrics:
- Revenue: The purchases made via InApp messages.
- Views: The number of views of your InApp messages by users.
- View-Through Conversion Rate: The percentage of primary goal accomplishments in the set period by the recipients who viewed your InApp message to the number of delivered messages.
General Data
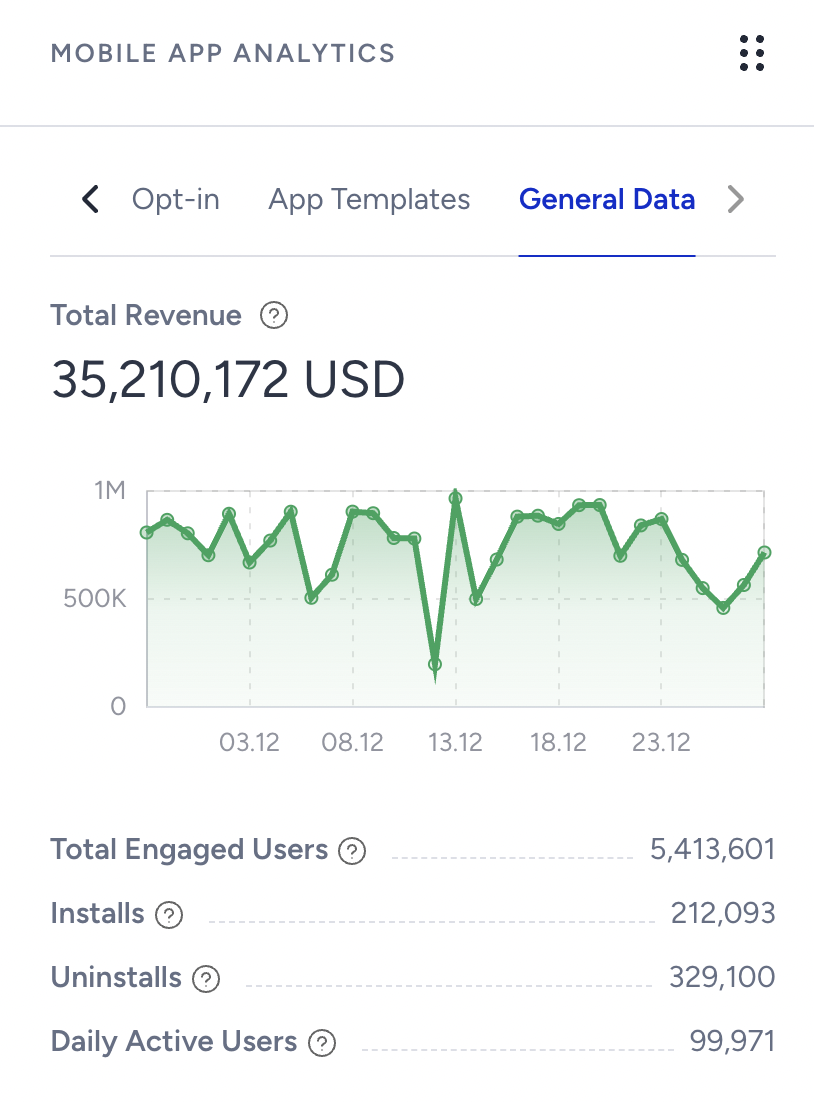
The General Data graph displays the following metrics:
- Total Revenue: The total value of all purchases made via your mobile app. This is the entire revenue coming from your app, independent from campaigns launched for the selected date range.
Revenue is tracked based on the "confirmation page view" event. Returns are not attributed to the revenue.
The graph shows the trend in total revenue for the selected date range. - Total Engaged Users: The number of your current app users who installed your app and accessed it at least once in the last 365 days. This metric equals the number of active users on your mobile app. The data is not historical and covers only the last day of the selected range.
- Installs: The total number of times that your users installed your mobile app. The attribute value will be updated if a user uninstalls and re-installs the app. The value accounts for all downloads per user, not just the first.
- Uninstalls: The total number of times that your users uninstalled your mobile app. The value counts all uninstalls per user, not just the first. The data is not historical and covers the last day of the selected date range.
- Daily Active Users: The number of users who interacted with your mobile app yesterday. The data is not historical and covers the last day of the selected date range.
If you select May 12, the daily active users will show the value for May 11. This metric equals the Active Users Today metric in the mobile app panel.
Click the View More App Analytics button to view more insights on your Mobile App. You can use the mobile dashboard to see the detailed metrics.
Web Push Analytics
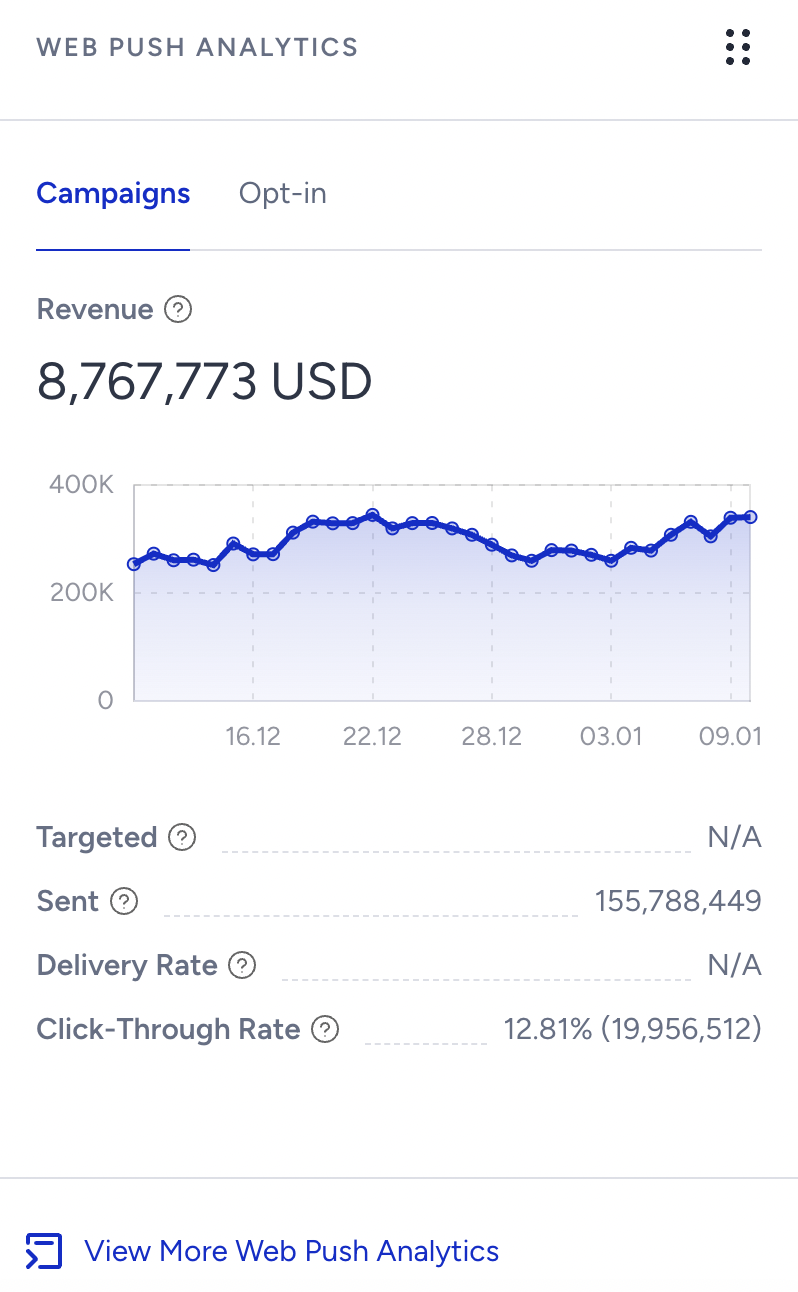
Web push metrics enable you to have insights about your web push campaigns and opt-in results.
Campaigns metrics include:
- Revenue: The value of purchases made via your web push messages.
- Targeted: The number of recipients in your target audience generated based on the segmentation of your campaign.
- Sent: The number of web push messages successfully transferred to the service provider to be addressed to the recipients.
- Delivery rate: The percentage of the delivered to the sent web push messages.
- Click-through rate: The percentage of the clicks to the delivered web push messages
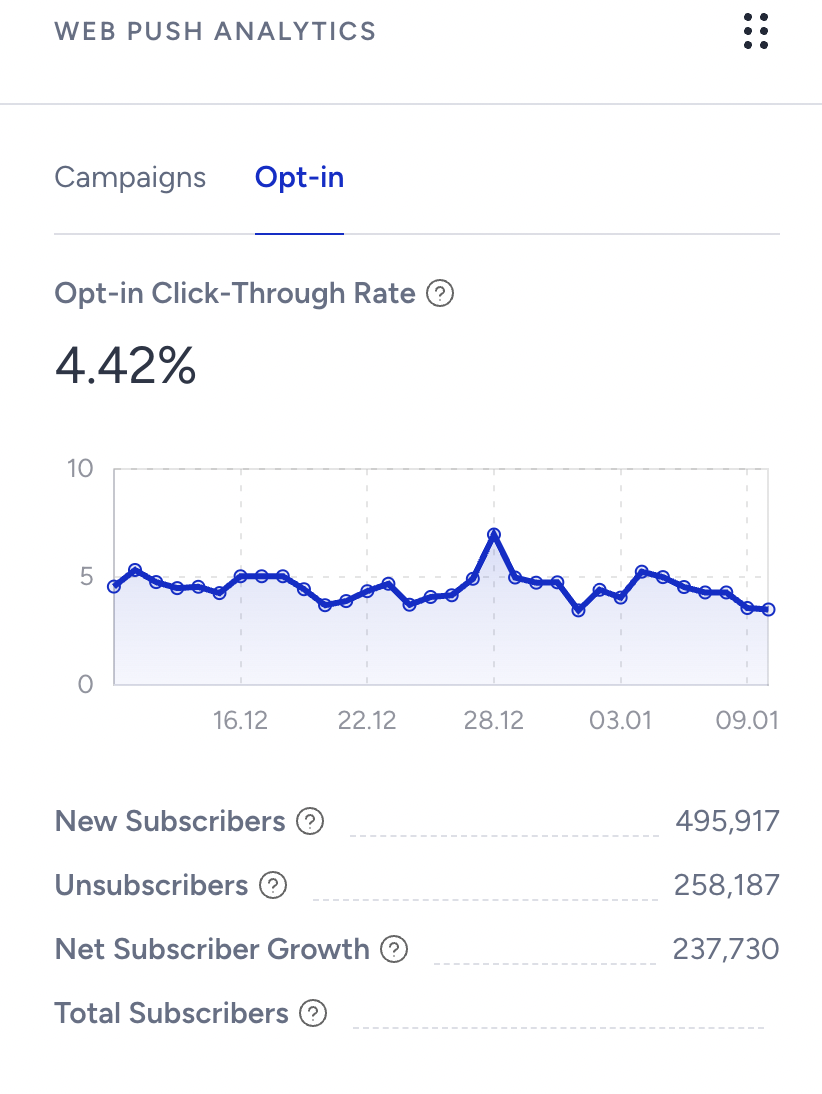
You can use opt-in metrics to have insights about:
- Opt-in click-through rate: The ratio of the new subscribers to the number of opt-in proposition views.
- New subscribers: The number of users who opted in for your web push messages in the selected period of time.
- Unsubscribers: The number of recipients who opted out from your web push messages in the selected period of time.
- Net subscriber growth: The net increase in your total subscribers in the selected period of time.
- Total subscribers: The total number of your current web push message recipients.
You can use this section to navigate to the overall analytics and opt-in analytics.
Email Analytics
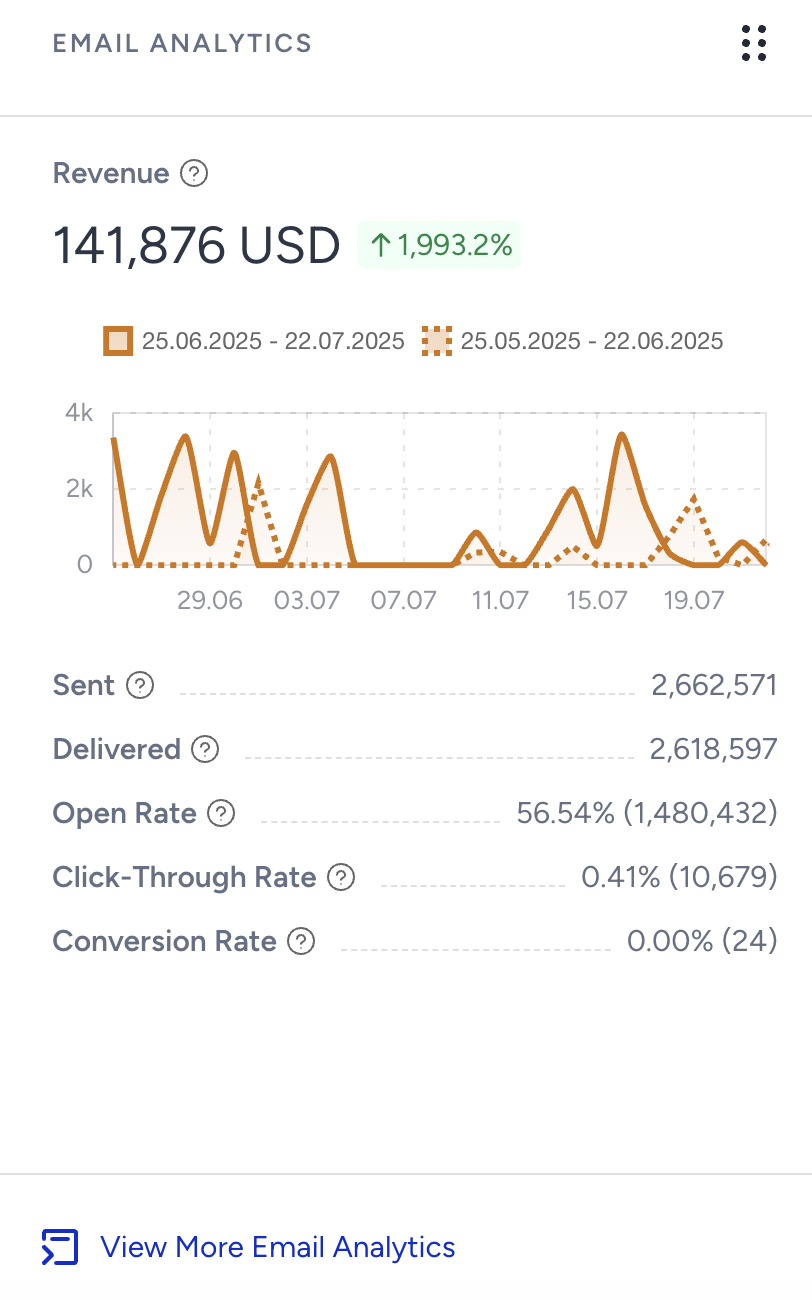
Email metrics help you have insights about:
- Revenue: The total value of the purchases made via your email messages.
- Sent: The number of email messages addressed to the recipients.
- Delivered: The number of email messages successfully transferred to the recipients.
- Open rate: The estimated percentage of the unique (user and MPP) opens to the delivered email messages. Unique Opens is the number of email messages that a single recipient opened for the first time.
- Click-through rate: The percentage of the clicks to the delivered email messages. Clicks is the number of times that the recipients interacted with your email message.
- Conversion rate: The percentage of the conversion to the number of delivered email messages. Conversions is the number of successful goal accomplishments.
You can click the View More Email Analyics button to reach the Analytics page.
Architect Analytics
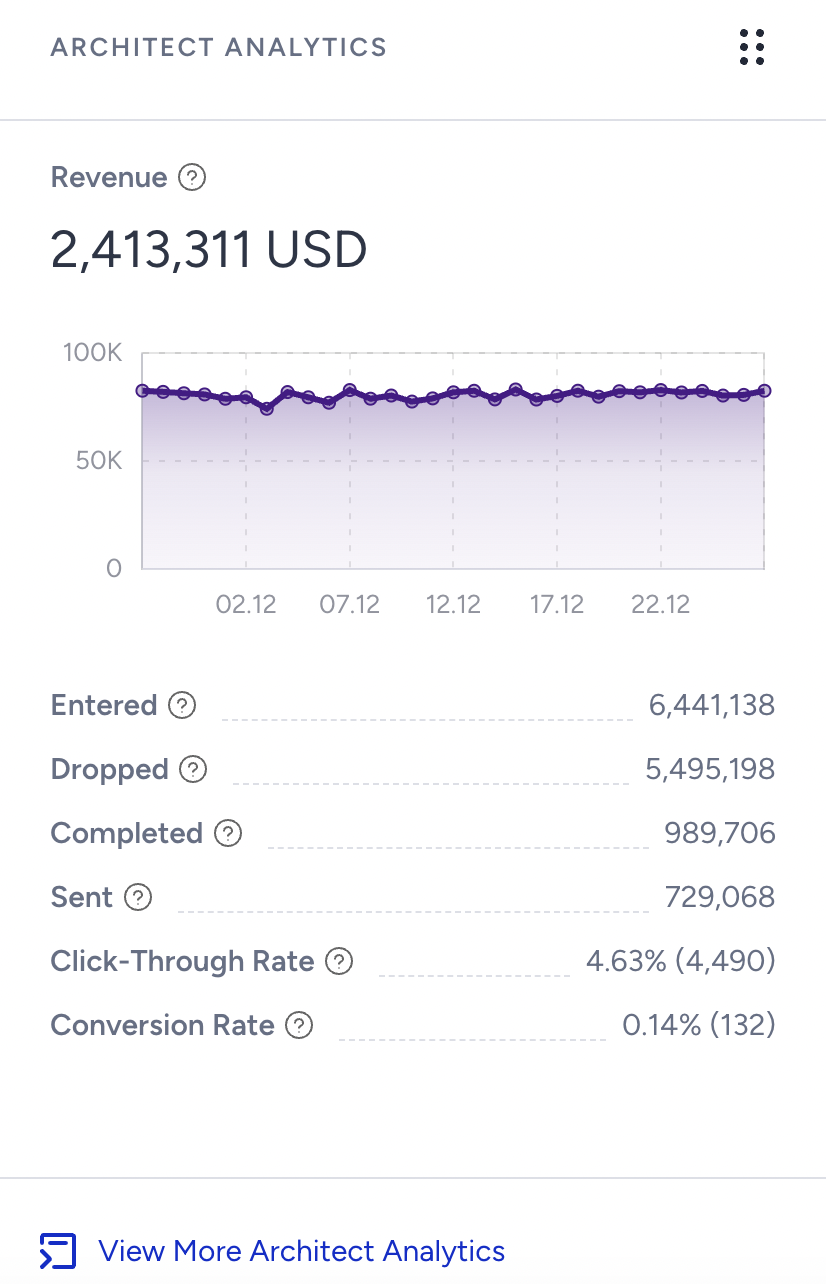
Architect metrics enable you to have insights about:
- Revenue: The total value of the purchases made via all channels in all journeys.
- Entered: The number of users who became eligible and started the journeys.
- Dropped: The number of users who got dismissed from the journeys due to channel reachability.
- Completed: The number of users who finished the journeys by reaching the last element or an empty path, excluding the non-reachable paths.
- Sent: The number of messages successfully transferred to the service provider to be addressed to the recipients.
- Click-through rate: The percentage of the clicks to the sent messages via all channels in all journeys. Clicks is the number of times that users interacted with your campaign via a channel in all journeys.
- Conversion rate: The percentage of the conversions to the delivered messages via all channels in all journeys. Conversions is the number of successful goal accomplishments via a channel in all journeys.
You can also click the View More Architect Analytics button and reach the analytics dashboard.
Custom Goal Metrics
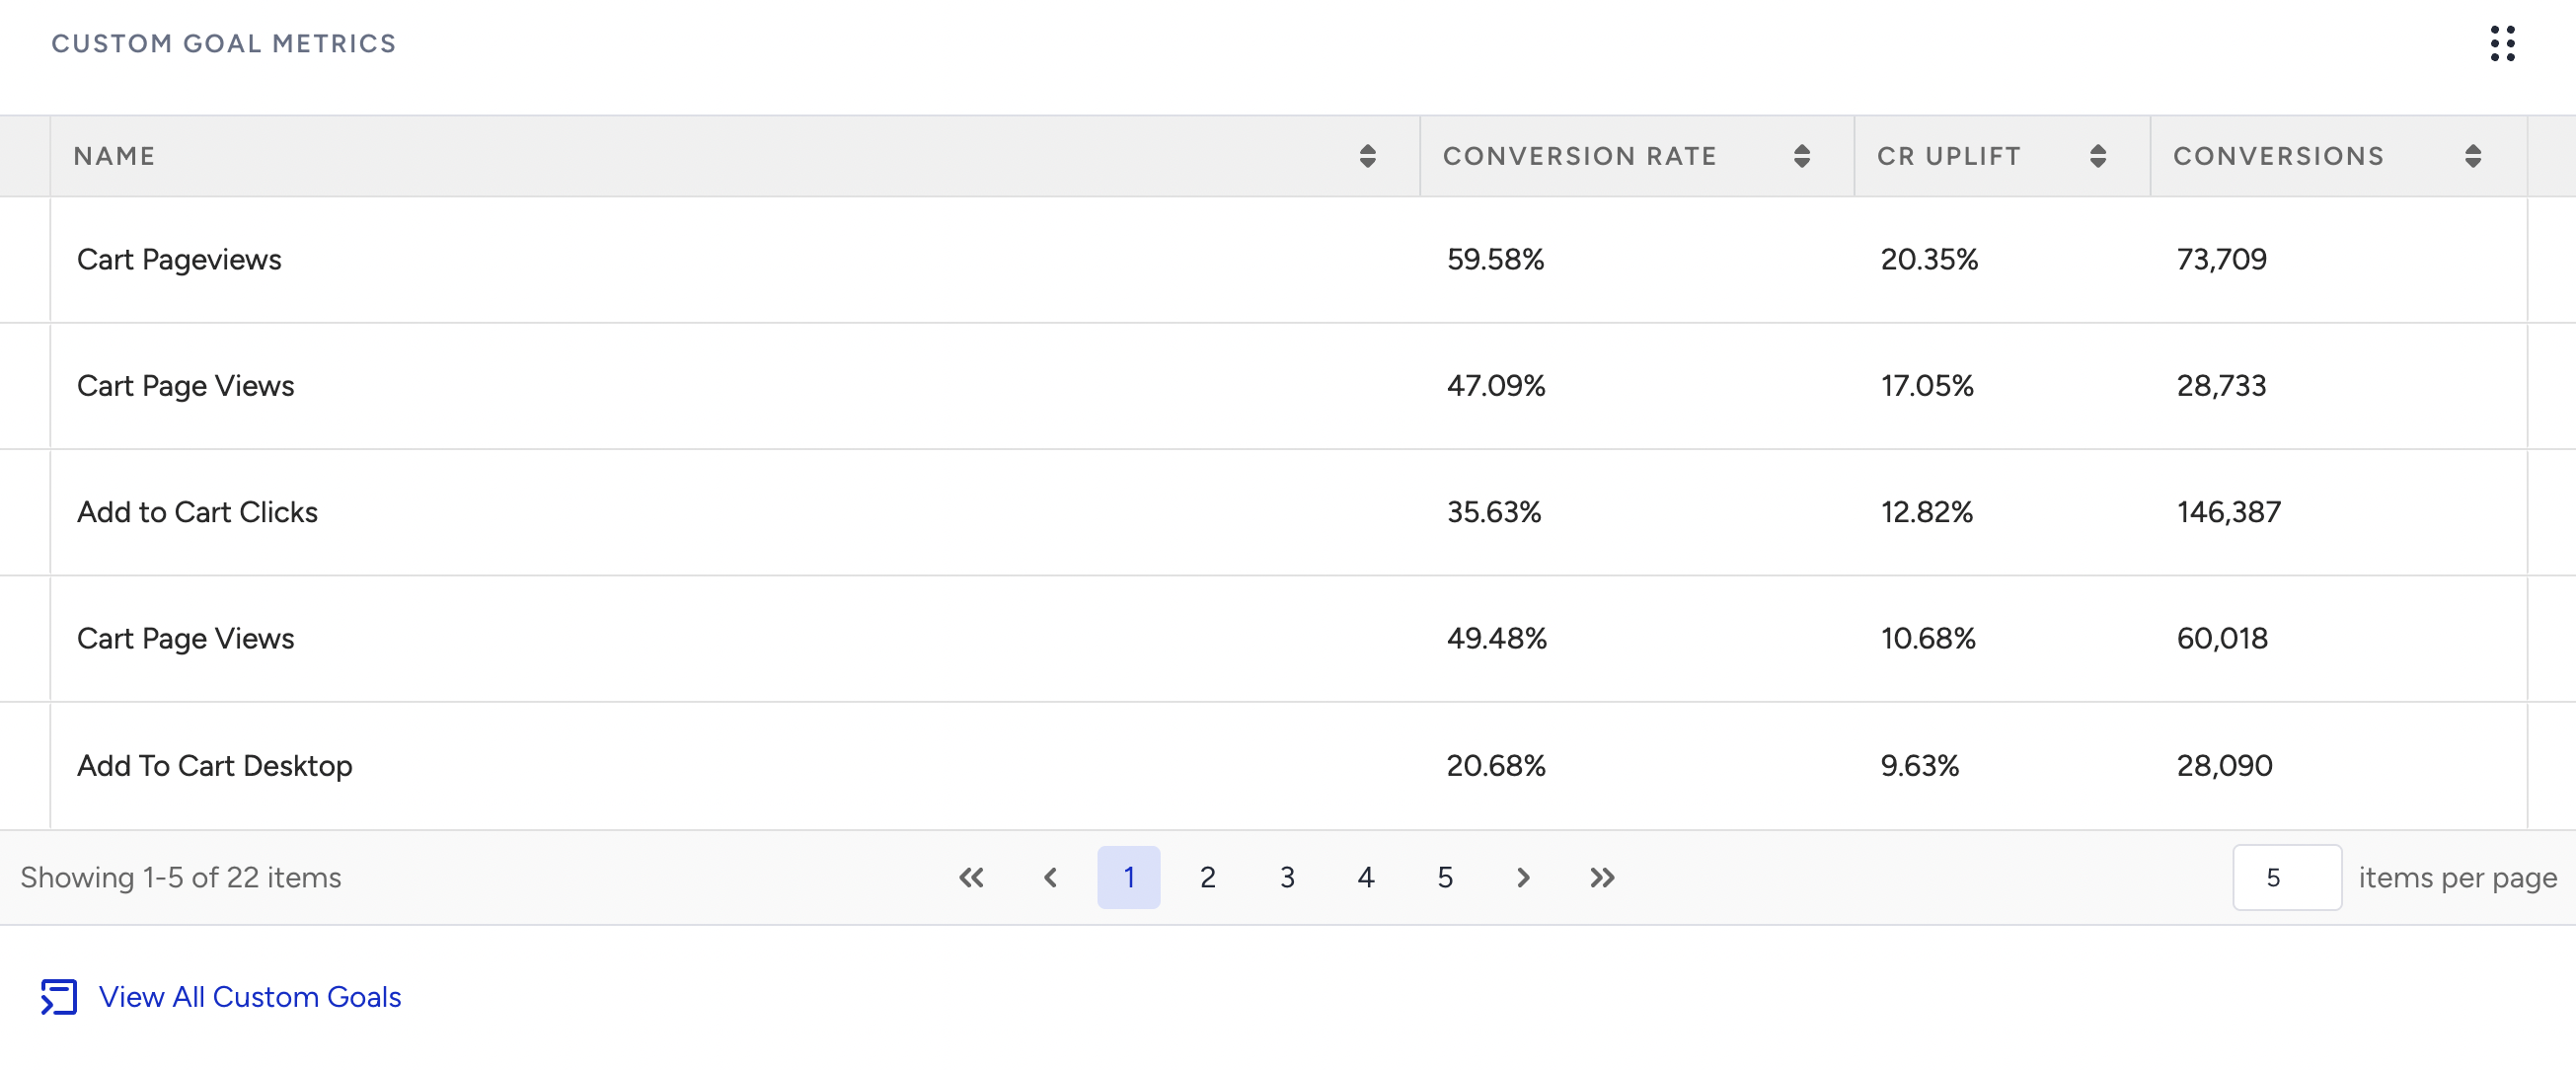
ESD also lets you view the conversion rate, uplift, and other metrics for your custom goals.
Clicking the View All Custom Goals button, you can see the list of your custom goals along with the mentioned metrics and their goal type.
Discover
The Discover section lists some of the recent developments about Insider's products. You can click the Learn more button to learn more about the features.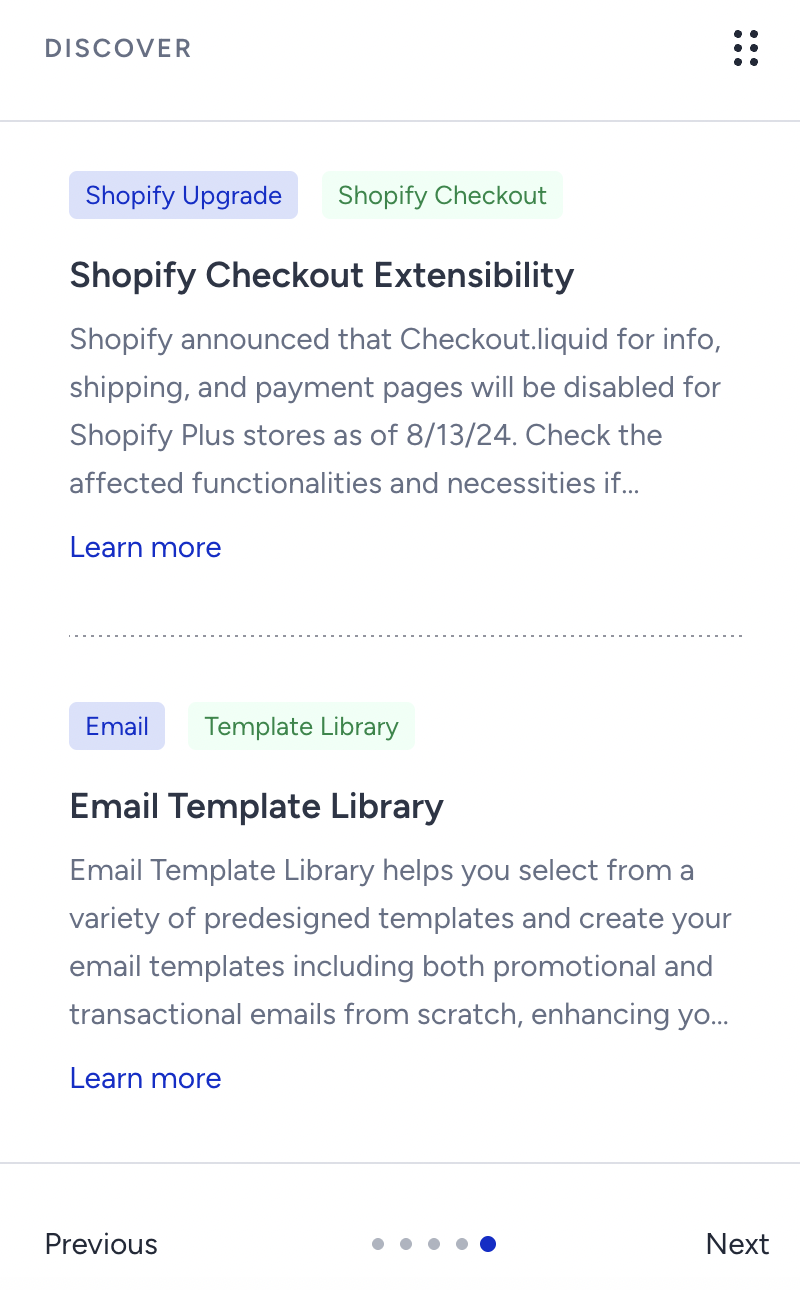
You can click the Previous and Next buttons or the bullets to change the slider.
Current Active Campaigns
The current active campaigns help you check the status of your most recent campaigns. You can click the Analytics and Details button icons against the campaign you want to see more about.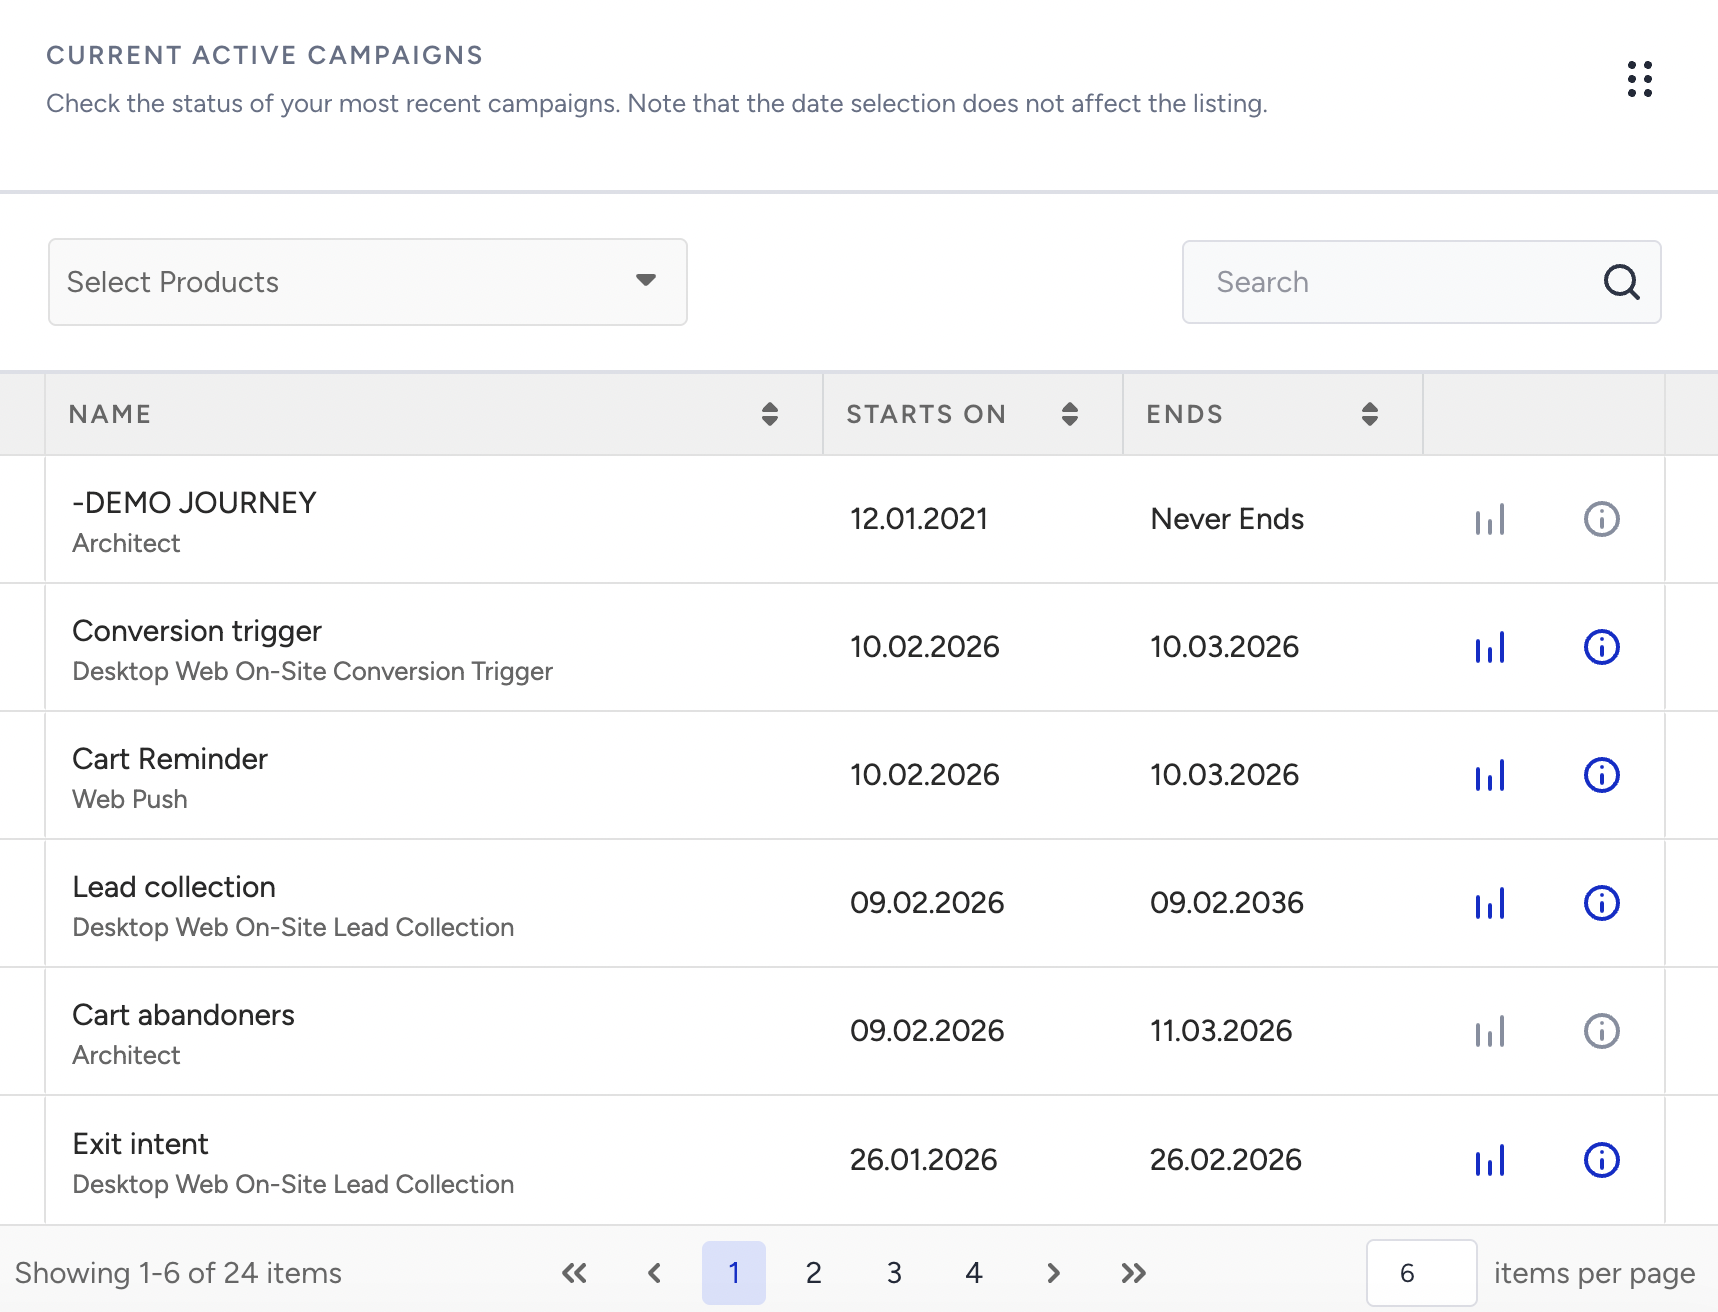
The campaigns will be listed here if they are Active at that time. The date picker does not affect the campaigns listed in this section. By default, the All Products (n) option is selected in the dropdown, where n is the number of campaigns. You can change the selection to a product to view only the campaigns created in that product.