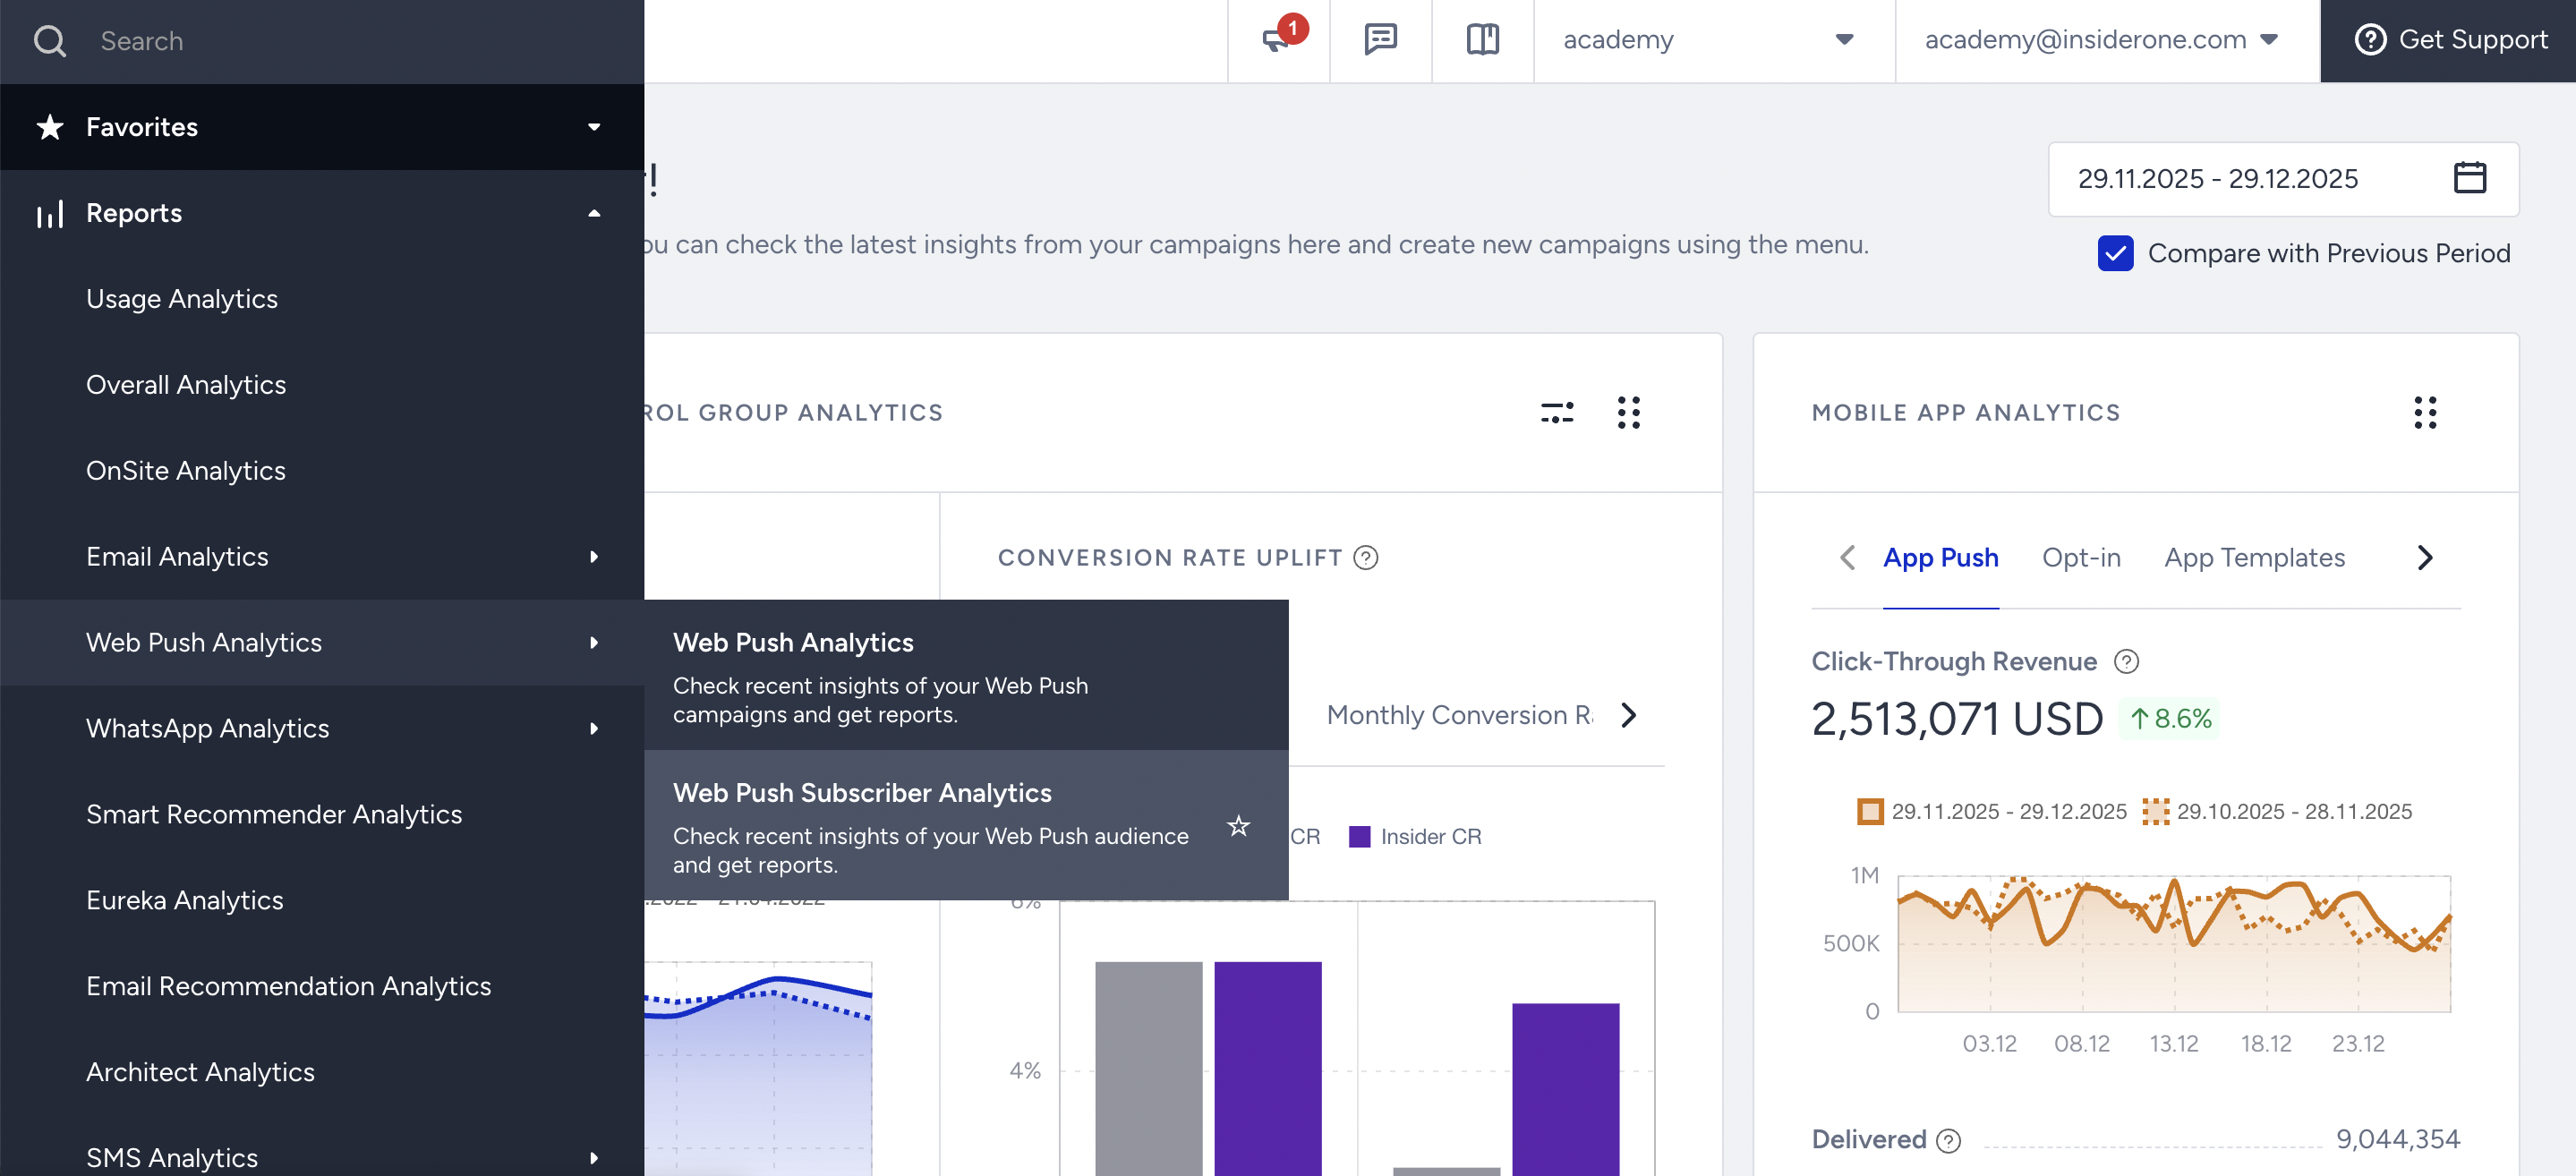
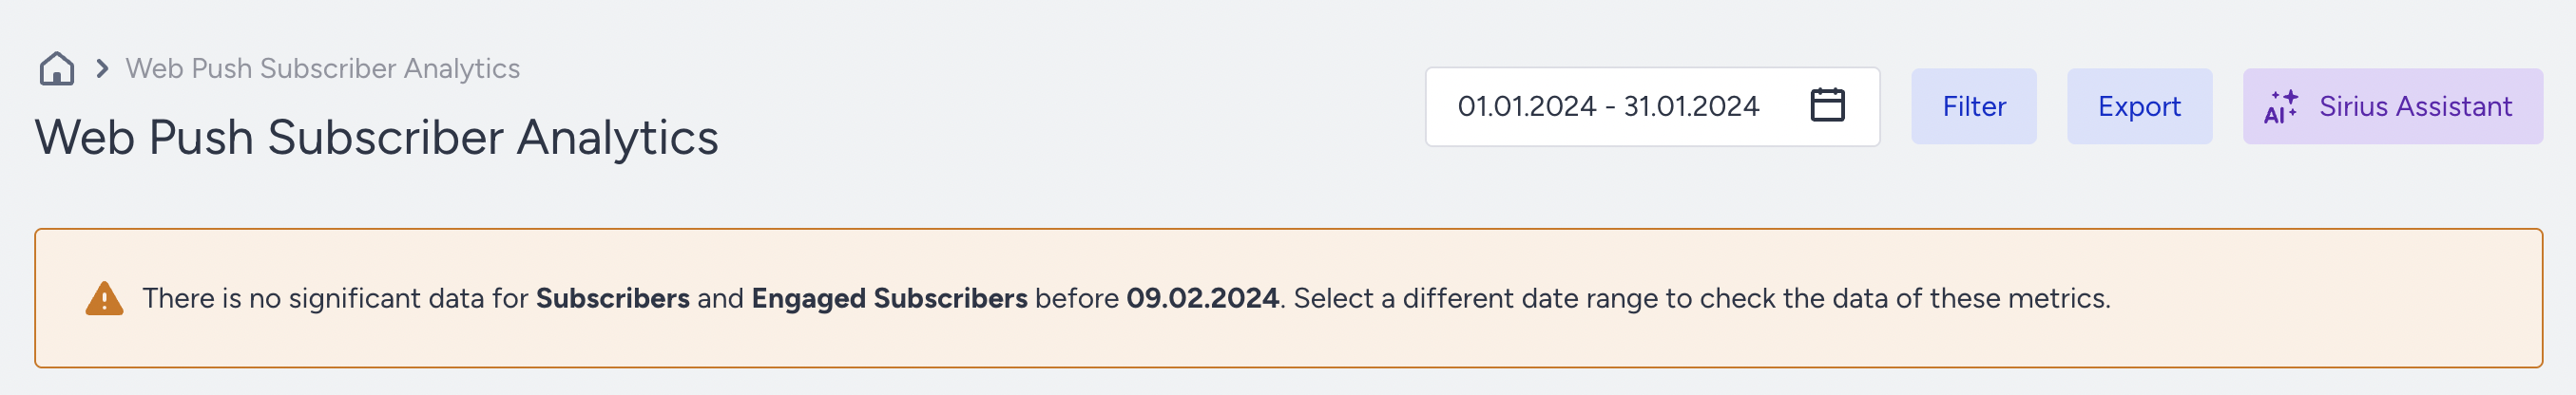
To view detailed data about your Web Push subscribers, go to Reports > Web Push Analytics > Web Push Subscriber Analytics in your Insider One's InOne panel.
This section provides insights into opt-in trends, subscription growth, browser distribution, and user engagement with Web Push notifications.
Understanding the report
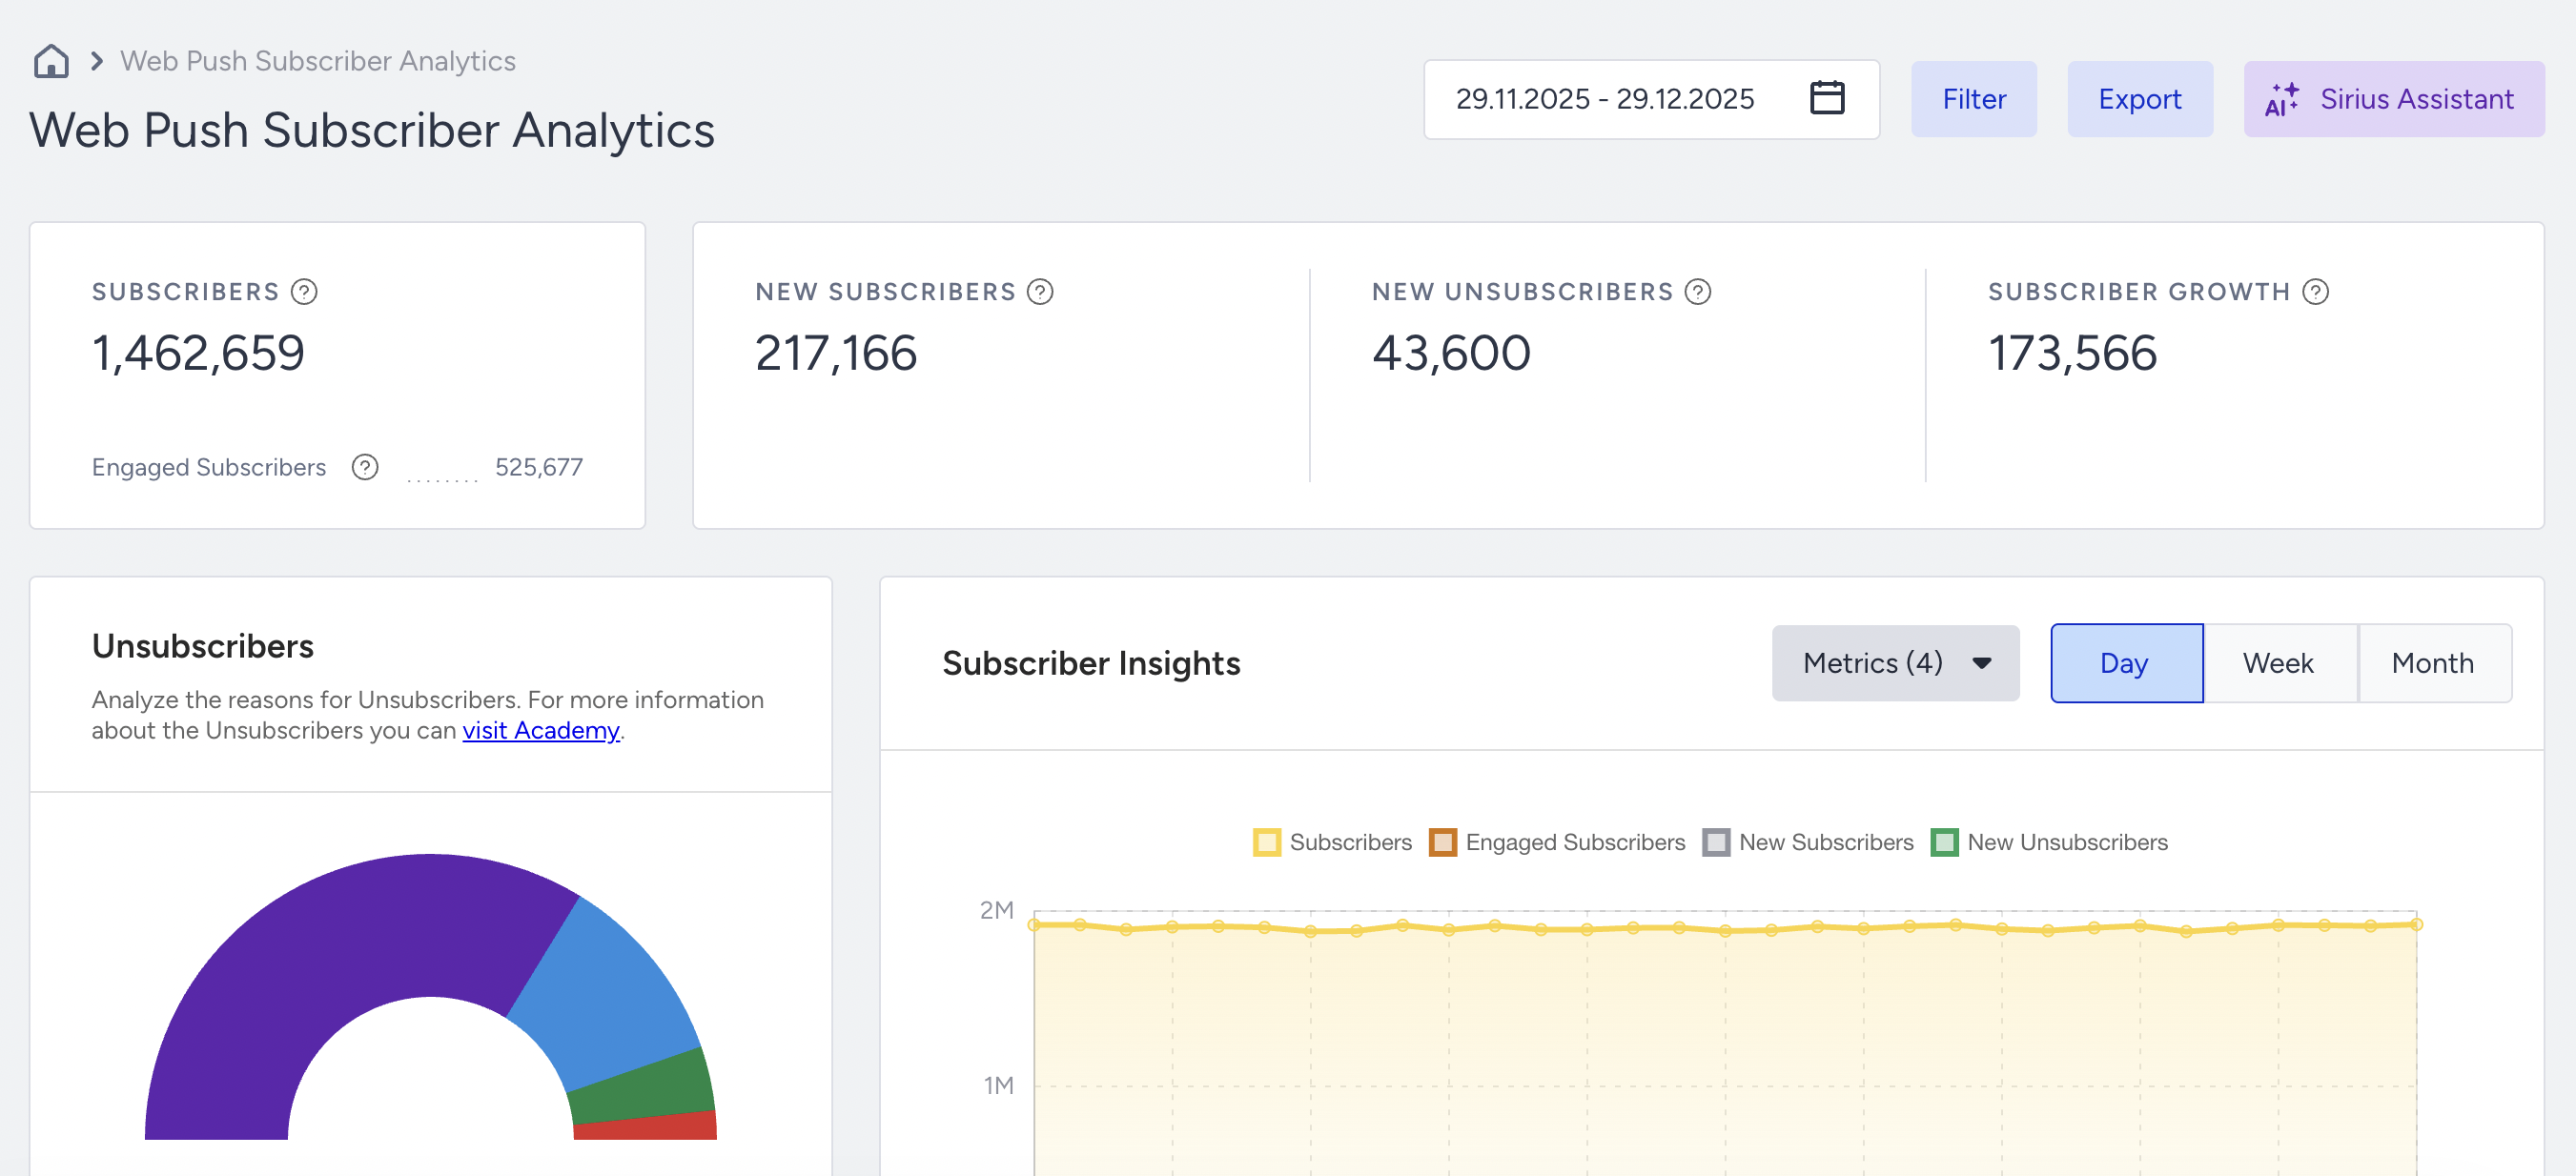
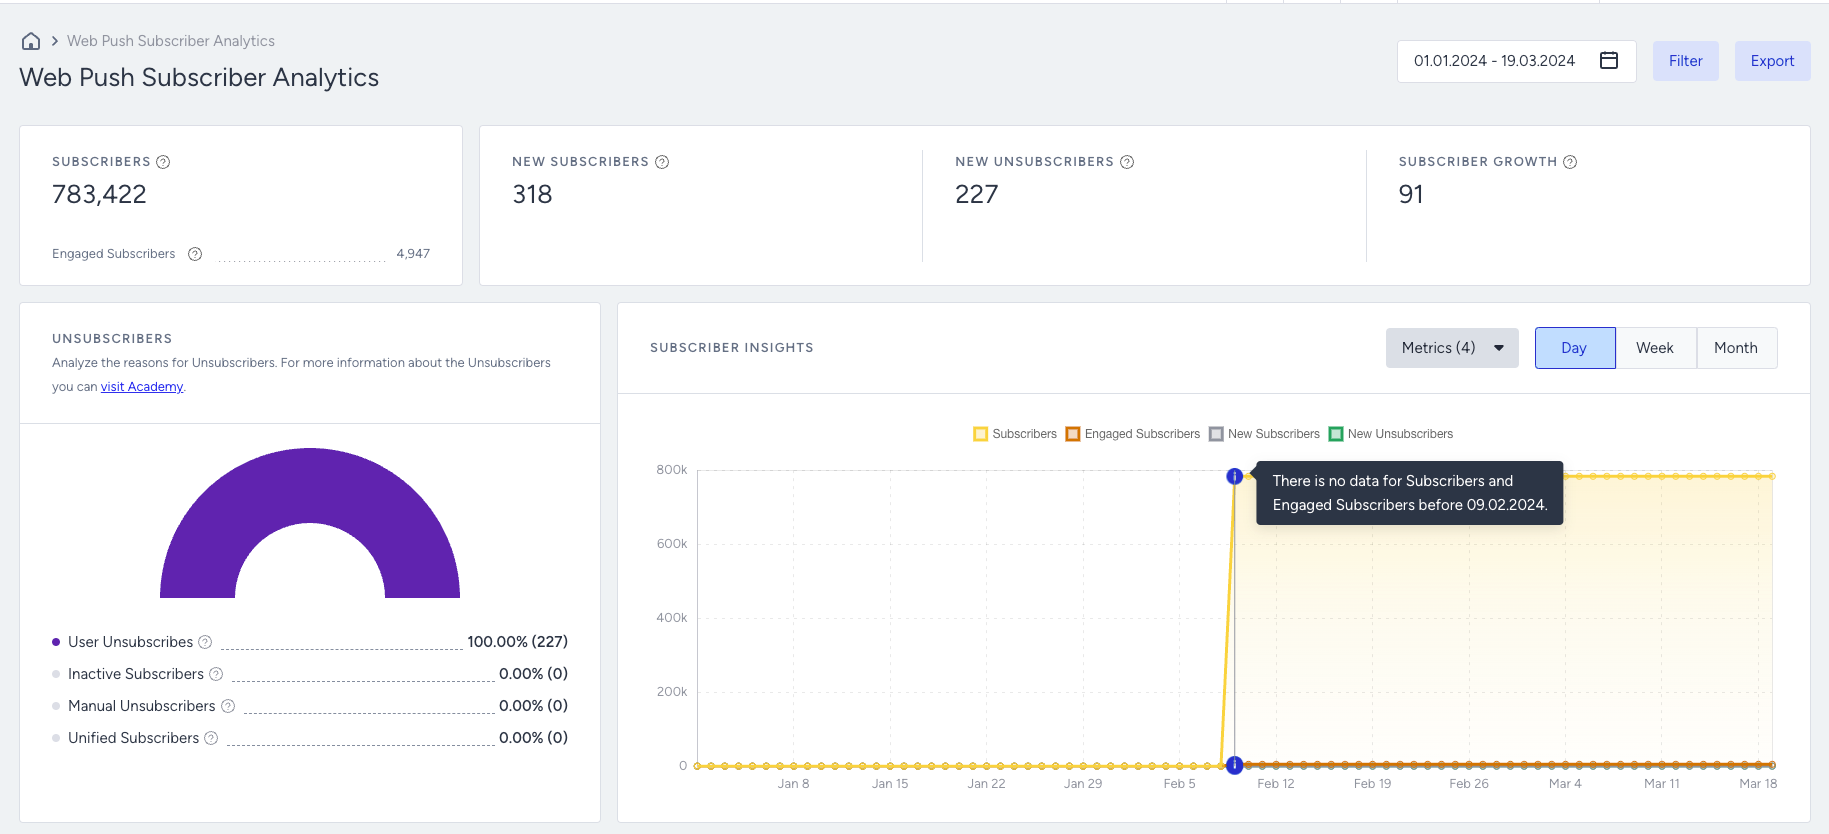
In the selected date range, you can observe the number of subscribers, new subscribers, new unsubscribers, and subscriber growth. You can view it daily, weekly, or monthly.
The Subscriber Analytics page is updated daily. Therefore, the data always reflects the previous day's data. For example, if today is the 27th, the data shown will be up to the 26th.
Applying filters
You can filter the report using the following parameters: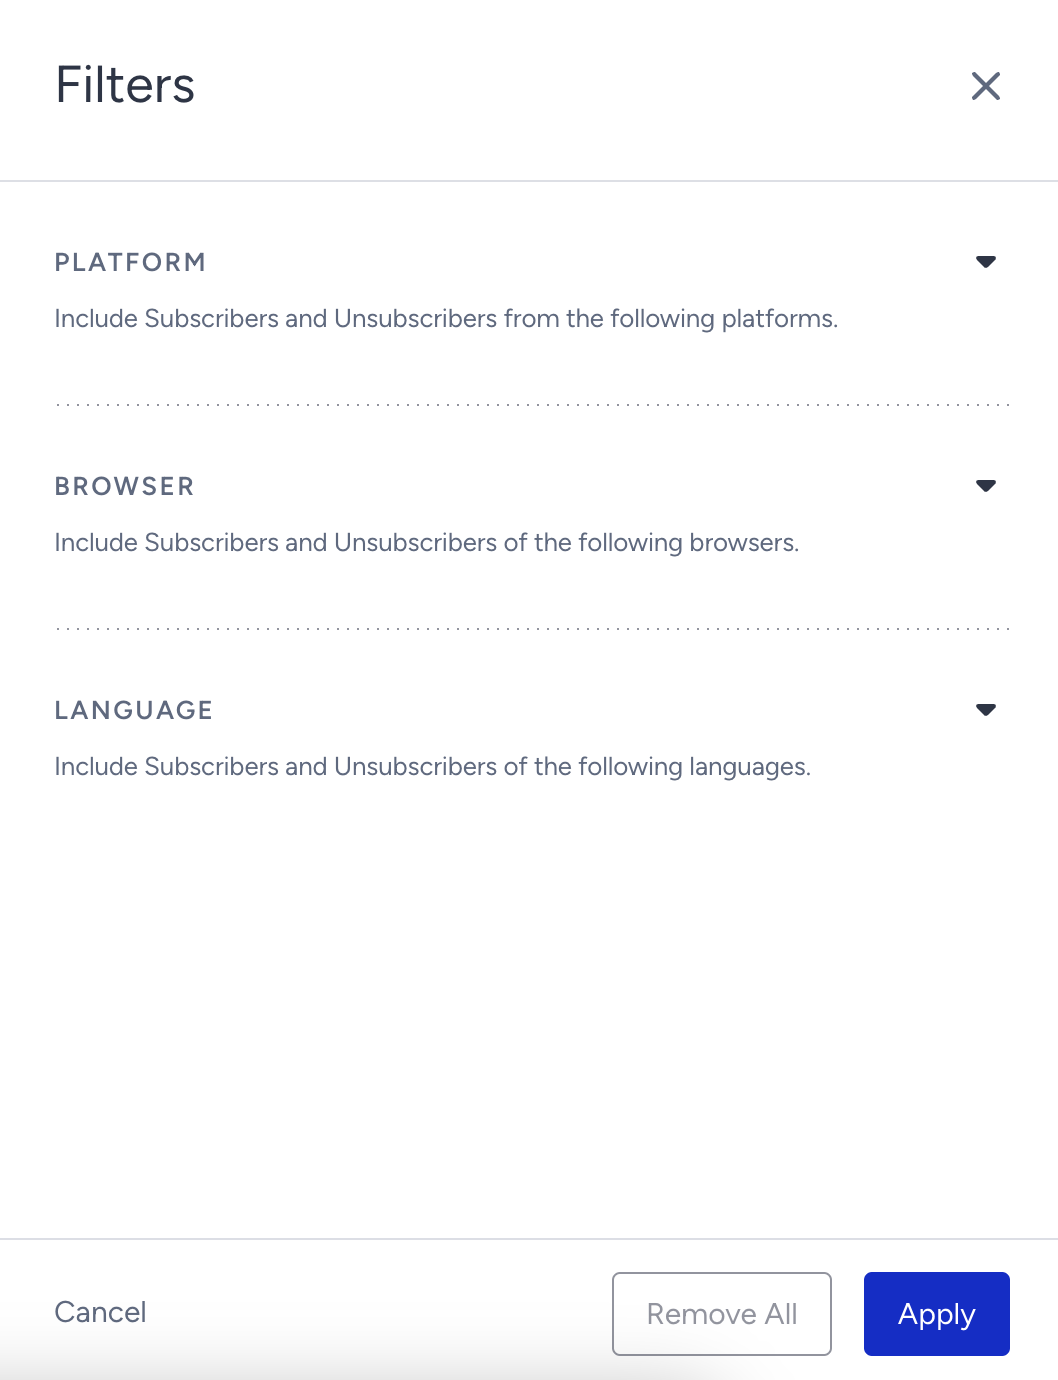
Platform: Select desktop, mobile, or all.
Browser: Select Chrome, Safari, Firefox, Yandex, Opera, Samsung Internet, or Edge.
Language: Select the language in which you collect the opt-in.
You can also use the date picker to filter your results.
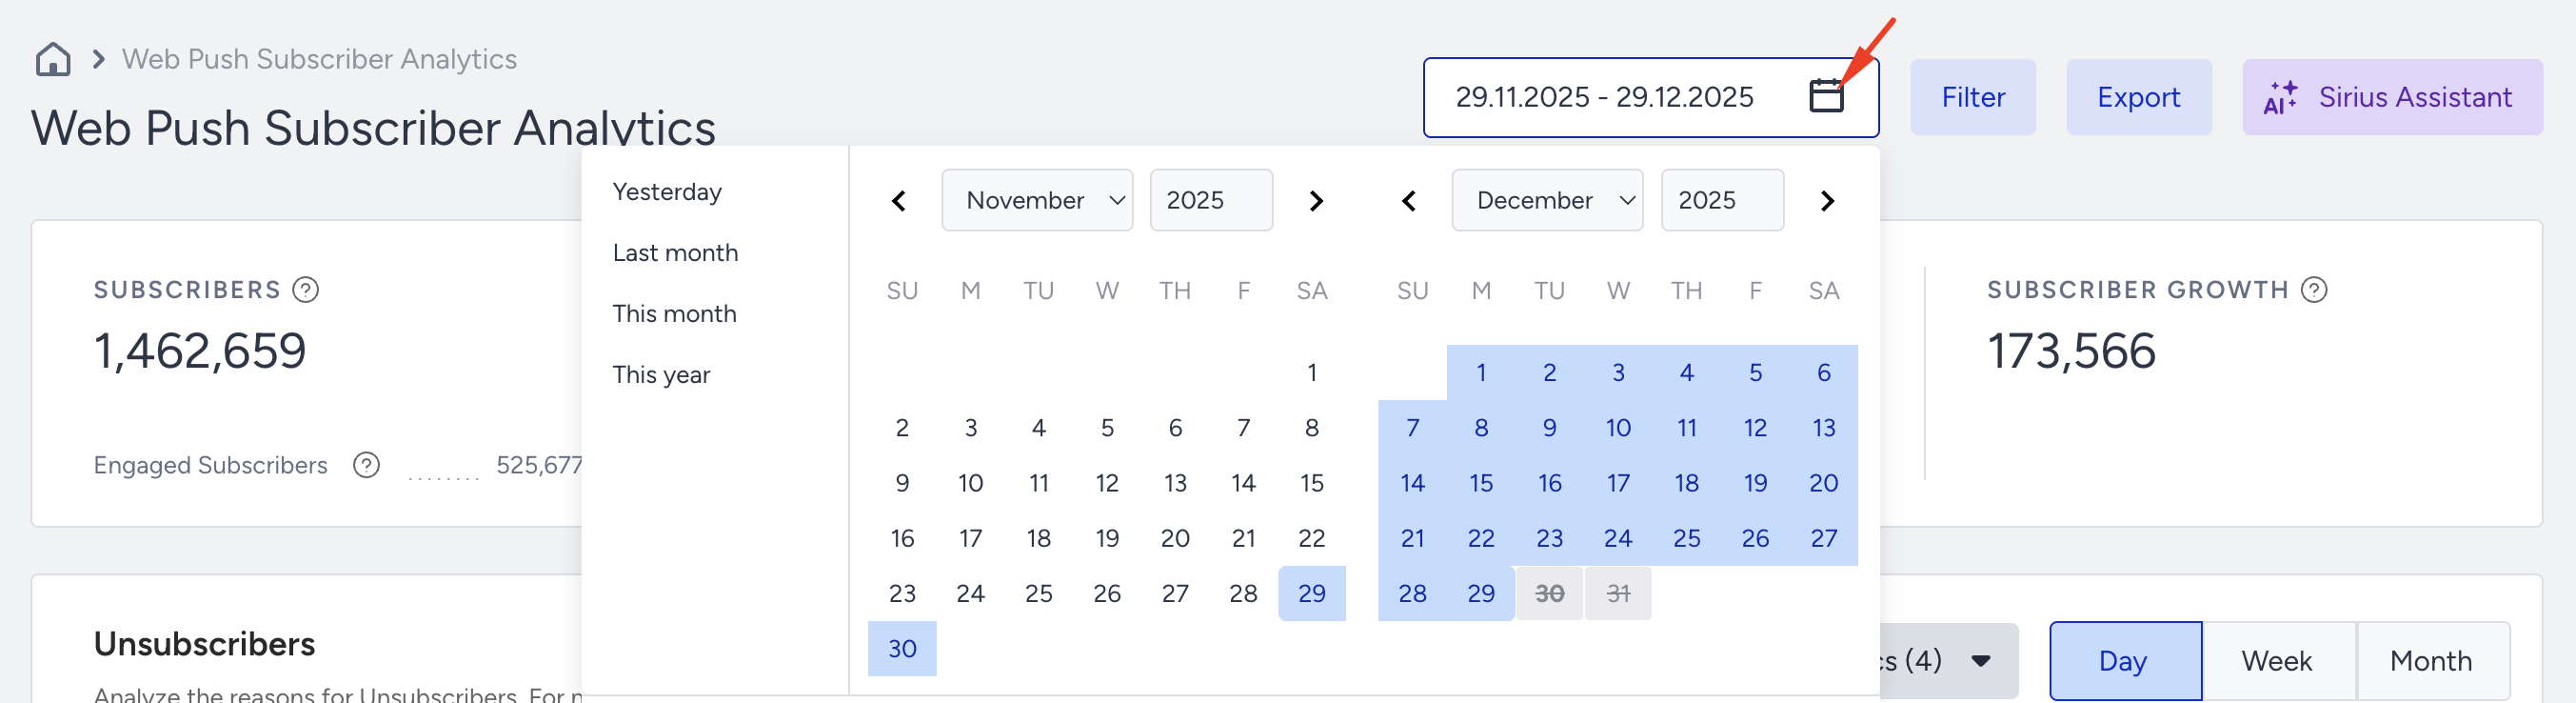
When selecting a date range, it applies to all metrics, but there are a few key nuances to consider. For example, if you select a range between Date1 and Date2:
Subscribers and Engaged Subscribers metrics will display the total counts as of the end of Date2.
All other metrics will reflect changes that occurred within the selected range. For instance, the New Subscribers metric will show how many users opted in between Date1 and Date2.
Here is an example: If you select September 1st to September 15th:
The Subscribers count will show the total as of the end of September 15th.
The Engaged Subscribers count will also reflect the total as of the end of September 15th.
The New Subscribers metric will display the number of users who opted in during this period, which applies to other metrics as well.
Overall Subscriber Analytics
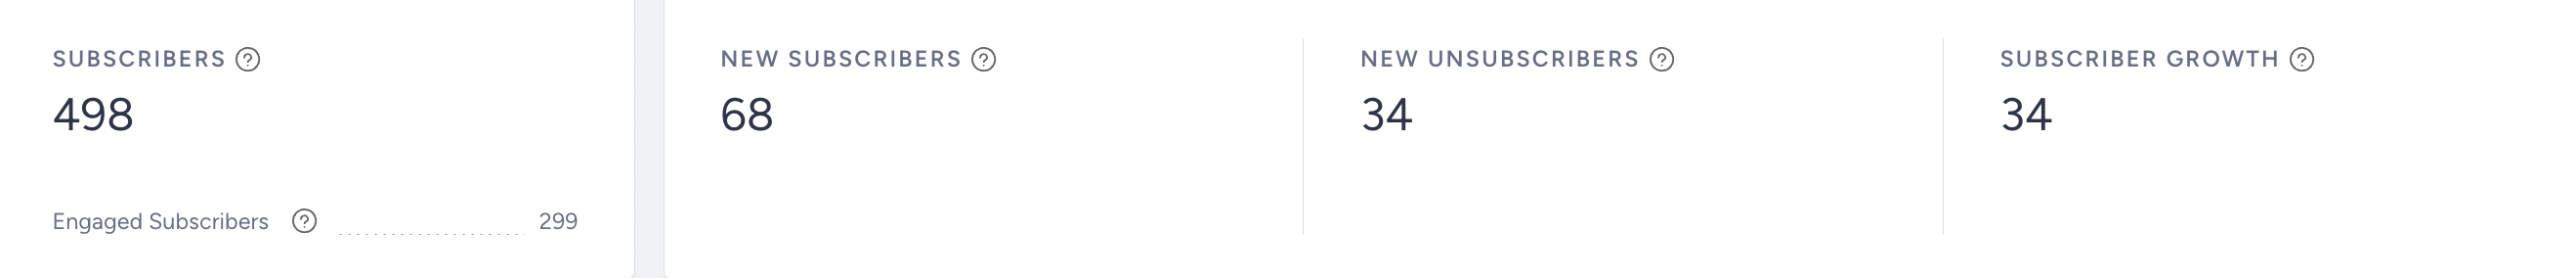
Subscribers: Total number of users who have opted in to Web Push on your website.
Engaged Subscribers: Total number of users who have visited your website or have at least one Web Push click, view, or close action in the last six months.
New Subscribers: Total number of users who have opted in for your Web Push notifications in the selected date range.
New Unsubscribers: Total number of users who have opted out of your Web Push notifications in the selected date range.
Subscriber Growth: Net increase in the total number of users who have opted in for your Web Push notifications in the selected date range.
Subscribers and Engaged Subscribers metrics are available only from February 9, 2024, onward. Due to technical constraints, data prior to this date are unavailable for display. If you select a date range that includes dates before February 9, 2024, these metrics will show as 'N/A'. N/A does not indicate an absence of historical data; it simply means this metric cannot be calculated for date ranges before February 9.
Unsubscribers
Under Unsubscribers, you can analyze the reasons users opted out.
Users are reported as "unsubscribed" only if they are included in a campaign segment. The unsubscribe status is determined based on the response received from the browser or client after the campaign is sent. Once the status is confirmed, the user is flagged as unsubscribed and is reflected on this analytics page accordingly.
Note: After launching bulk web push campaigns, or sending a campaign for the first time, the number of unsubscribers may increase over time as unsubscribe statuses are detected.
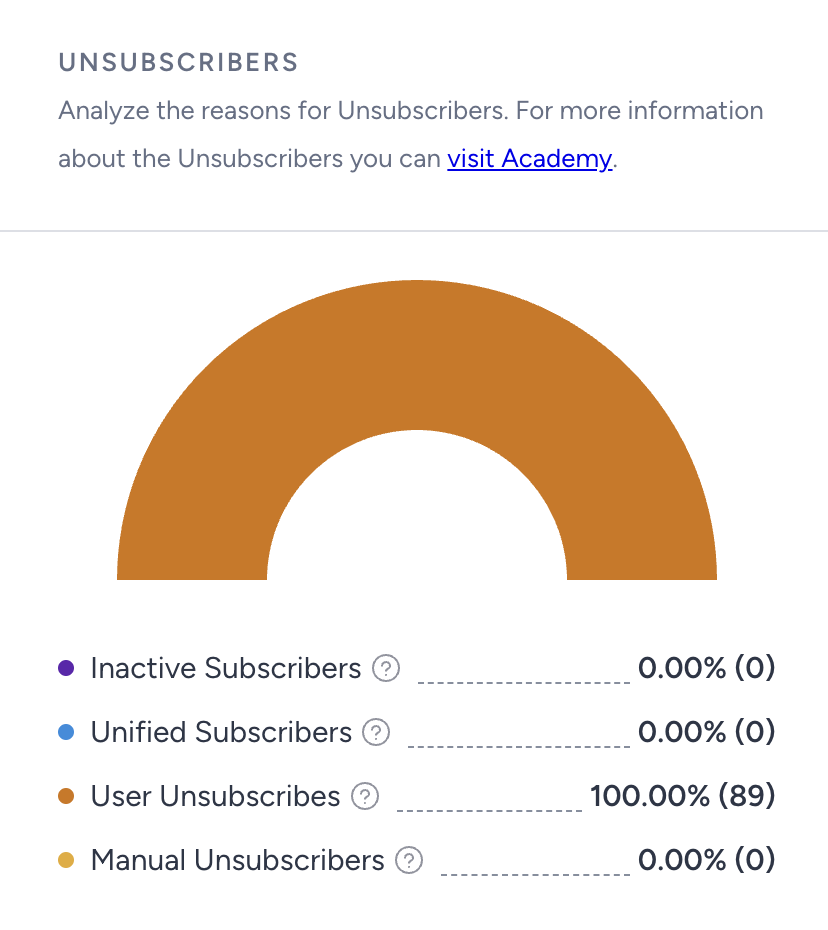
Inactive Subscribers: Percentage and the number of inactive subscribers. According to UCD’s data retention policy, profiles that have not triggered any events for one year and can no longer be activated are marked as inactive. If they are a Web Push user, they are also marked as unsubscribed. In other words, for a user to be listed as inactive, they should not only have no site visits but also no events, such as receiving or clicking on Web Push notifications.
Unified Subscribers: Percentage and the number of your subscribers who were removed due to the same user data being found and merged into a single user ID.
User Unsubscribers: Percentage and the number of your subscribers who opted out manually from your Web Push notifications from the browser at their own request.
Manual Unsubscribers: Percentage and the number of your subscribers who were removed manually and via the Delete User Profile API.
The Data Retention Policy, introduced in October 2023, states that user profiles inactive for 365 days will be archived. On October 27, 2024, these inactive profiles will be marked as unsubscribed, which may increase the number of unsubscribers. If you've been collecting Web Push subscribers for less than a year, you won't see a significant rise in unsubscribers on this date.
Factors affecting subscriber metrics
Subscribers is a daily snapshot of currently opted-in and reachable users. It might not equal New Subscribers minus New Unsubscribers because profile merging, inactive-profile cleanup, manual deletion, and changes to required Web Push reachability data can alter the snapshot independently. Re-activated or newly reachable profiles might also enter the total without representing a first-time subscription.
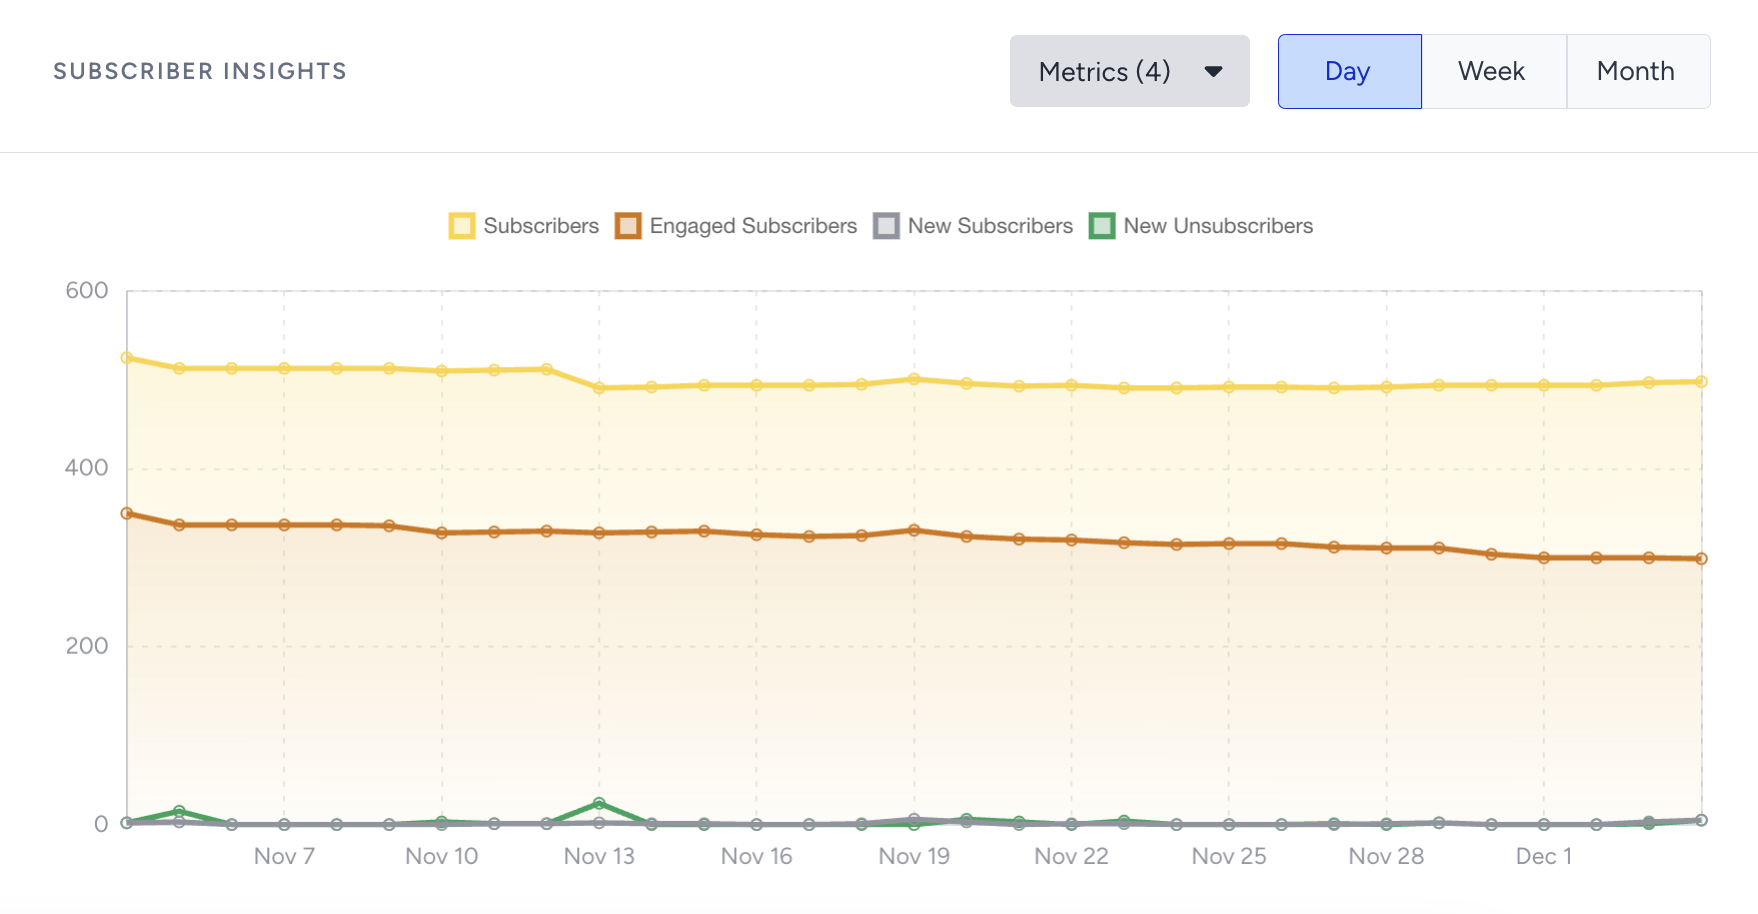
Subscriber Insights
The Subscriber Insights section allows you to track daily, weekly, and monthly trends in Web Push subscriptions on your website.
Subscribers and Engaged Subscribers metrics are available only from February 9, 2024, onward. Due to technical constraints, data before this date is unavailable for display. If you select a date range that includes dates before February 9, these metrics will display a value of '0'.
Opt-in Prompt Insights
This section shows the performance of your opt-in screens. Since you might have different opt-in types enabled at various times, as it is possible to migrate between these two types, you can observe both native and custom opt-in data in this table: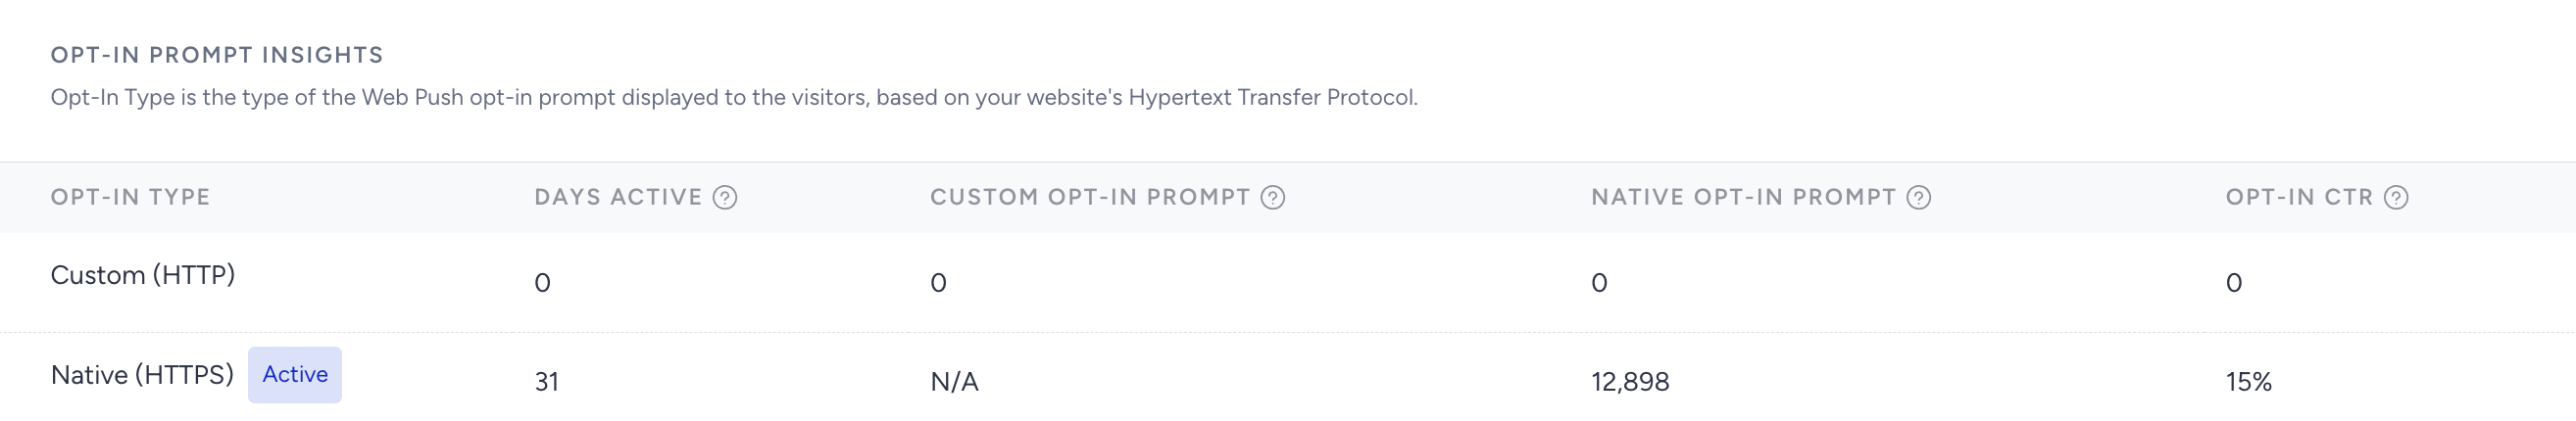
Days Active: Number of days for which the opt-in screen was active in the selected date range
Custom Opt-in Prompt: Number of times the first permission screen for custom opt-in was shown. For native opt-in, this screen is not displayed.
Native Opt-in Prompt: Number of times the browser's opt-in prompt was displayed. This prompt appears as the first and only screen for native opt-in and as the second pop-up screen for the custom opt-in.
Opt-in CTR: Percentage of users who have subscribed to Web Push notifications out of the total number of users who view the opt-in screens.