Email analytics is a report dashboard that provides analytics for all your email campaigns’ performance. You can reach this dashboard through Messaging > Email > Analytics.
The email campaigns sent through Architect journeys are not included in Email Analytics. You can get insights about your journey emails via Architect Email Channel Analytics.
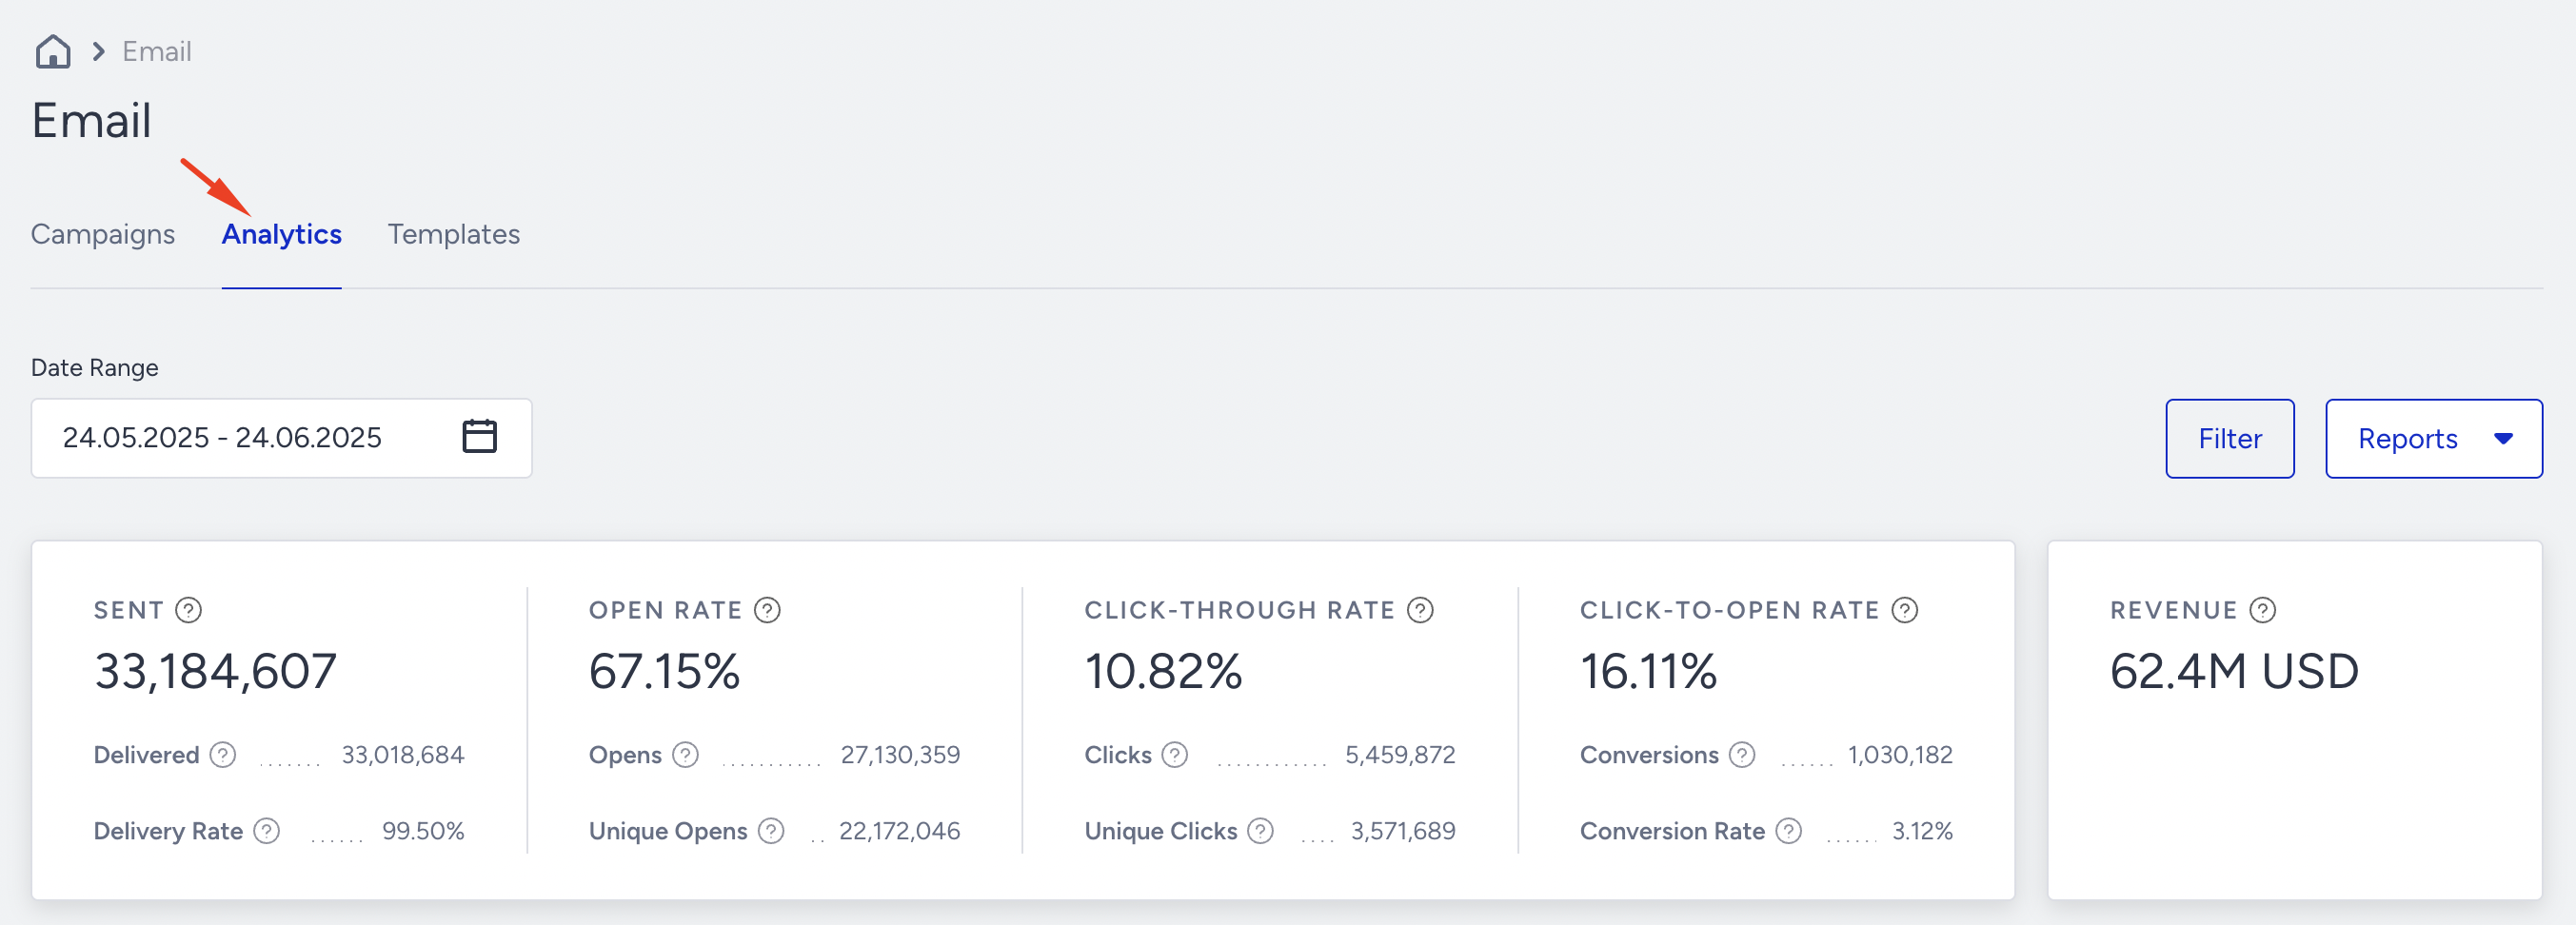
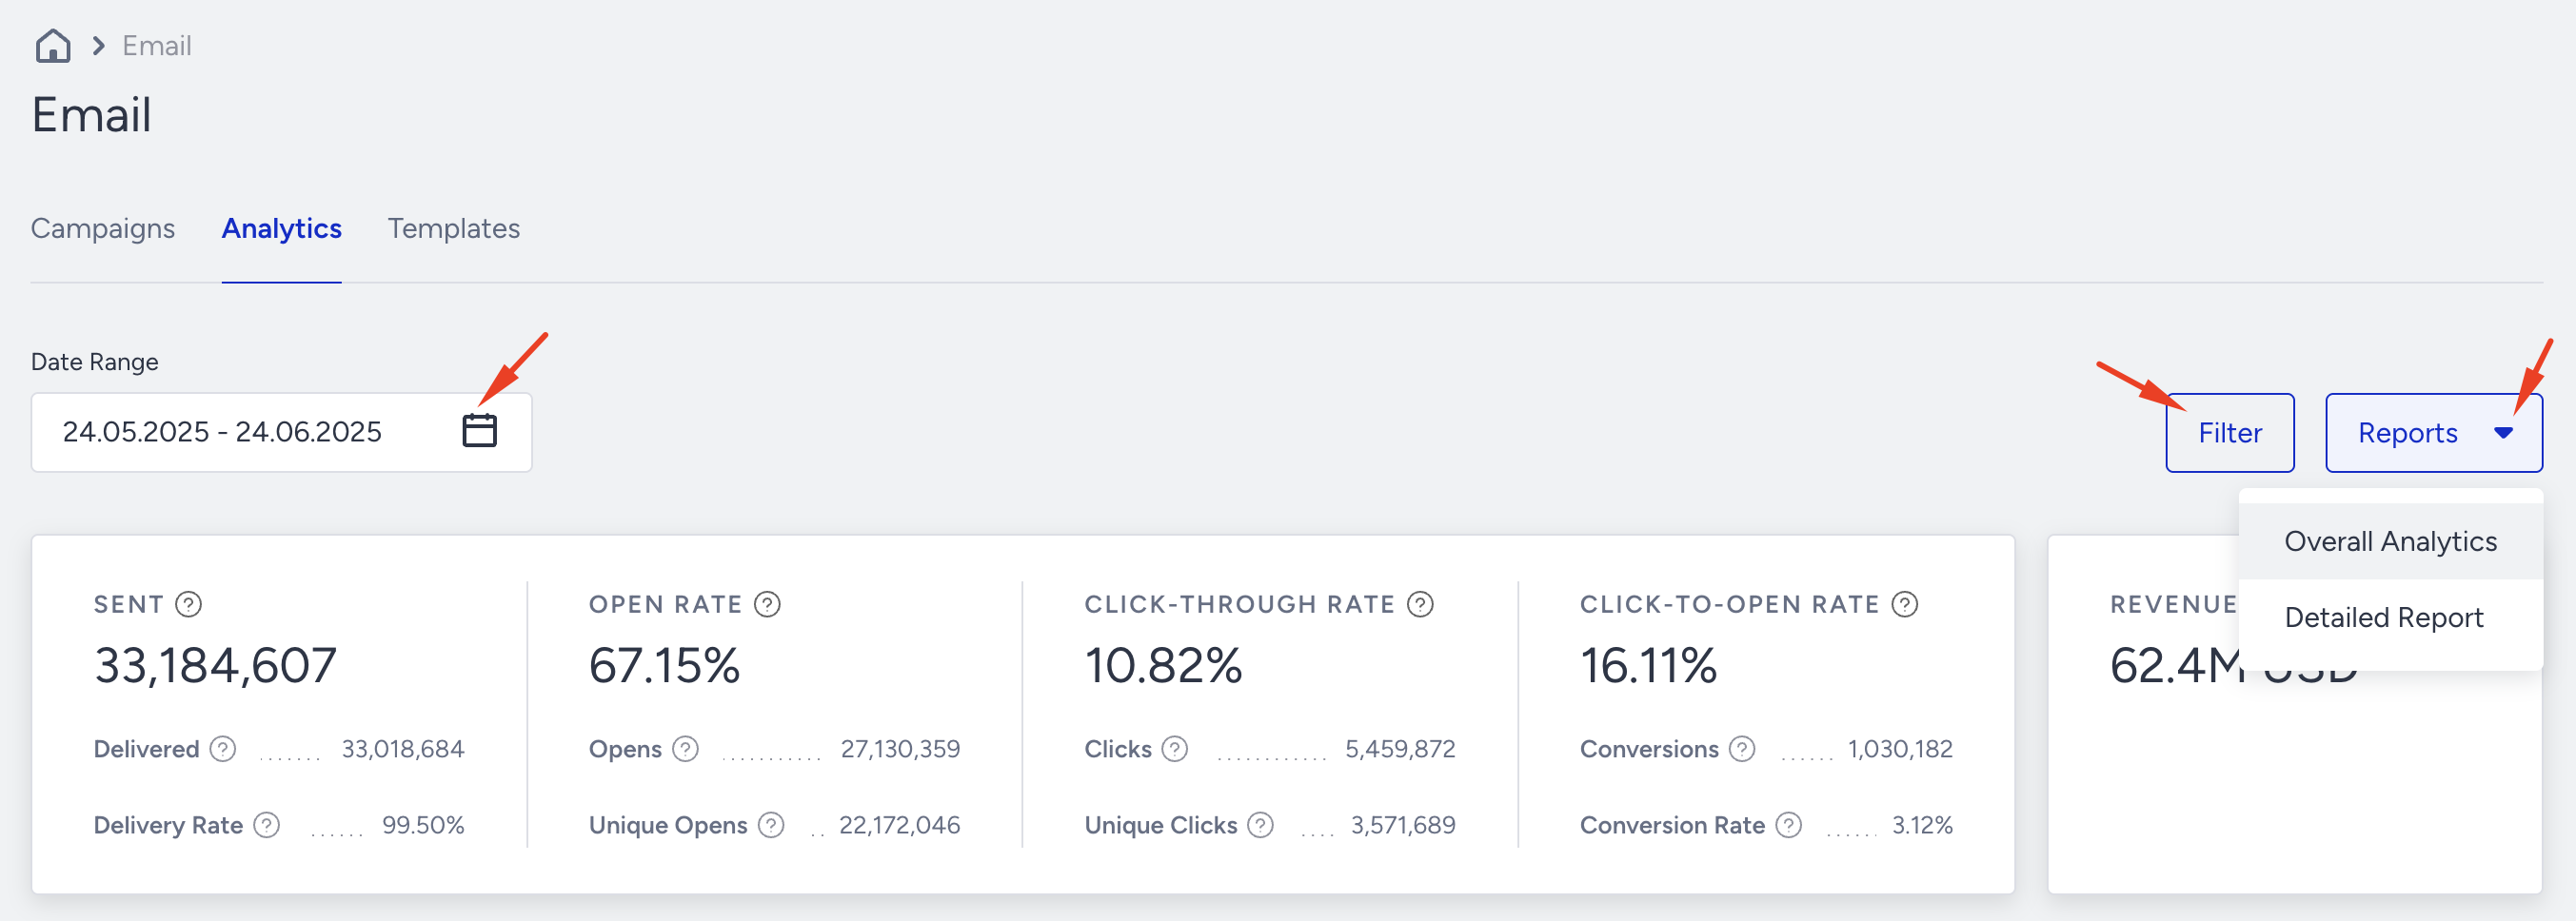
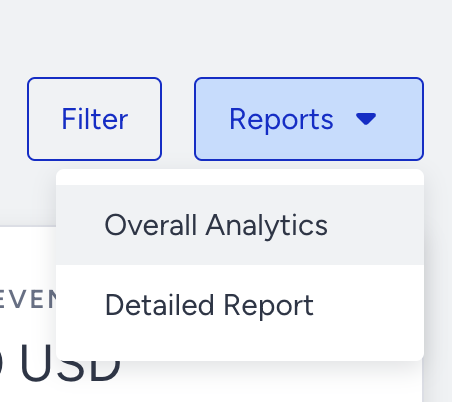
In the top section, you can see three actions:
The video below introduces the email analytics.
If this video does not load in your region, you can watch it on our YouTube Channel.
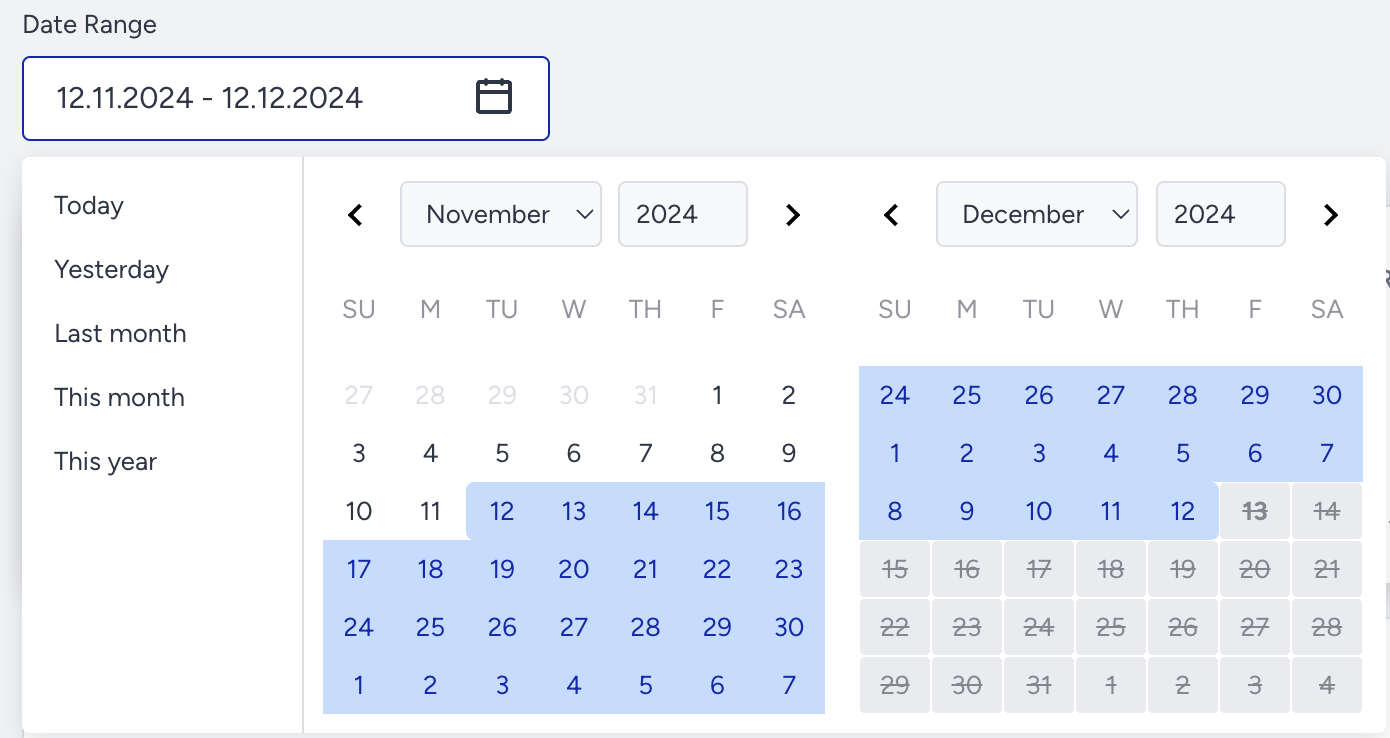
Date Range
You can select the time range for which you want to see analytics of your email campaigns.
Filters
You can group your analytics by specific categories and show the selected categories on the page.
1. Click the Filters button to see the filtering options.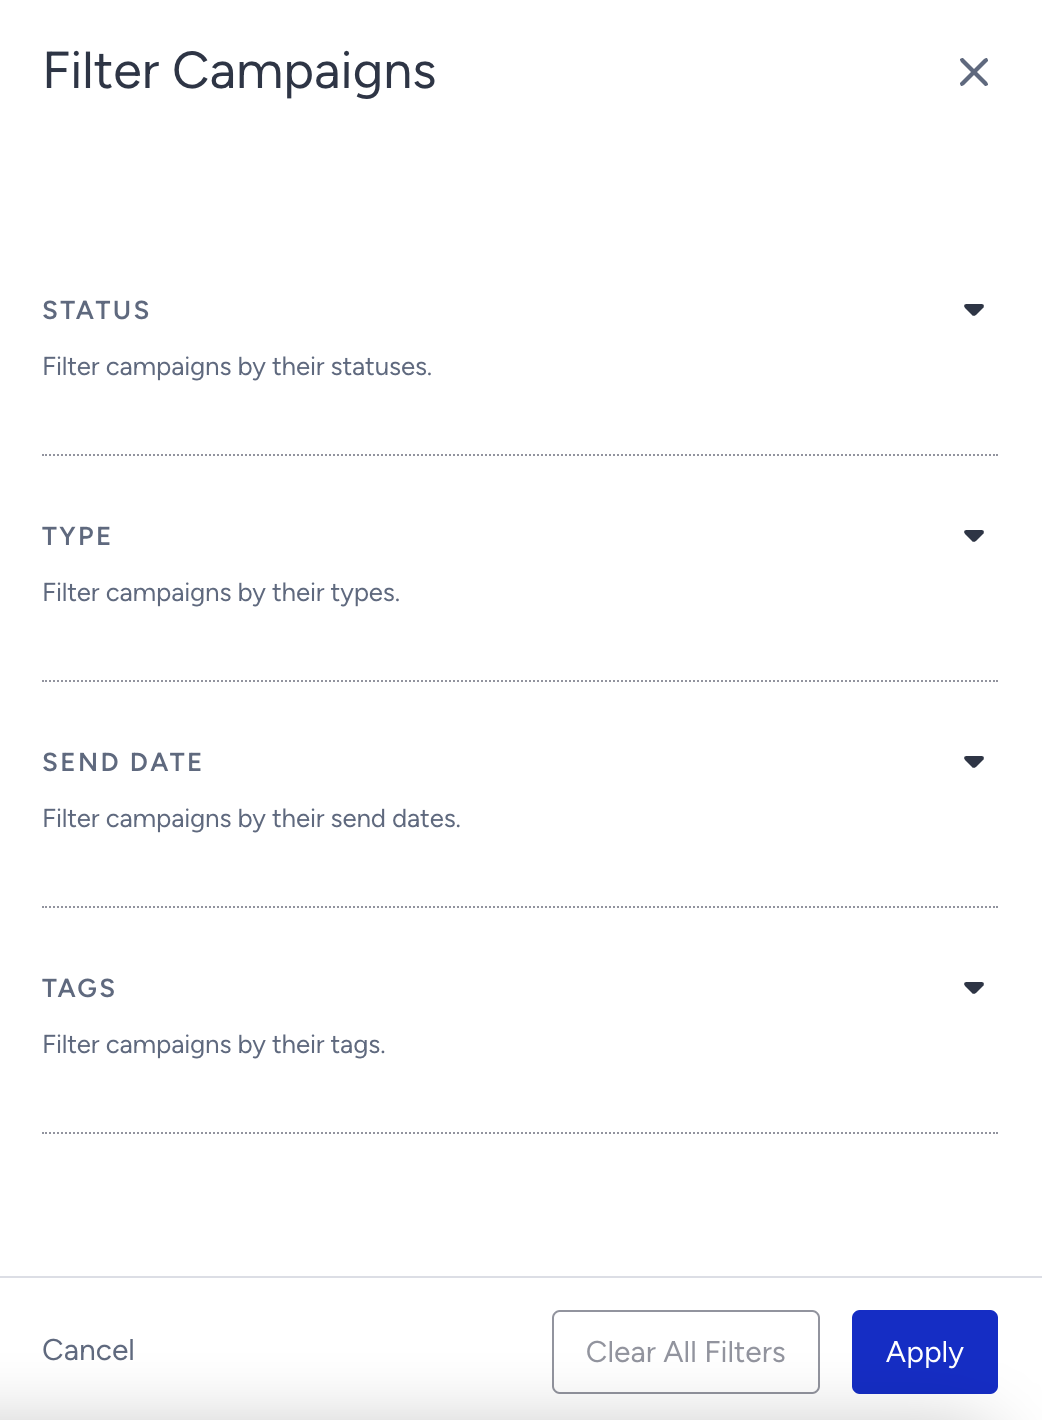
2. Select from the following filtering options to filter your analytics:
Status: Filters by the campaign statuses (completed, scheduled, draft, running, awaiting next run, and paused).
Type: Filters by the campaign type (single, experiment, and recurring).
Send Date: Filters by campaign send dates. If you select a send date, only sent campaigns are displayed and reported on the overall analytics page.
Tags: Filters by the tags that you create for your campaigns.
3. Click the Apply button to see the results.
Reports
You can export your overall and detailed reports.
Metrics
By selecting your time range, you can see the dashboard update to display analytics for the emails you sent in that range. You can see the following metrics for your email campaigns:
Sent: Total number of sent emails
Delivered: Total number of emails delivered to the subscribers
Delivery Rate: Ratio calculated by (Delivered # / Sent #)*100
Open Rate: The ratio of the opened emails. This ratio is calculated by dividing the unique opens by the total number of delivered emails.
Opens: Total number of times your users open your emails. This number demonstrates the number of opens regardless of unique users. Meaning that if the same user opens the sent email 5 times, this number will increase by 5.
Unique Opens: The number of unique individuals who have opened your emails. This number demonstrates the number of opens regarding the uniqueness of users. For example, if the same user opens the sent email five times, this number will increase by one and not decrease.
With the release of iOS 15, macOS Monterey, iPadOS 15, and watchOS 8, Apple Mail Privacy Protection (MPP) changed how Insider One receives open-rate data for your emails by prefetching Insider's tracking pixel. With this change, open rates may appear inflated.
Click-through Rate: The ratio of unique clicks on a link. This ratio is calculated by dividing the unique clicks on links by the total number of delivered emails.
Clicks: Total number of times your users have clicked on the various links within your emails. This number demonstrates the number of clicks regardless of unique users. Meaning that if the same user clicks on the same item 5 times, this number will increase by 5.
Unique Clicks: This number represents the number of unique individuals who have clicked the links in your emails. If the same user clicks the same link five times, this number will increase by 1, not 5.
CTOR (click-to-open rate): CTOR measures the effectiveness of your email content. This ratio is calculated by dividing unique clicks by the number of unique opens.
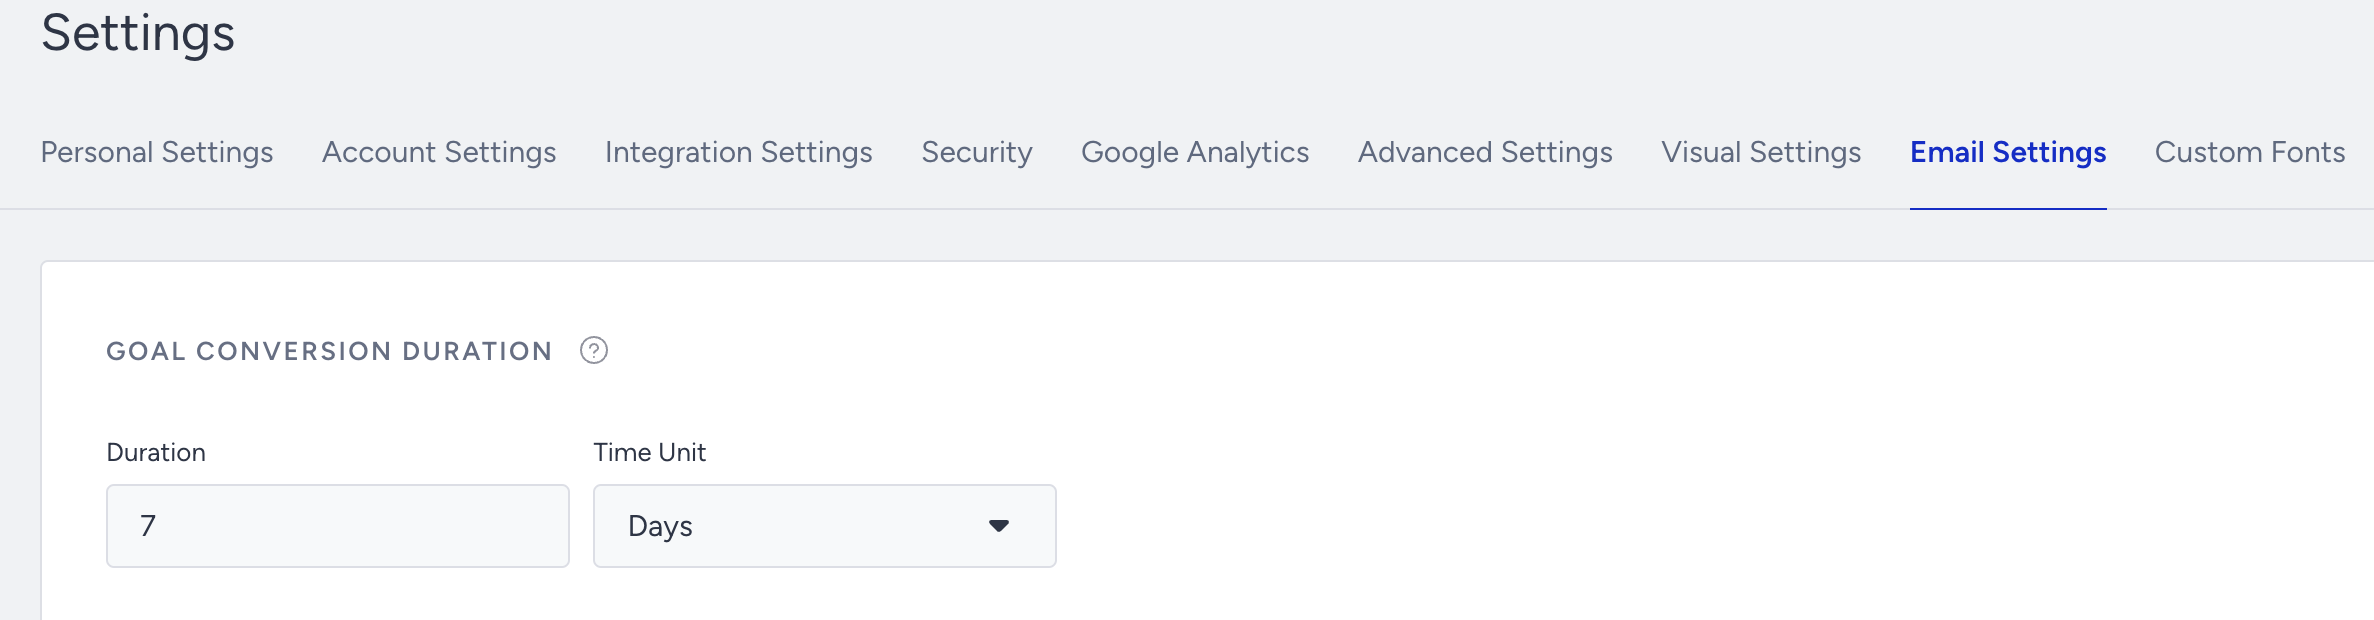
Conversions: Total number of sales conversions that are completed after clicking on the email. The conversion rate is tracked after the period that you set in the goal conversion duration calculation, which is 7 days by default, and you can change it via InOne Settings > Email Settings. This number demonstrates the total conversions and not just the conversion of the item clicked.
Conversion Rate: The ratio of total conversions achieved in the campaign. This ratio is calculated by dividing the total number of conversions by the total number of delivered emails.
Revenue: Calculated with the last click attribution mode. It considers the last email activity based on the user's last click before completing the purchase. Goal conversion duration is 7 days by default for every email campaign. However, based on the business use case, you can change both the default duration and specific campaign duration as well. The total value of the purchases made via your Email messages is calculated by the sum of Recommendation Revenue + Mobile App Revenue + Web Revenue.
Recommendation Revenue: The total value of purchases made via the Recommendation block in your Email messages.
Mobile App Revenue: The total value of purchases made via the mobile app. You need to integrate Insider One's Mobile SDK into your app to keep track of this revenue.
If a user clicks a link in an email and is redirected to the app, the conversion(s) can be tracked. If a user clicks a link in an email, goes to the web/mobile, and opens the app to purchase within the attribution window, the conversion(s) can be tracked.
Usage of the revenue metric
Make sure that the goal conversion duration (7 days) is configured correctly for your account. You can change the duration via Settings > Inone Settings > Email Settings.
If you want to proceed with a specific goal conversion duration, you can set the campaign-specific duration on the launch step of your email campaign.
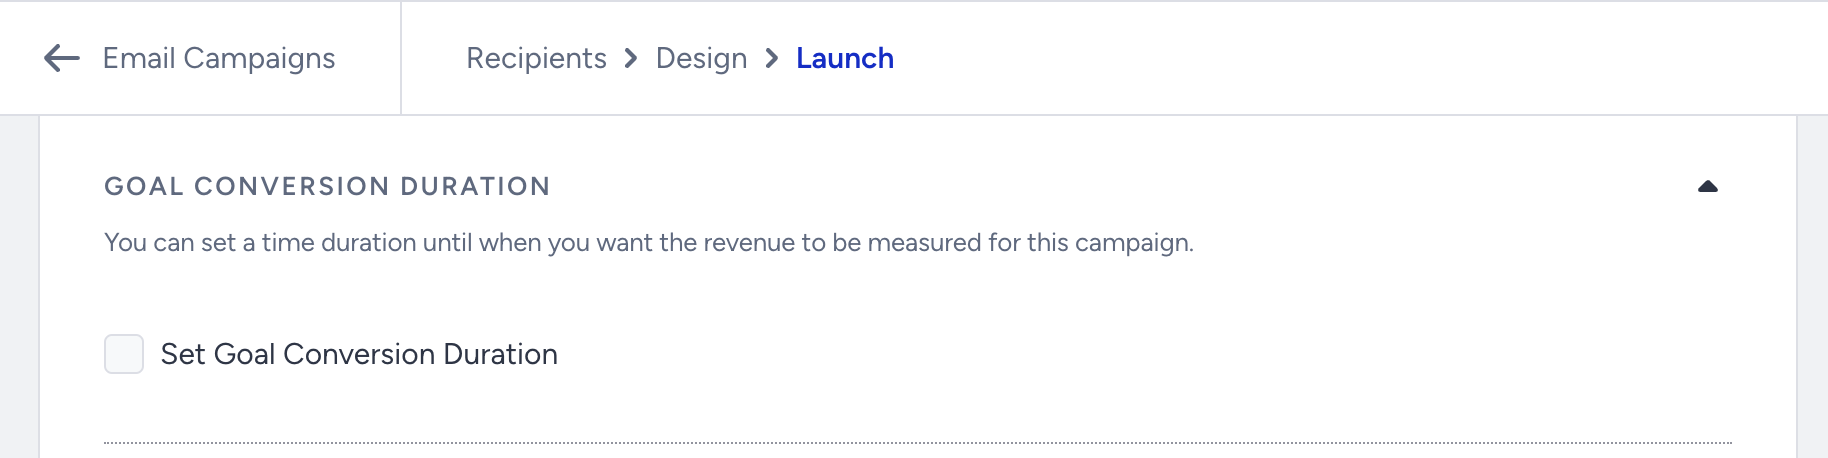
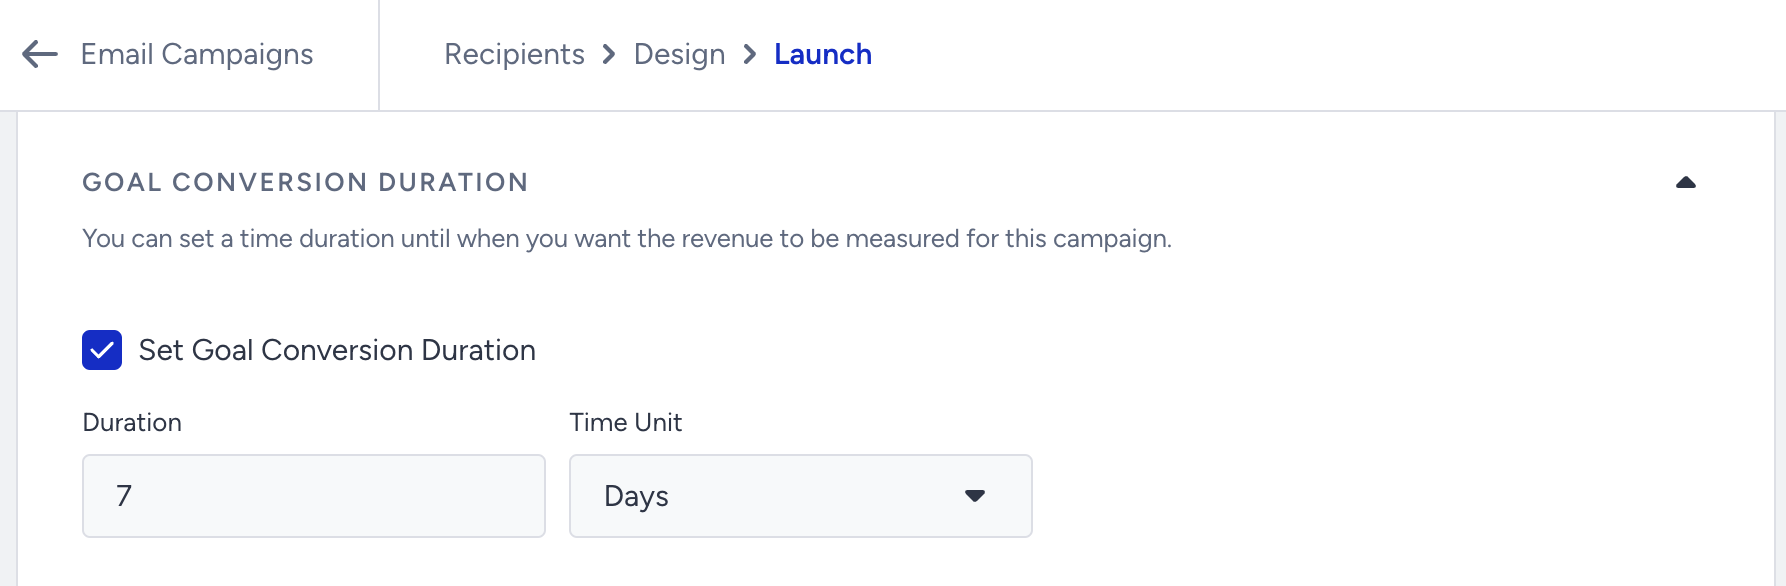
Check the Set Goal Conversion Duration box. You can revise the duration you want to track for this specific email campaign.
Performance by Campaign Metrics
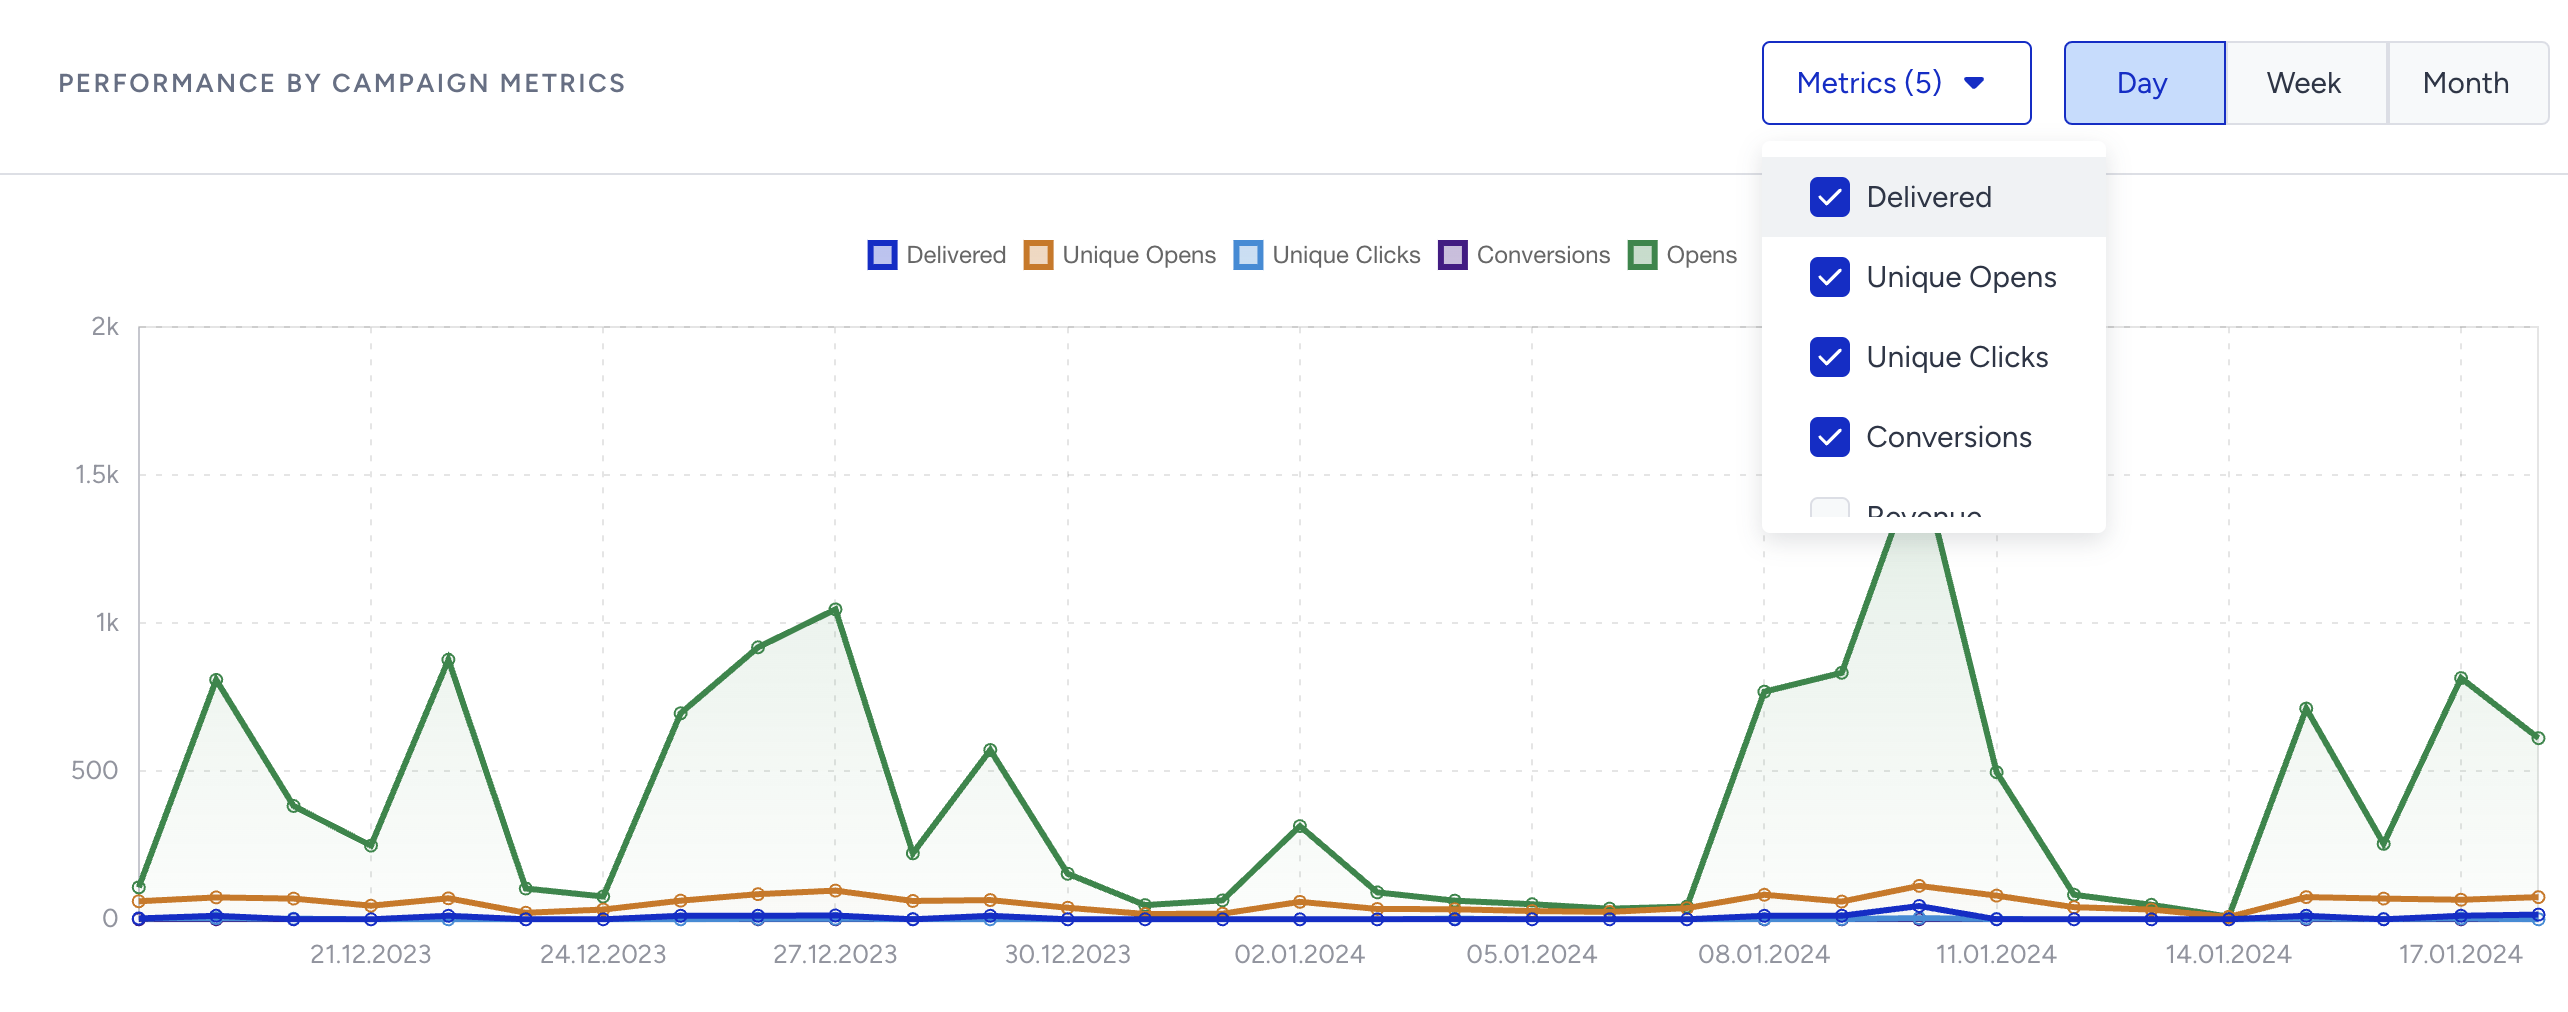
The line chart displays the metrics that you select daily, weekly, or monthly. You can select delivered, unique opens, unique clicks, conversions, revenue, opens, clicks, sent, bounces, spam reports, blocks, unsubscribes, and invalid emails.
.png)
Below the chart, you can see the following email-related details of your campaigns. These numbers are based on the time range that you select.
Unsubscribers: The number of people who have globally unsubscribed from this email. These email addresses are automatically captured under the global unsubscribe. We will auto-drop any future requests to this email address as long as they stay unsubscribed.
The Unsubscribers metric also includes the users who opt out from the list unsubscribes.
Bounce Rate: A bounced email is an email message that has been returned to the sender because the recipient's address is invalid. A bounce might occur because the domain name doesn't exist or because the recipient is unknown. If an email is on the bounce list, we will auto-drop any future requests to this email address. Bounce rate is calculated as “ Bounces / Total Sent“.
Spam Reports: The number of users who have marked the email as spam.
Blocks: A blocked email is an email message that gets as far as the recipient's mail server but is bounced back undelivered before it gets to the intended recipient. Blocks can also happen when your message was rejected for a reason related to the message, not the recipient's address. This can happen when your mail server IP address has been added to a blacklist, blocked by an ISP, or if the message content is flagged by a filter on the receiving server. Blocks might also occur because the recipient's inbox is full. Blocks are soft bounces. If they are not reachable for a while, they become bounces.
Open Rate Breakdown
The open rate breakdown chart visualizes the effect of machine (MPP) and real users on the open rate. The column chart displays unique users and MPP opens. You can hover over the columns to see the rate and count.
MPP (Mail Privacy Protection)
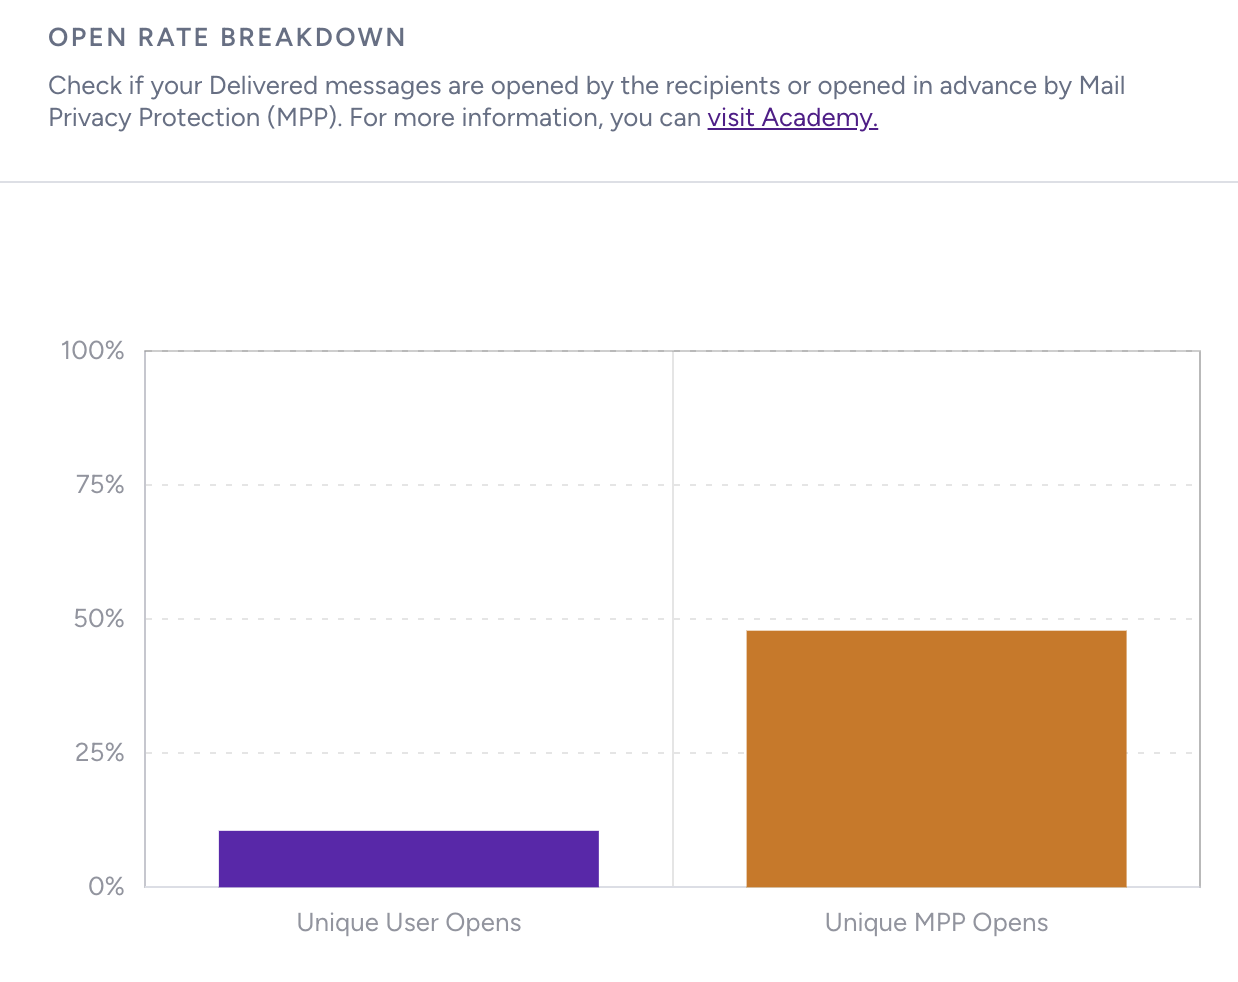 Machine Opens is a term introduced and explained as the number of “opens” that are affected by Apple’s Mail Privacy Protection (MPP) as of iOS 15.
This setting can be enabled starting with Apple IOS 15, iPadOS 15, watchOS 8, and macOS 12 Monterey. If this setting is activated to protect the user's privacy, Apple will generate machine opens on behalf of that user once the email is received in the inbox. Once the machine open is generated, it does not mean that the user opened the email or not.
Subscriber Insights
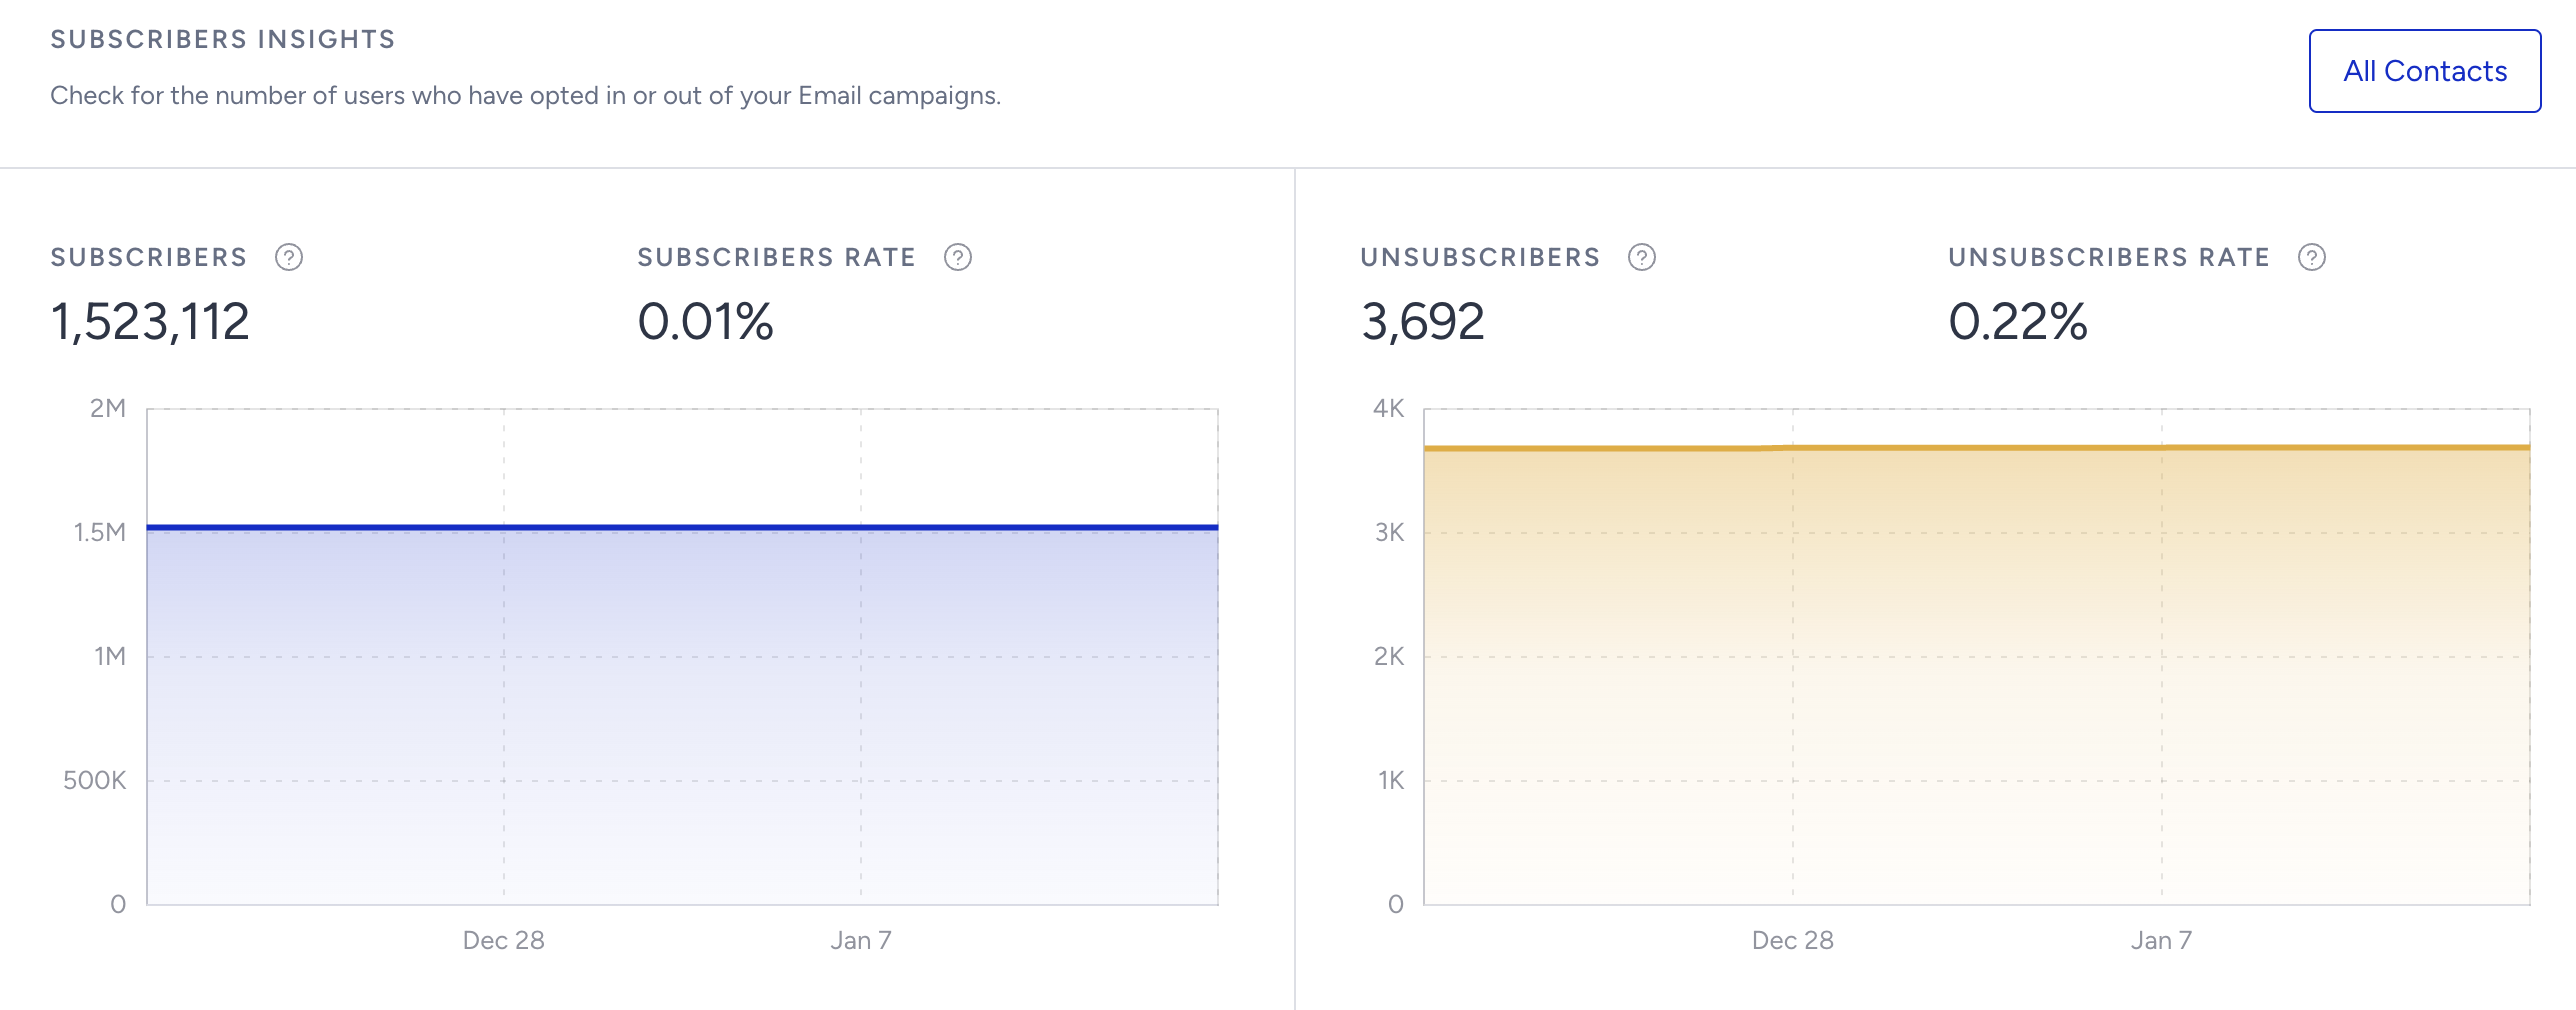
The graph below helps you see the changes in your subscribers based on the following metrics:
Subscribers: The number of subscribers you have at the end of the date range chosen.
Subscribers Rate: The percentage of increase or decrease in your subscribers in the specified period of time.
Unsubscribers: The number of unsubscribes you have at the end of the date range chosen.
Unsubscribers Rate: The percentage of increase or decrease in your subscribers in the specified period of time.
The Unsubscribers metric also includes users who opt out of the list.
Dropped Analytics
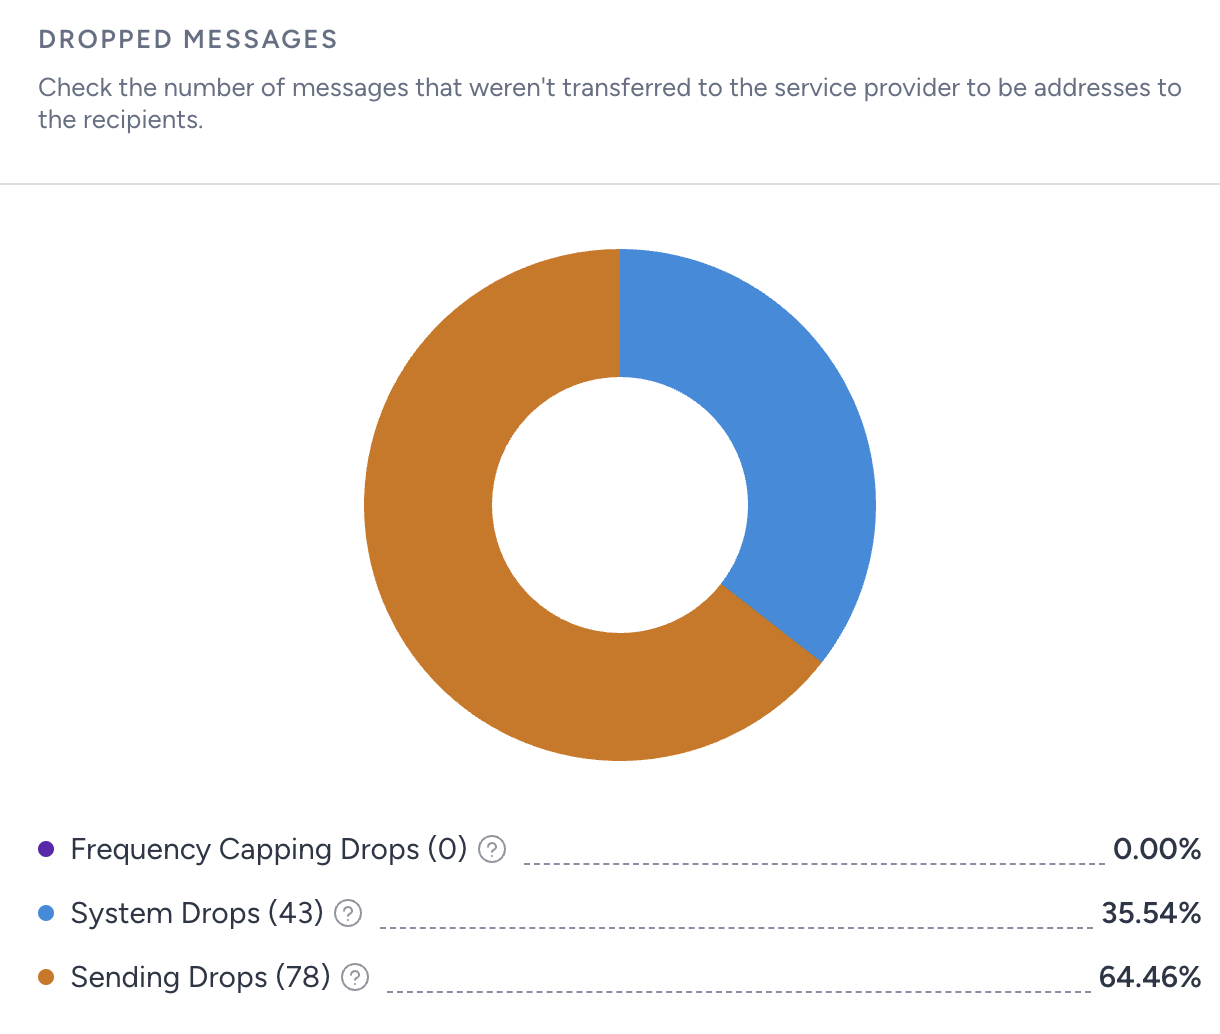
Dropped Messages shows the emails that were not sent, broken down by drop reason. Each reason shows its share of all dropped emails and the number of dropped emails, e.g., Duplicates 12.50% (1,250). Reasons with drops are listed from largest to smallest. Hover over a reason to see its definition.
Content Failure: Emails are dropped because of an error in the message content.
Invalid Dynamic Sender Address: Emails are dropped because a sender name built with dynamic content contains invalid characters.
Localization: Emails are dropped because no language version of the campaign matches the recipient's locale.
Product Recommendations: Emails are dropped because no recommended products were found for the recipient.
Coupon Lists: Emails are dropped because the selected coupon list had no coupons left.
Duplicates: Emails are dropped because the same recipient appeared more than once in the audience.
Default Frequency Capped: Emails are dropped because the recipient already received an email in the last 15 minutes. See Default Email Frequency Capping.
Channel Frequency Capped: Emails are dropped because of your Channel Frequency Capping settings. See Email Channel Frequency Capping.
Sending Drops: Emails are dropped because the recipient's address bounced, was blocked, reported an email as spam, unsubscribed, or is invalid. Sending Drops now covers only these address-level reasons. Emails that the email service provider could not deliver because of an error on its side are shown under Service Provider Errors.
Service Provider Errors: Emails are dropped because the email service provider returned an error, or because the email could not be sent after several attempts.
Content Failure, Invalid Dynamic Sender Address, Duplicates, Default Frequency Capped, Channel Frequency Capped, Sending Drops, and Service Provider Errors are always listed. A reason with no drops is shown in grey as 0.00% (0). Product Recommendations, Coupon Lists, and Localization are listed only when they have drops in the selected date range.
If emails were sent but none were dropped, the chart shows a grey ring with the seven reasons above at 0.00% (0).
If the selected date range only has data from before drop reasons were tracked, the section shows: "Drop reasons aren't available for the selected Date Range. Select a more recent Date Range to see why your messages were dropped."
Campaign Metrics
This section displays the campaigns based on the selected date picker and filters. You can select the Campaign ID, Status, Type, Sent, Delivered, Delivery Rate, Open Rate, Opens, Unique Opens, Click-Through Rate, Clicks, Unique Clicks, Click-to-Open Rate, Conversions, Conversion Rate, Revenue, Bounce Rate, Bounces, Blocks, Spam Reports, and Unsubscribes metrics to filter your campaigns.
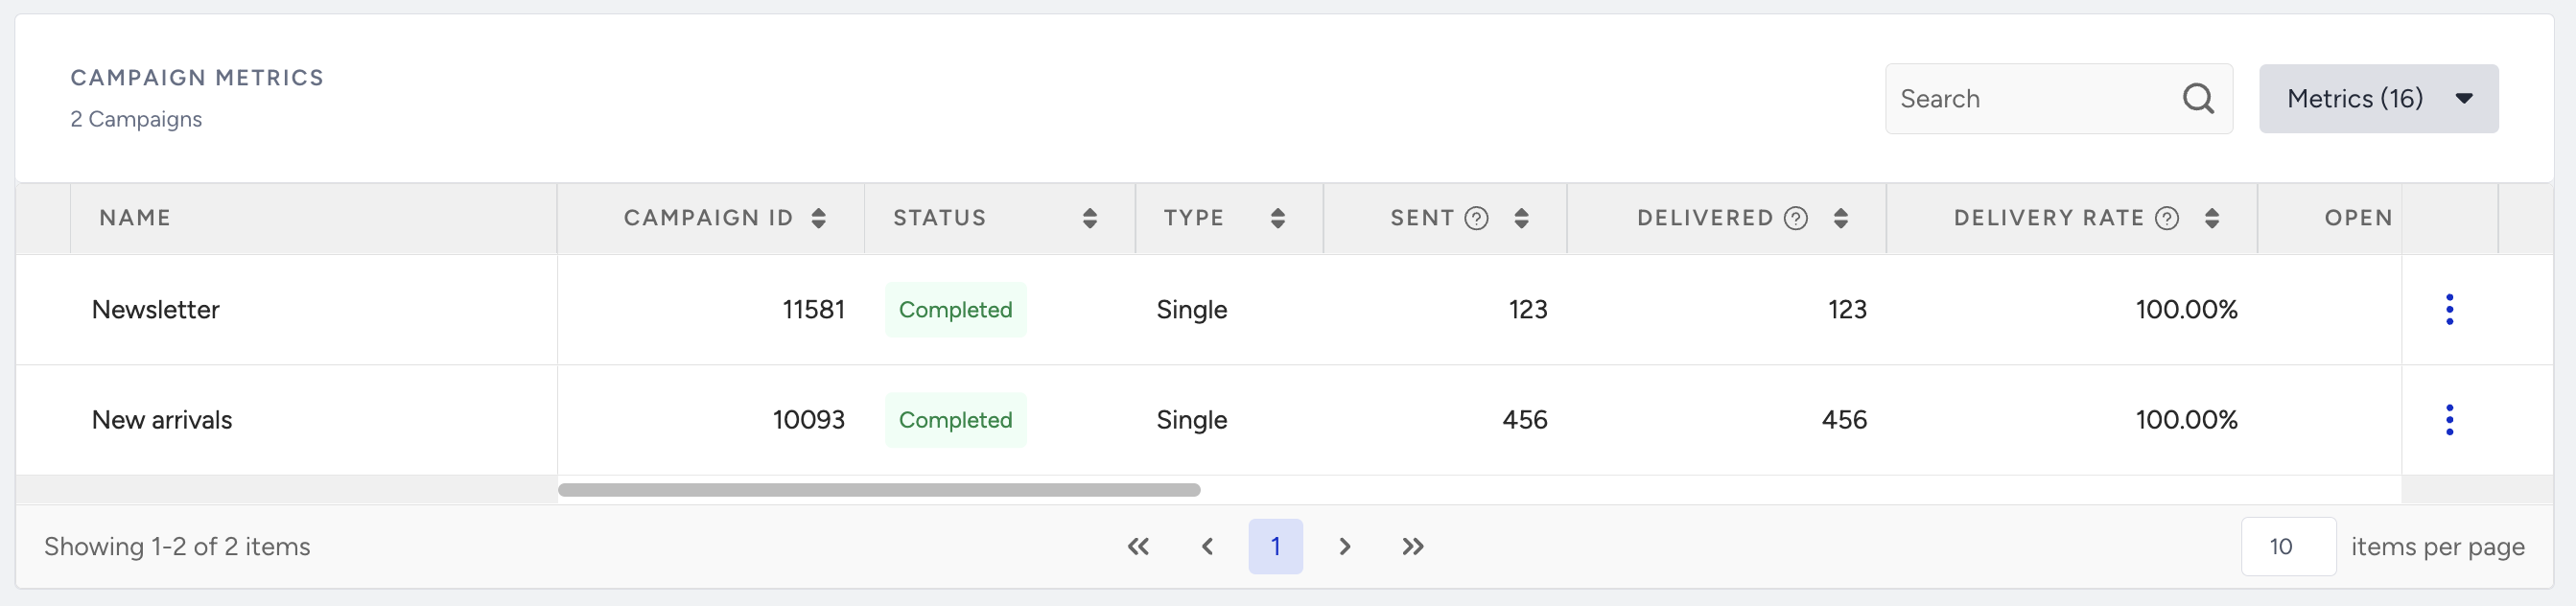
This section is currently not included in the exported report.
All campaigns that received any email events during the selected date range are listed by default unless you apply the Send Date filter.
Device Analytics
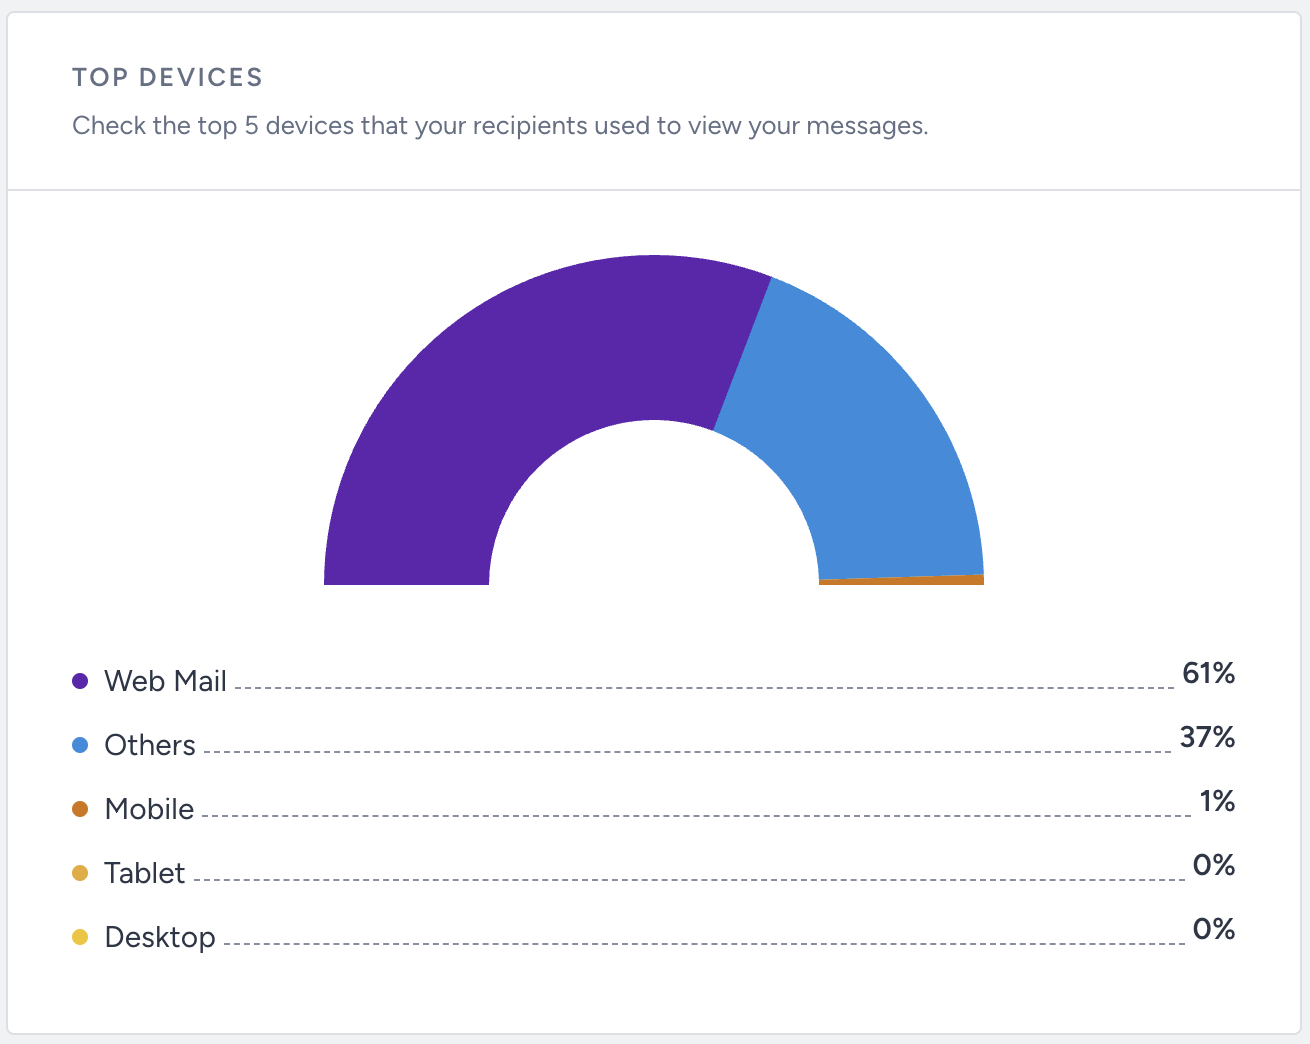
You can see how your subscribers are engaged with your email campaigns on different devices. The Top Devices graph shows the distribution of clicks by percentage on desktop, webmail, tablet, mobile, and other devices. See below for what each device type represents:
Device | Details |
|---|---|
Desktop | Can be an email software on your desktop computer (e.g., Outlook, Apple Mail, etc.) |
Web mail | Can be a web-based email client (e.g., Google, Outlook, Yahoo, etc.) |
Tablet | Can be a tablet with any operating system (e.g., Android tablet, iPad, etc.) |
Mobile | Can be a mobile phone with any operating system (e.g., Android, iPhone, etc.) |
Other devices | Can be an unidentified device |
Email Client Analytics
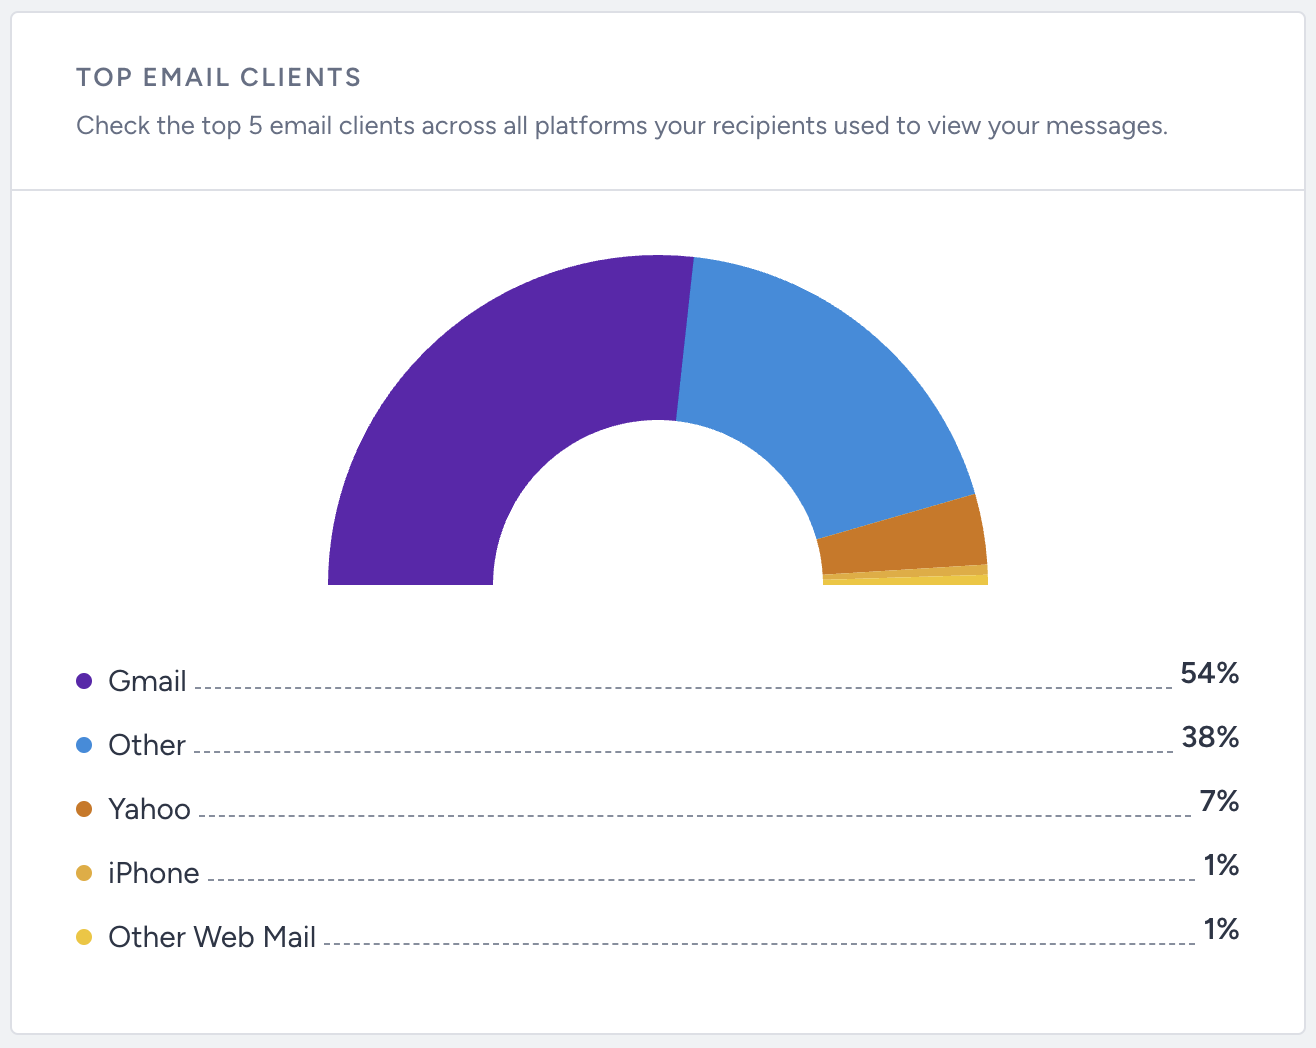
You can view how your subscribers are engaged with your email campaigns on different email clients. The Top Email Clients graph shows the distribution of clicks on Android Mail client, Apple Mail, Gmail, Outlook, Yahoo, iPad, iPhone, Other Web Mail clients, and other (for the rest) by percentages.
Link Click Activity
.png)
Lastly, the link click activity section lets you see how recipients interact with your email campaigns. "Clicks" shows the total number of clicks on a specific link while "Unique Clicks" represents the number of unique recipients who clicked on that link. For example, if a user clicks the same link multiple times, all clicks are counted and displayed under "Clicks." However, as for the "Unique Clicks", the system counts them only once, as all the clicks are from the same user.
You can display up to 30 links.