The Overall Web Push analytics help you understand the performance of the Web Push notifications you have sent.
To access the Web Push Analytics page, navigate to Reports > Web Push Analytics, or switch to the Analytics tab on the Web Push campaign listing page.
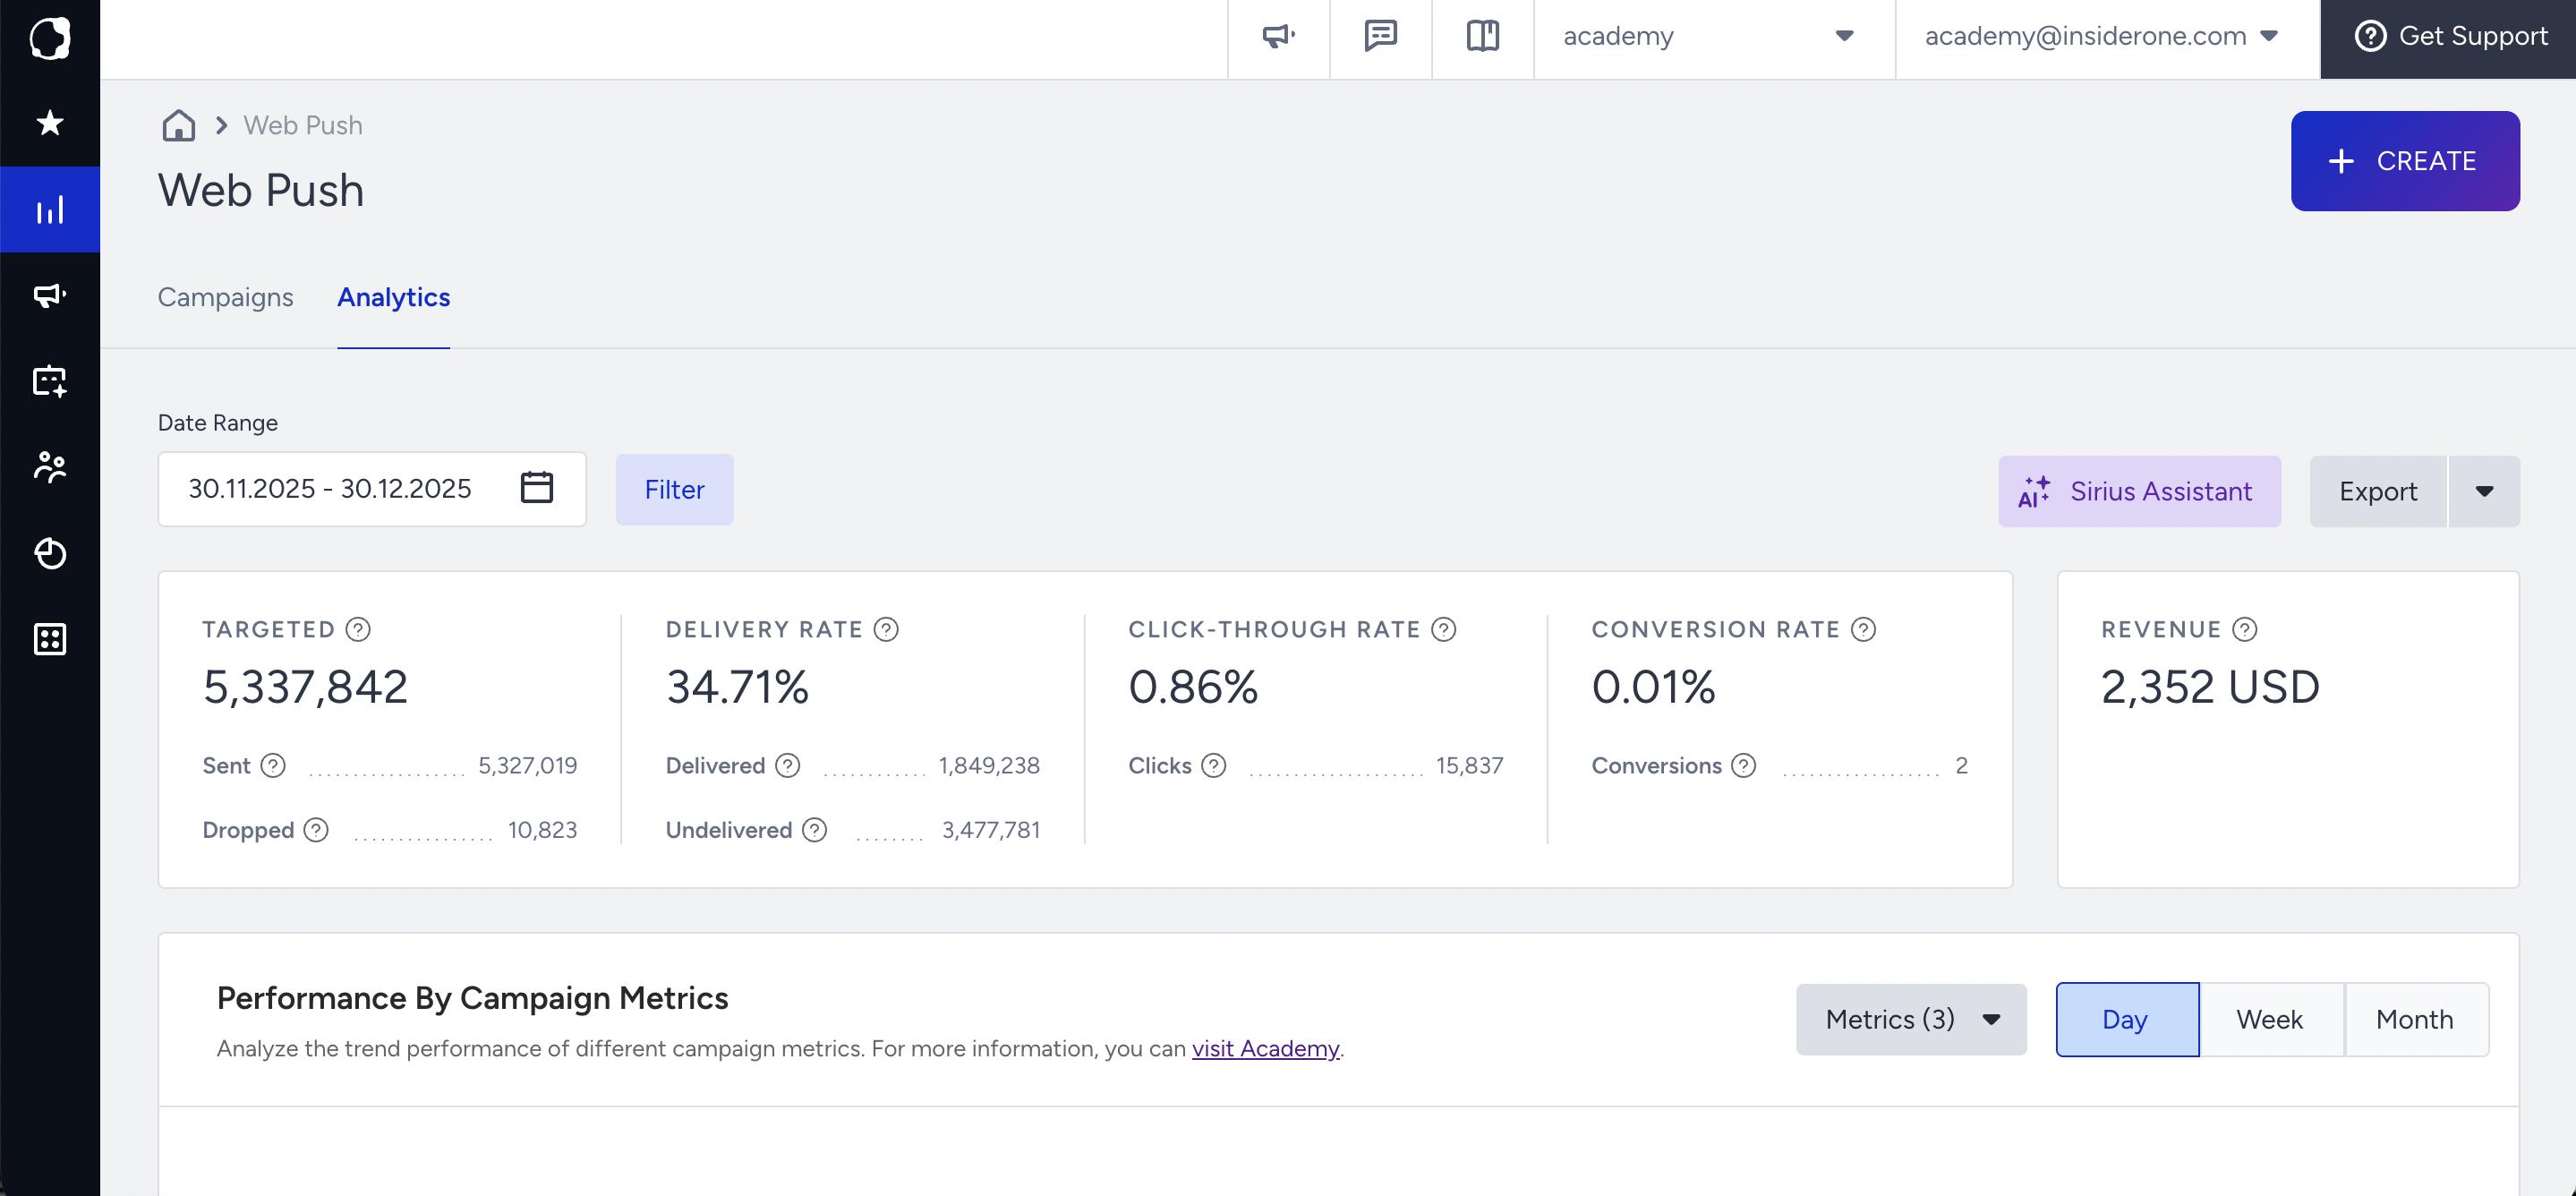
You can view a summary of Web Push notifications and access analytics for the notifications targeted within the selected time range. You can also export Web Push analytics for a custom date range and the applied filters.
Key Metrics
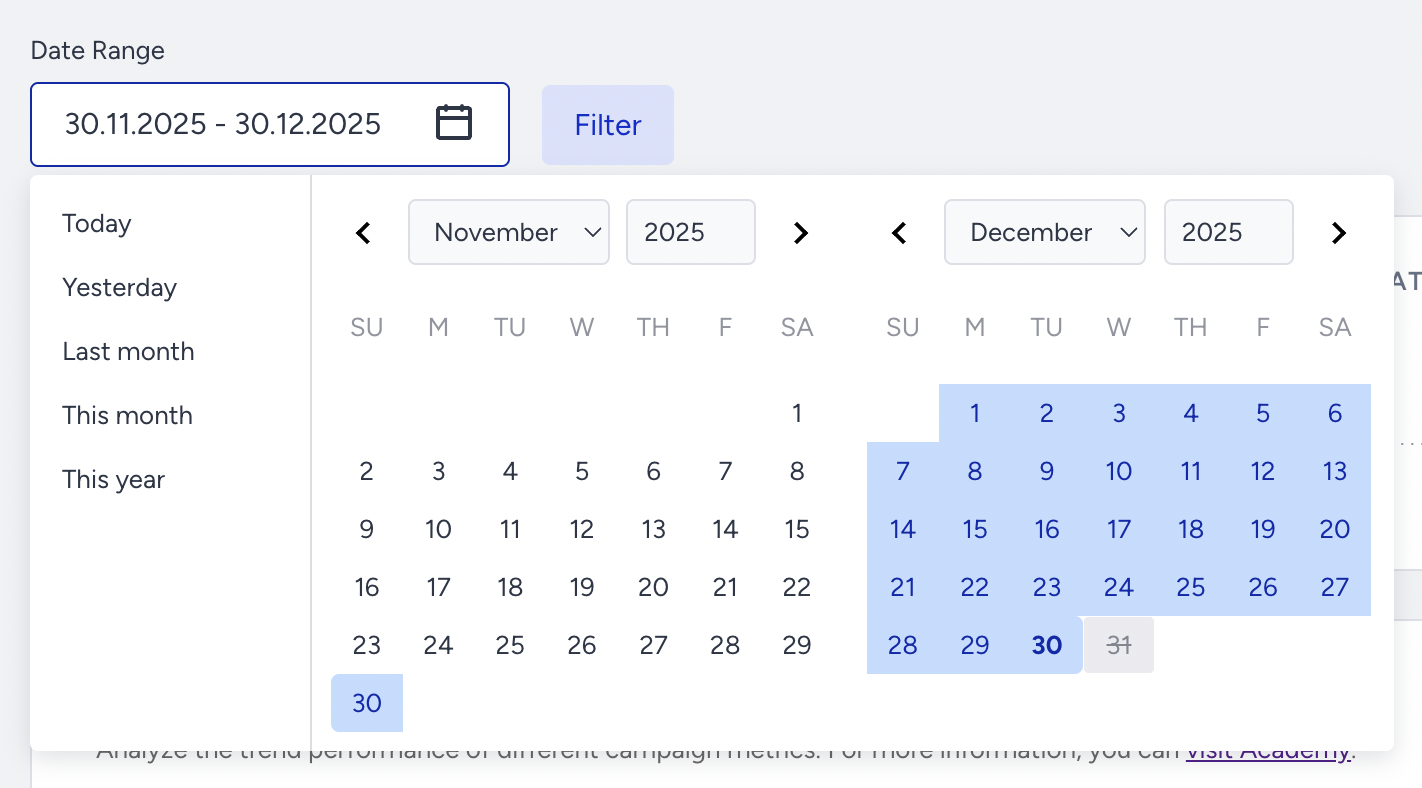
Narrowing down your results with the date picker, you can see the following metrics for Web Push: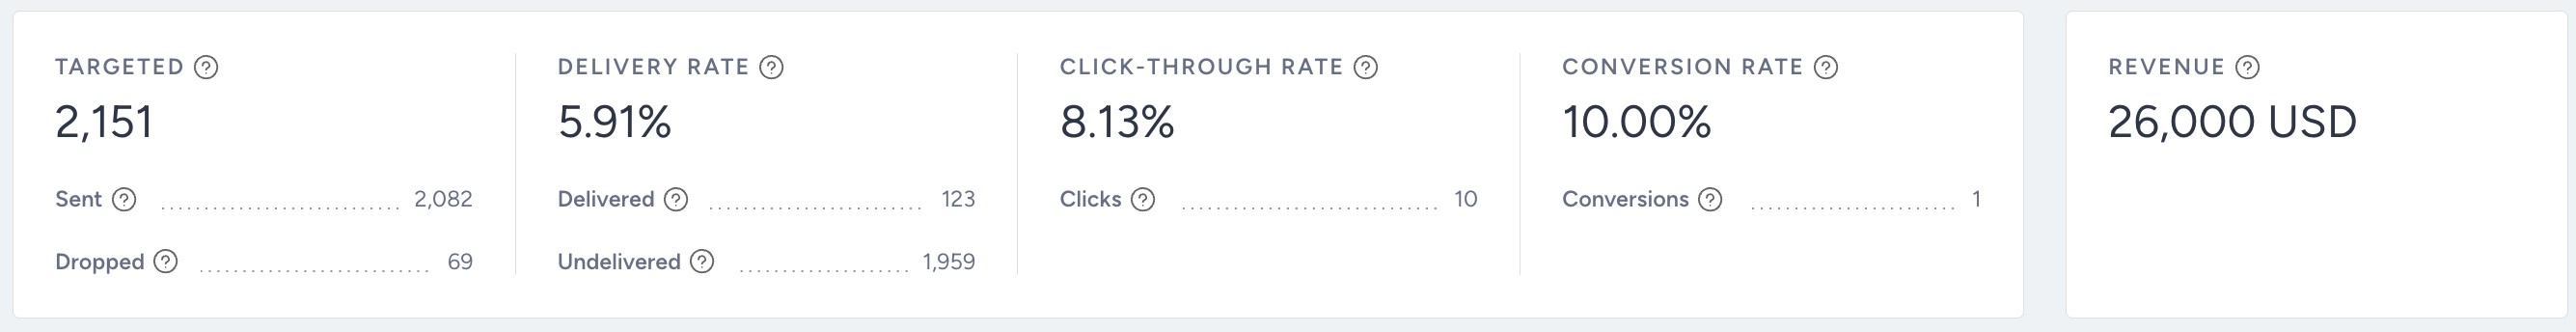
Targeted: The number of recipients in your target audience generated based on the segmentation of your campaign. This is the audience count you see before launching your Web Push campaigns.
Sent: The total number of Web Push messages addressed to the recipients.
Dropped: Even though you initially target a certain number of users when you launch your campaign, some of these user tokens are not targeted in your campaign funnel. The count of eliminated tokens is displayed as “Dropped.”
Delivery Rate: The percentage of the messages delivered to the sent Web Push notifications. In other words, it is the percentage of users who have seen your message of those who had the chance to see it.
Delivered: The number of Web Push messages successfully transferred to the recipients. In other words, these are the users who have received your message.
Undelivered: The number of Web Push messages that weren’t addressed to the recipients by the service provider.
Users are notified as soon as a product is back in stock or its price drops if the rules and segments have been matched. As a result, you may notice a higher number of delivered push notifications in your campaign analytics compared to the previous periods.
Click-through Rate: The percentage of Clicks to the Delivered Web Push messages.
Clicks: The total number of times the recipients clicked on your Web Push message.
Conversions for Web Push campaigns are attributed using a last-click model. This means that only the last eligible campaign clicked within the attribution window will receive credit for a conversion. If a user clicks multiple Web Push campaigns before making a purchase, the conversion is credited only to the most recent eligible campaign. If no campaign qualifies within the attribution window, the conversion will not be attributed.
Revenue: The value of purchases made via your Web Push messages within the conversion attribution duration.
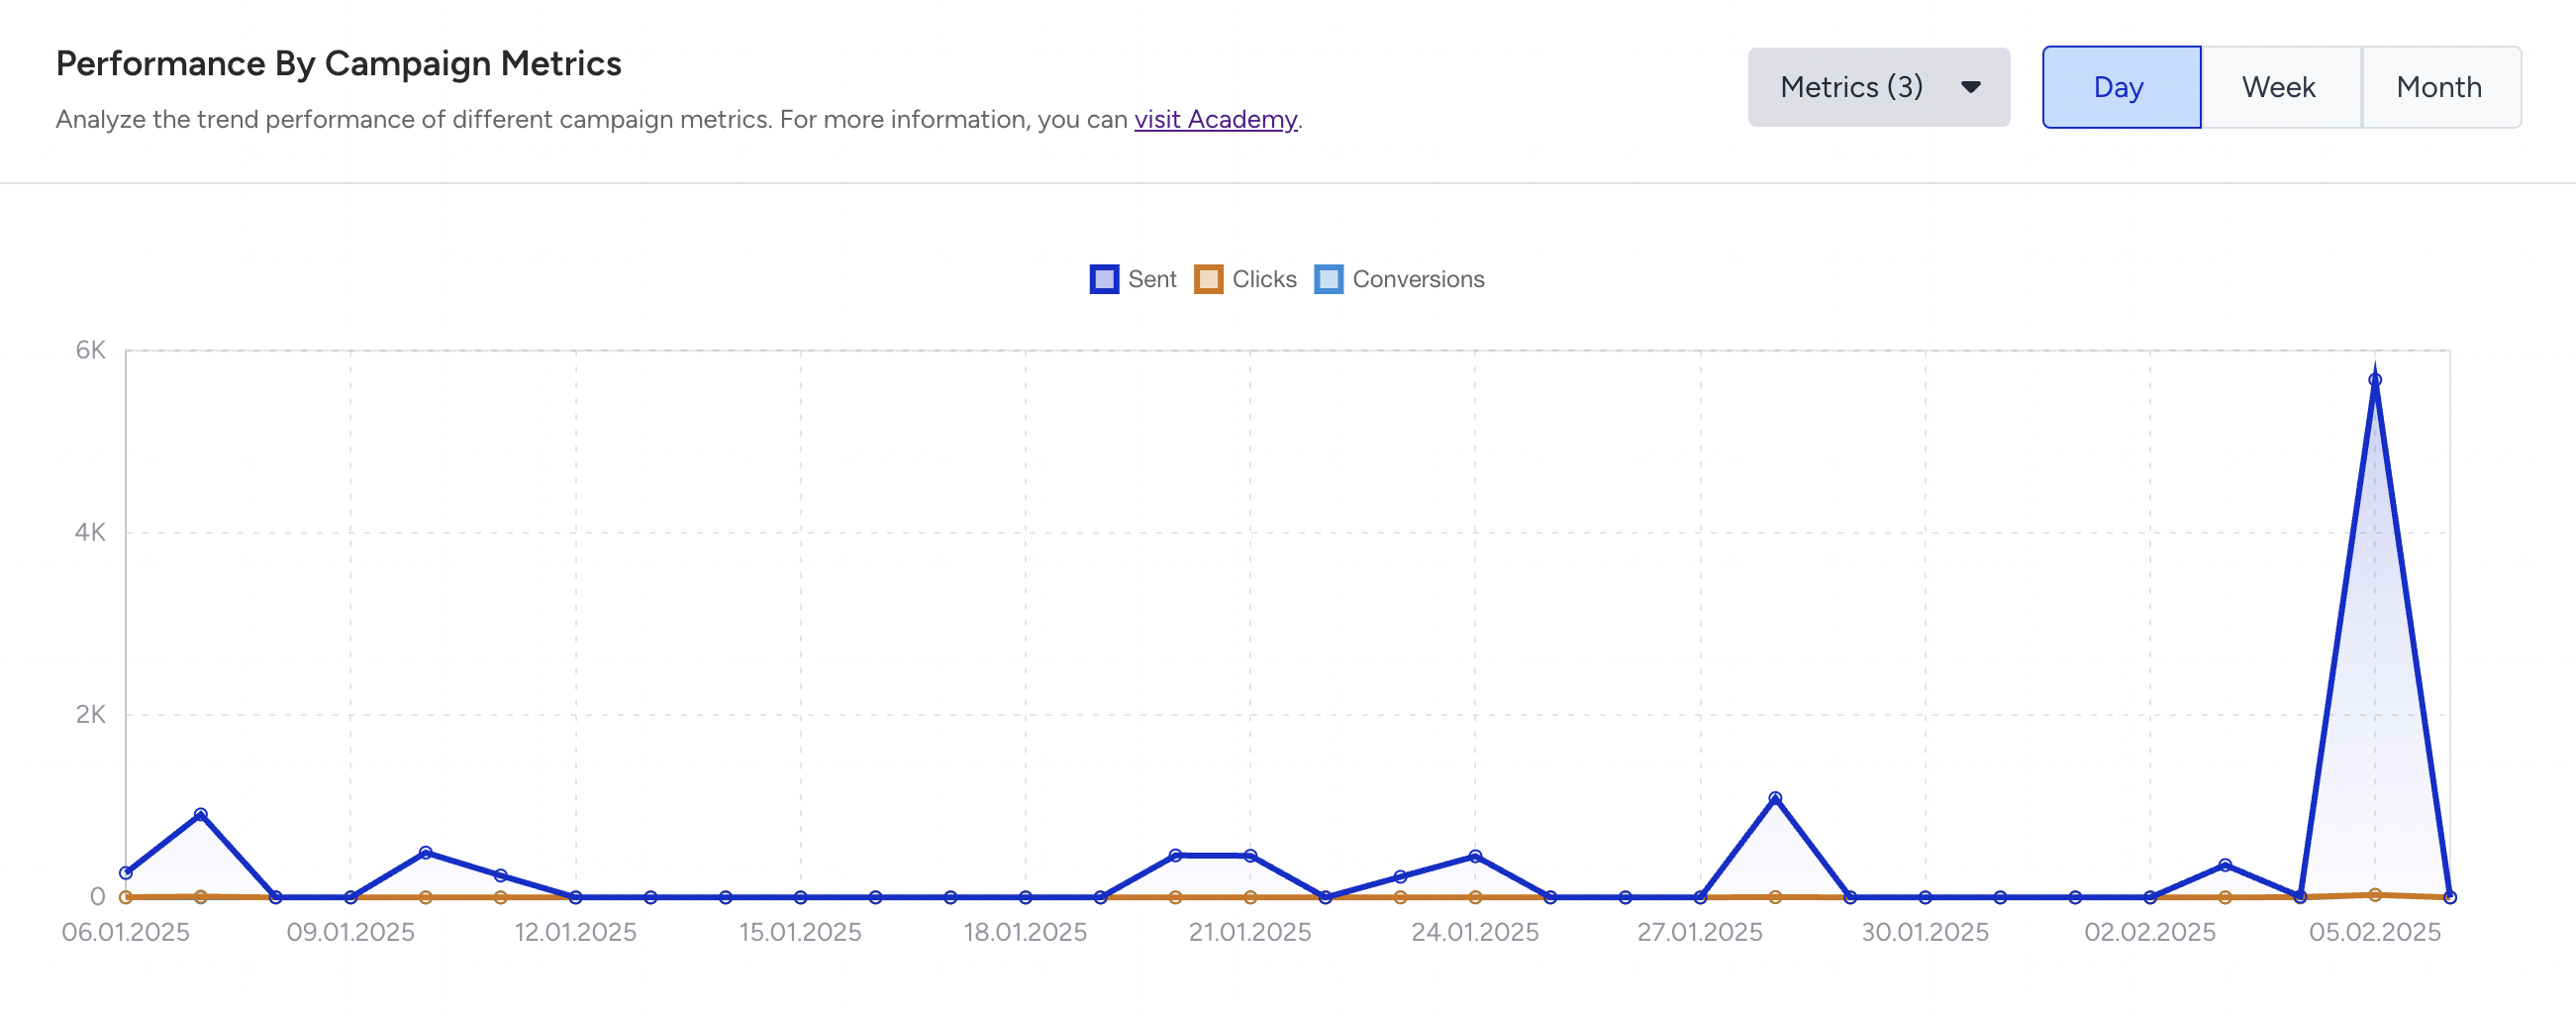
Performance by Campaign Metrics
You can analyze the trend performance of your various campaign metrics on a daily, weekly, or monthly basis.
The reason why you might observe that the metrics for a selected date range sometimes differ from the sum of metrics for individual days on the Web Push Analytics:
The Web Push Analytics logic is designed to provide a comprehensive view of user metrics for the selected date range:
When you select a single day, the metrics include campaigns sent on that date and the actions recorded for those campaigns on the same day.
When you select a date range, the analytics combine the metrics for campaigns sent during the selected range and recorded within the range.
For example,
If you select December 17th, the analytics will display metrics for campaigns sent on that day and their respective actions recorded on that day. If 3,000 clicks occurred on December 17th, the analytics will show 3K clicks.
Similarly, if you select December 18th, the analytics will show metrics for campaigns sent on that day, with their respective actions recorded on that day. If 5,000 clicks occurred on December 18th, the analytics will show 5K clicks.
For a date range of December 17th–18th, the analytics will include both metrics for campaigns sent on December 17th and December 18th, as mentioned above, and actions recorded on December 18th for campaigns sent on December 17th. Therefore, instead of seeing the sum of 3K + 5K clicks (from the individual days), the range total might show more than 8K clicks.
Metrics such as delivered, clicks, conversions, etc., that are recorded a day after a campaign is sent are included in the range's total. That's why you might observe differences from a simple sum of metrics for individual days.
Unsuccessful Messages
You can analyze the reasons for the dropped and undelivered Web Push messages.
Dropped
Under Dropped messages, you can analyze why your campaigns did not target some of the Web Push user tokens.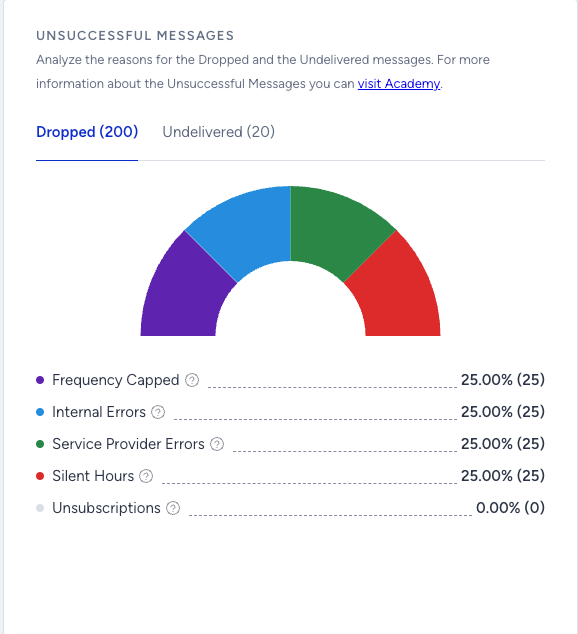
Frequency Capped: The number of Dropped messages due to the Channel and Campaign Frequency Capping settings.
Silent Hours: The number of Dropped messages due to the Silent Hours settings.
Internal Errors: The number of Dropped messages due to various internal system issues.
Service Provider Errors: The number of Dropped messages due to transmission issues to the Firebase Cloud Messaging servers.
Unsubscriptions: The number of Dropped messages due to user opt-outs.
Undelivered
Under Undelivered messages, you can analyze why some Web Push messages weren’t addressed to the recipients.
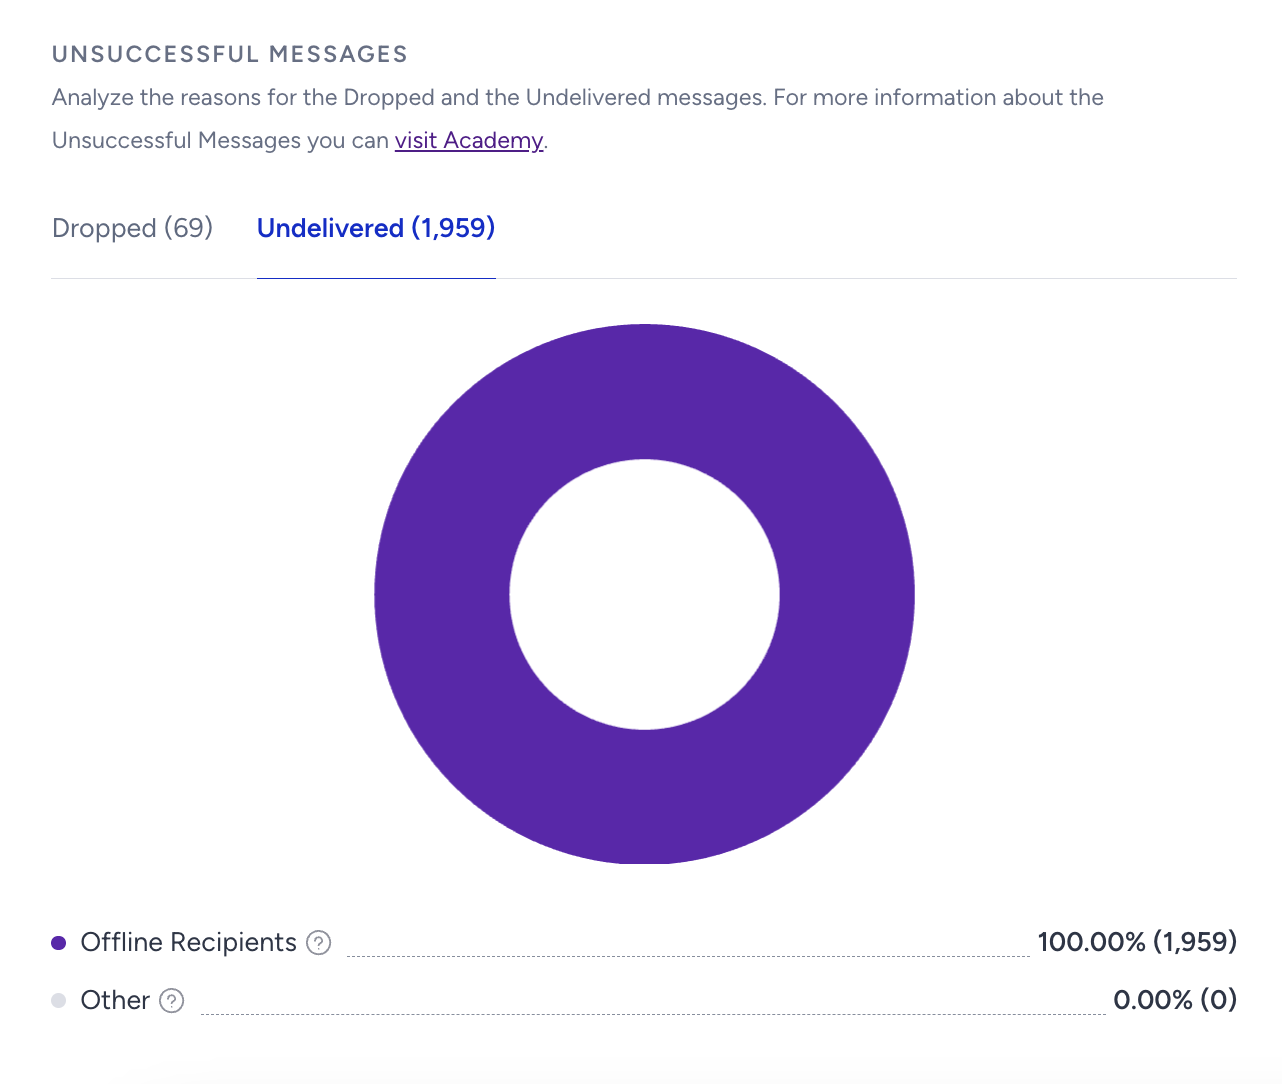
Offline Recipients: The number of Undelivered messages due to the recipients who weren't online within the campaign's Time to Live duration.
Other: The number of recipients we have failed to deliver information to due to unknown causes that might be system-related.
Performance by Campaign Type
You can review and compare the overall performance of different campaign types. It will not be visible unless you are using the Web Push API. 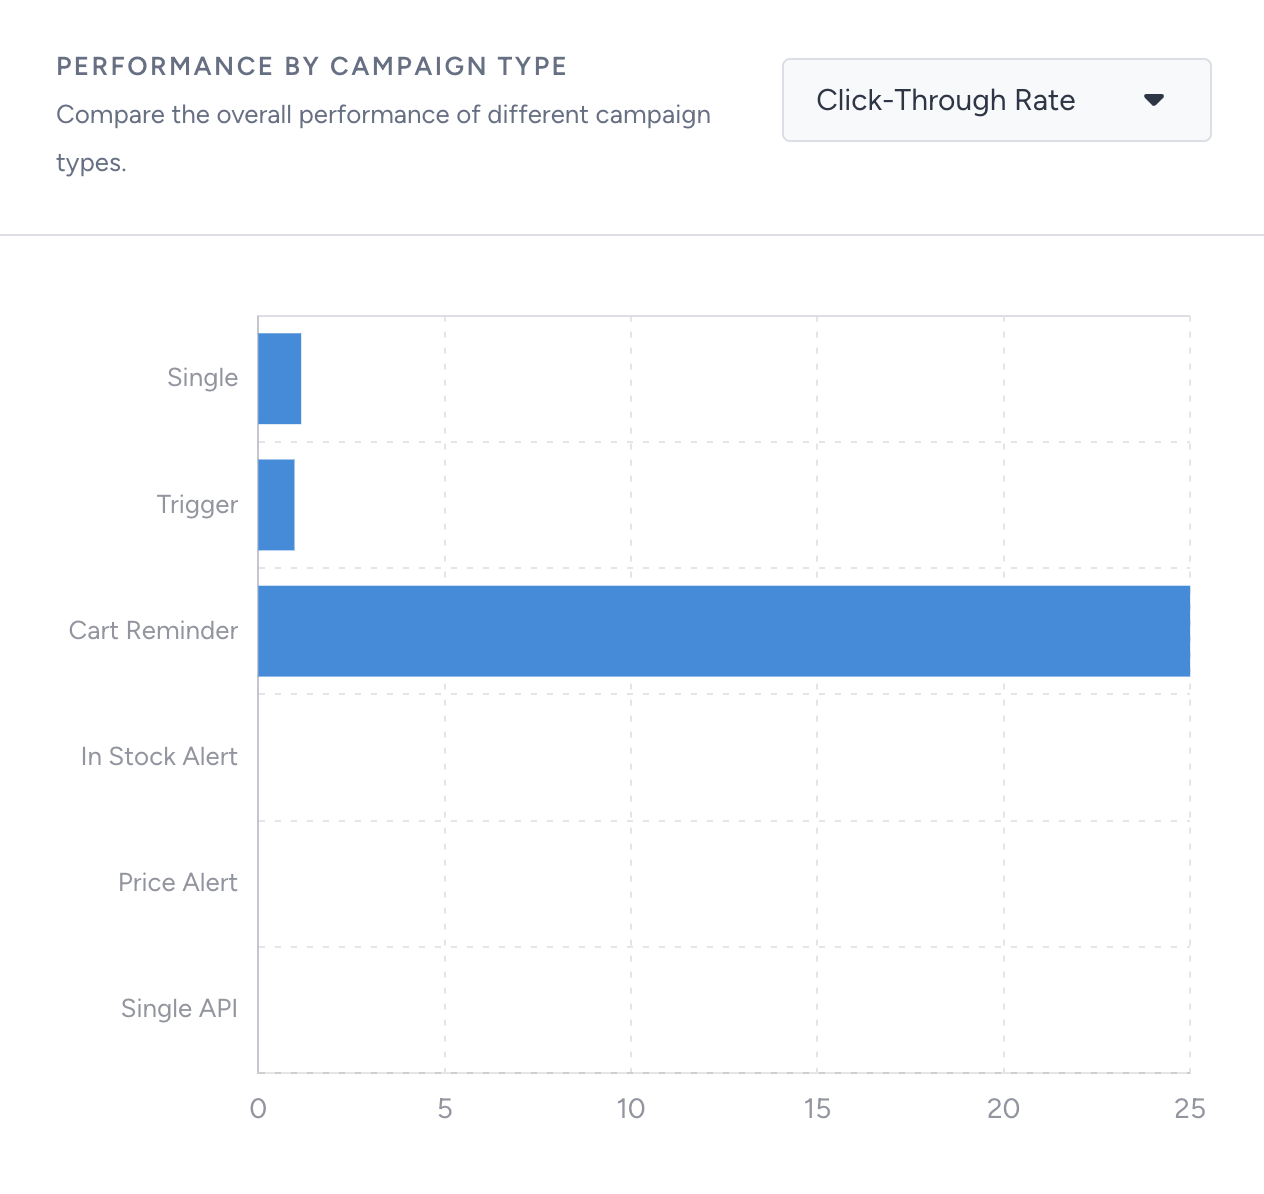
Selecting it from the dropdown menu lets you compare your campaigns by number of campaigns, delivery rate, click-through rate, conversion rate, and revenue.
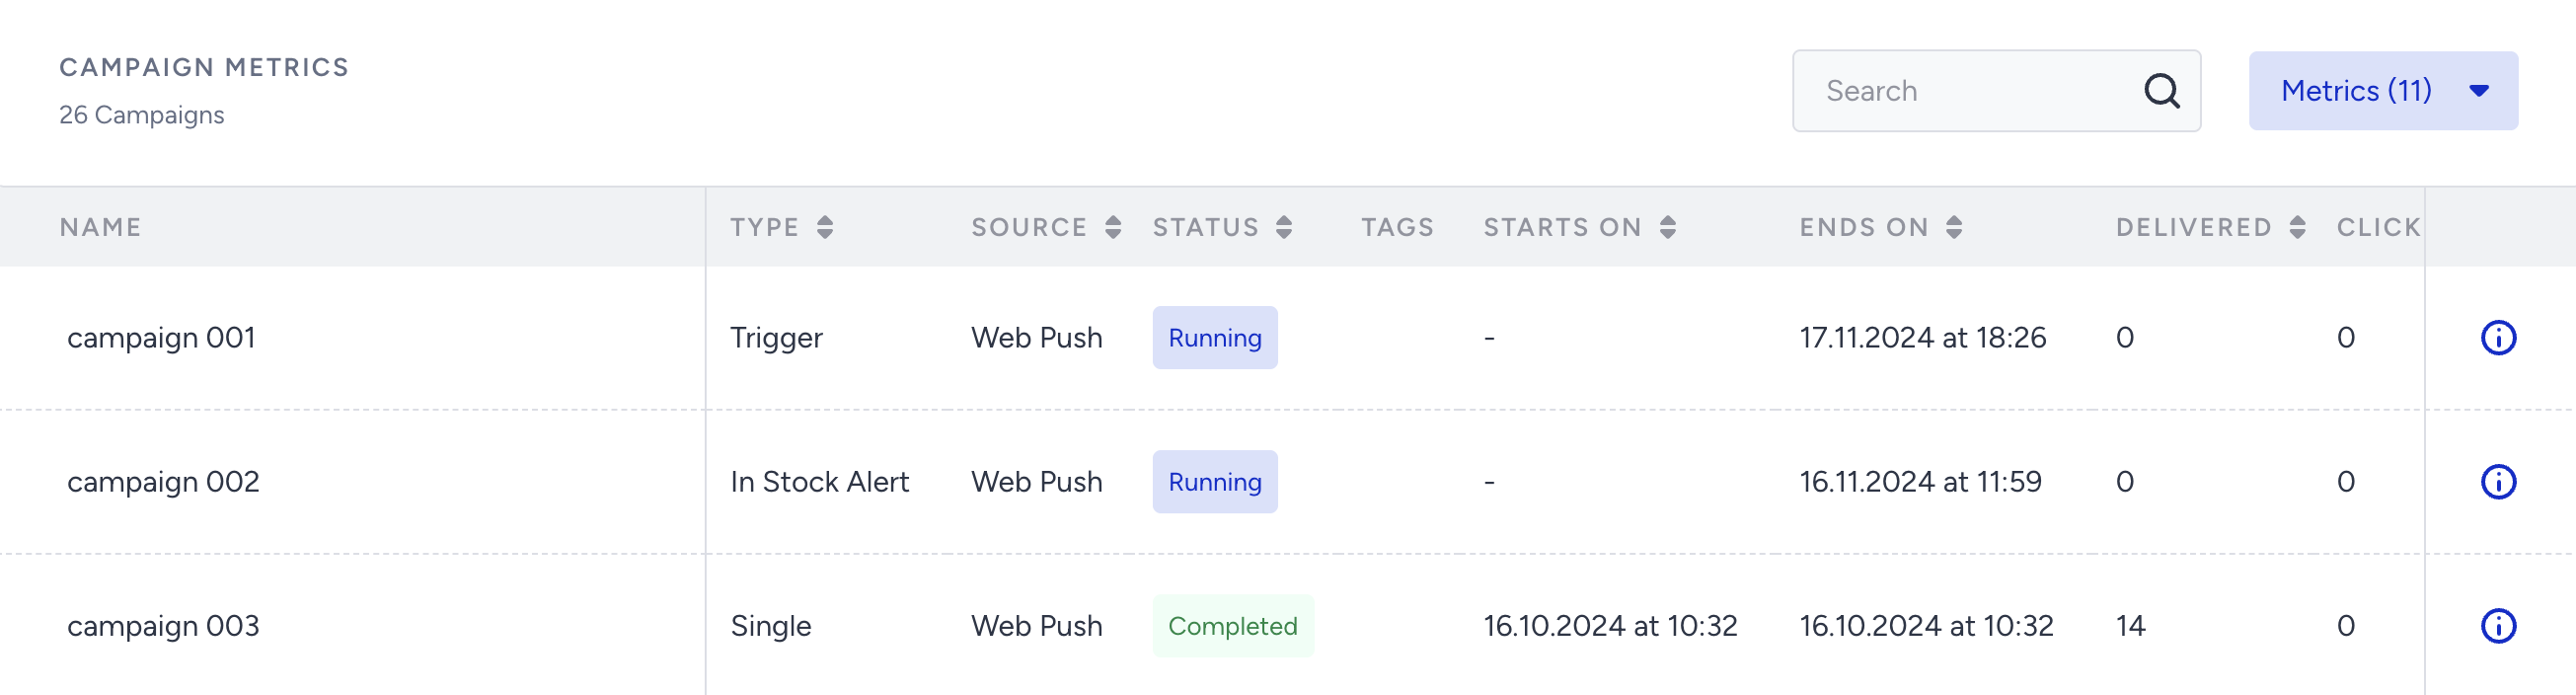
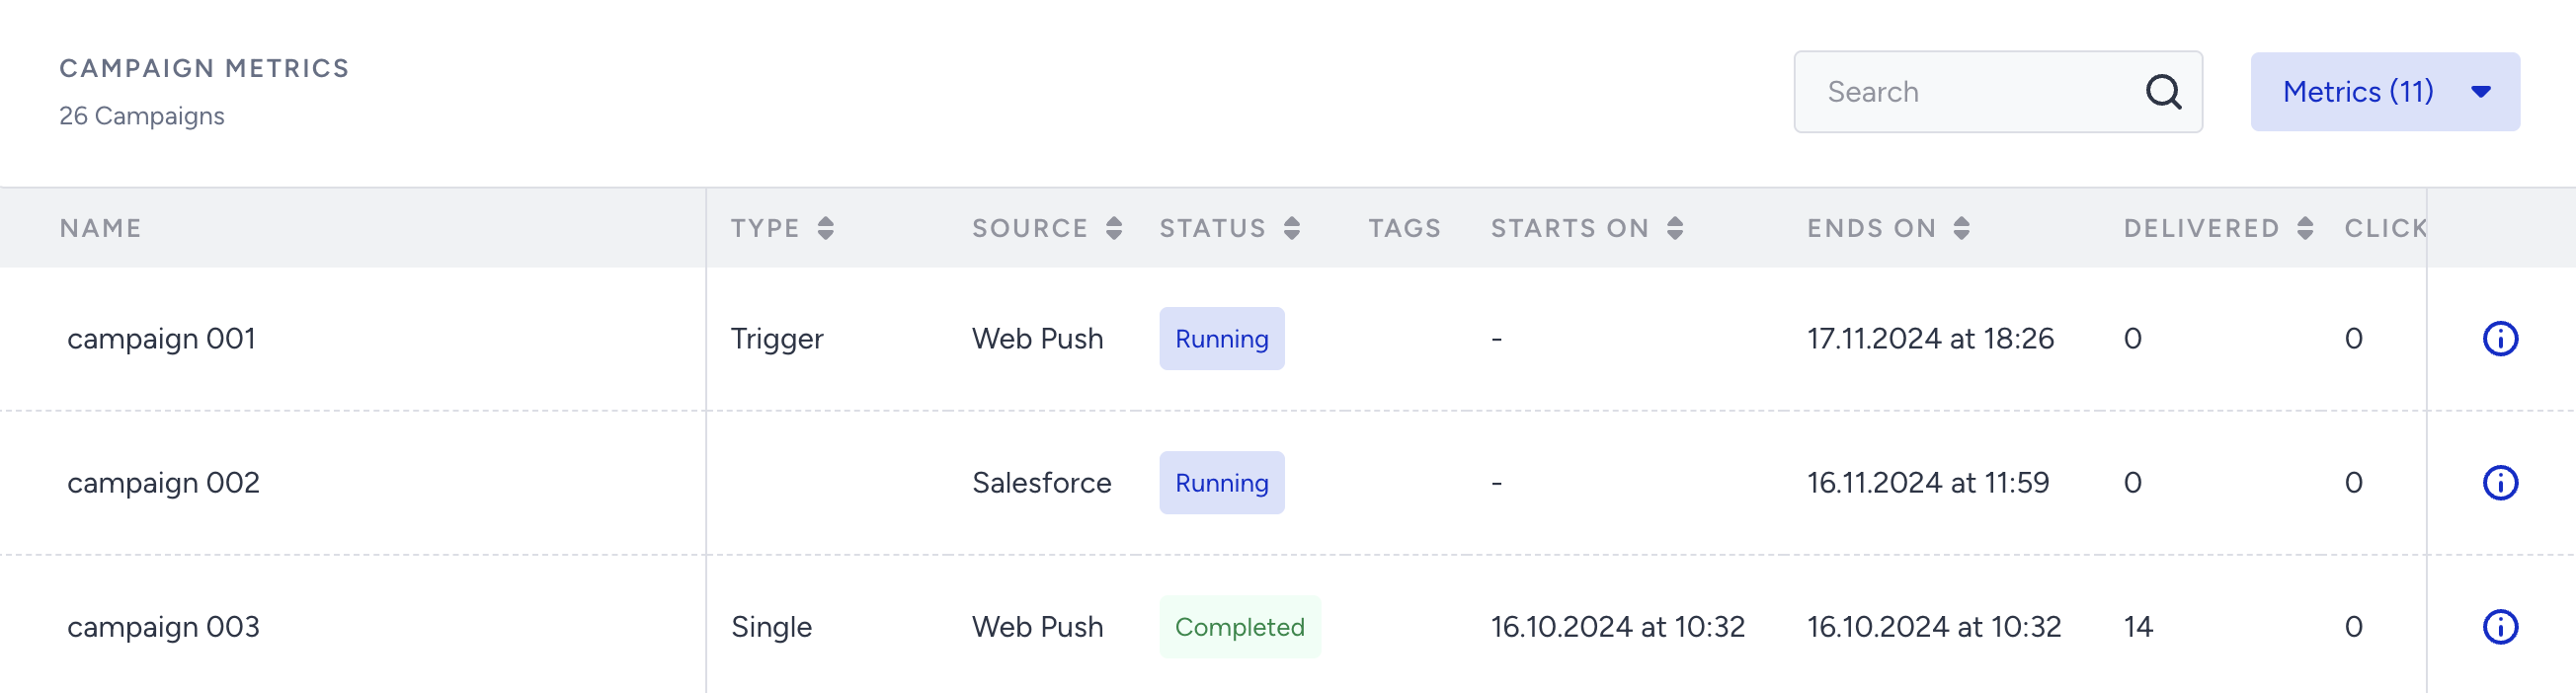
Campaigns Metrics
You can view the details of your campaign metrics. The campaigns listed change in line with the filters you apply. You can easily reach a specific campaign using the provided Search box.
Clicking a campaign name in the list displays its campaign-level analytics. You can also access campaign-level analytics by clicking the Details button next to each campaign, which shows its details.
You can also refer to the video below to better understand Web Push Analytics:
If this video does not load in your region, you can watch it on our YouTube Channel.
Salesforce Analytics for Web Push Custom Activity
If you have the Salesforce integration, you can track the logs of Web Pushes sent with the Messaging Custom Activity used in Salesforce Journeys on the Web Push Analytics page, where you can view data from both InOne and Salesforce journeys.
Salesforce campaigns will be listed on the Analytics page, but not the Web Push campaign listing page. To view campaign analytics pages, click the respective campaign on the overall analytics page.
The Campaign Metrics table displays campaigns, including Salesforce campaigns, and their associated metrics. When you click a campaign name, you will be redirected to the campaign's detailed analytics.
You can use the Campaign Source filter to separate and analyze the performance of Salesforce and InOne campaigns. 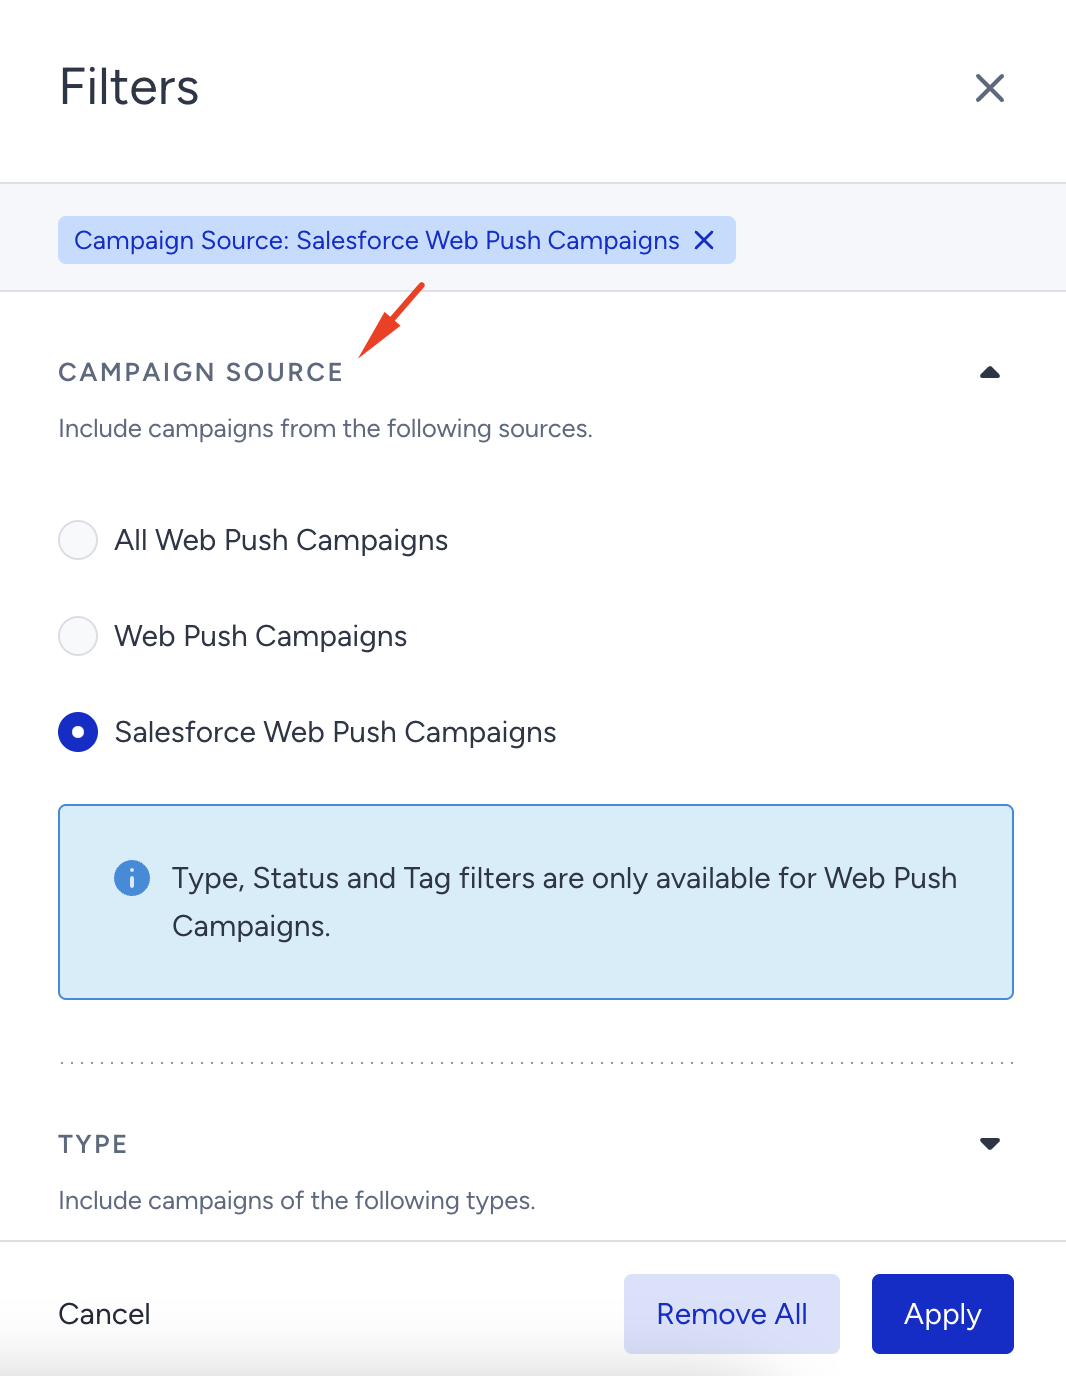
Certain filters, like Type, Status, Tag, and Groups, do not apply to Salesforce campaigns. These features are specific to InOne campaigns; they cannot be used for sales sent from Salesforce. Additionally, features like Frequency Capping and Silent Hours are not applicable in this context.
Obtaining the overall performance metrics of Web Push campaigns, either from InOne or Salesforce, when filtered by campaign source, enables you to assess the effectiveness and impact of campaigns from specific sources.