Architect is Insider One’s visual journey builder, empowering you to design, automate, and optimize personalized experiences across web, app, email, SMS, WhatsApp, and more. Architect acts as your journey command center, enabling marketers to create, connect, and refine automation flows with ease, no developer support needed.
With Architect, you can:
Design omnichannel journeys by connecting journey elements using the + Create icon.
Trigger personalized messages in real time based on user actions, events, or attributes.
Segment audiences dynamically using predictive, behavioral, or RFM segmentation.
Test and optimize performance through built-in A/B testing and analytics.
Coordinate all channels for consistent communication and experience from first touch to conversion.
Measure outcomes instantly, tracking journey entries, completions, conversions, and revenue impact.
In this guide, you’ll learn how to turn Architect into a reliable driver for time-sensitive campaigns, real-time updates, and conversational experiences that build loyalty and drive action.
Whether you’re just getting started or optimizing a mature setup, you don’t have to read everything in order—but we recommend skimming the full flow once.
What’s new (2024–2025 Highlights)
Let’s start with what’s changed recently, so you’re working with the latest capabilities and not old assumptions.
Visibility depends on the products enabled in your contract.
Feature/Update | Why It Matters | When to Use | Business Impact |
|---|---|---|---|
Built-in AI analytics agent for instant insights and recommendations | For journey optimization and troubleshooting | Makes advanced analytics accessible to everyone | |
Enables accurate performance comparison by holding back a percentage of users | For measuring true incremental impact of journeys or A/B tests | Transparent ROI tracking and uplift data | |
Determines which journey triggers first when multiple journeys target the same user | For brands running many active or overlapping journeys | Prevents conflicting messages, improves user experience | |
Syncs user data and journey logic across brands, markets, or regions | For enterprise accounts managing multi-country or multi-brand instances | Ensures unified targeting and analytics consistency |
These updates shape how you’ll use Architect today, especially when it comes to performance and reporting.
Some features may require activation. For the latest updates, see the Architect What's New.
Now, let’s quickly revisit what Architect can do and how the core pieces fit together in your InOne panel.
Core Architect capabilities
Architect is built around a few essential building blocks. Once you’re comfortable with these, every strategy in this guide will feel much easier to apply.
Integration & data foundation
Ensure all events, attributes, and user identifiers are tracked correctly across channels. Read more on UCD.
Validate reachability on channels before journeys go live.
Confirm API, webhook, and tag integrations are functioning.
Journey design & logic
Build journeys step-by-step with the “+” add-element flow.
Use Wait, Check, Action, and Channel elements for clear logic. Read more on Starter Elements.
Test journey flow before launch using Test Journey, Test Message, or Dry-Run modes.
Keep journeys under 100 elements for optimal performance.
Segmentation & targeting
Use Predictive Segments, RFM, or Channel Interactions for lifecycle-based targeting. Read more on Segmentation.
Narrow audience filters to include only relevant users, and avoid bulk messaging.
Personalization & dynamic content
Use Dynamic Content and personalized variables in messages.
Incorporate multi-channel orchestration for consistent brand experiences.
Analytics & optimization
Monitor journey entries, completions, drops, conversion rates, open rates, and click rates in Architect Analytics.
Use Performance Alerts for early warnings on delivery or high exit rates.
Use A/B Split and Control Group features to measure uplift accurately.
Governance & experience management
Set Entry Capping and Frequency Limits to prevent over-messaging.
Use Silent Hours and Send Time Optimization to respect user timing.
Manage compliance across all channels, ensure opt-out and consent tracking are active.
How to apply
Connect journeys to the customer lifecycle
Onboarding: Welcome and activation flows.
Engagement: Personalized offers, loyalty, and win-back journeys.
Conversion: Cart recovery, price drop, and transactional updates.
Re-engagement: Win-back and feedback journeys.
Journey types
High-Impact Templates: Onboarding, cart recovery, win-back, loyalty.
Custom Journeys: Use the Use Case Library for inspiration.
With these core concepts in mind, you’re ready to put Architect to work.
Quick wins
If you want to see impact fast, start here. These quick wins take 10–30 minutes to implement and are designed to deliver visible results without heavy setup or cross-team dependencies.
Validate your integration and event tracking before launching any journey.
Start with proven journey templates like onboarding, cart recovery, or win-back.
Personalize every touchpoint, use dynamic content and segmentation for higher engagement.
A/B test triggers, content, and timing for continuous improvement.
Monitor journey analytics and optimize based on real-time data.
Explore the Use Case Library for journey inspiration by industry, channel, or goal.
Once you’ve tested one or two of these wins, you’ll have a baseline for how Architect performs in your environment.
To keep everyone aligned and move from “one-off experiments” to a shared plan, use these prompts with your team.
Team conversation starters
Use these conversation starters to help your team align on priorities, review performance, and identify the most impactful next steps with Architect.
Which journeys are performing best, and why?
Are any journeys too complex and need simplification?
What new data points or segments could improve personalization?
Where do users drop off, and how can we fix it?
What’s the next journey we should build based on current metrics?
What’s our #1 business goal for next quarter, and how can Architect help automate or scale it?
Where do we see the biggest drop-off in our customer journey right now?
Are we seeing different behaviors across channels (e.g., higher engagement on WhatsApp vs Email)?
Should we try new multi-channel experiments, for example, SMS + App Push follow-ups for cart recovery?
These discussions will surface where you are today and what your team expects from Architect in the next 1–3 quarters.
Next, let’s connect Architect to the bigger picture: how it supports your growth, retention, and Ever Success goals.
Strategic guidance: Connect Architect to your goals
Strategically, Architect works best when it supports a clear set of business outcomes, rather than running as a standalone channel.
Validate your integration
Ensure all event tracking, user attributes, and channel integrations are set up and tested.
Map journeys to the user lifecycle
Strategically place journeys across onboarding, engagement, conversion, and re-engagement stages.
Enrich targeting & personalization
Use predictive segments, RFM, and behavioral triggers.
Monitor, optimize, and troubleshoot
Track key metrics in Architect Analytics.
Run the Health Checklist if metrics dip.
Review and scale
Tie journey outcomes to revenue uplift, opt-in growth, and conversion rates.
Identify unused templates or segments and propose expansion.
Once you’re clear on the role of Architect in your overall strategy, it’s time to tailor your approach to your current maturity level.
The playbook below helps you focus on the right actions based on where you are today, from early activation to advanced optimization.
Strategic playbook by stage
Use this table to choose your next steps by adoption stage. You don’t have to do everything at once, pick the row that matches your current reality and work from there.
Stage | Goal | Focus & Actions | What Success Looks Like |
|---|---|---|---|
Start Strong | Launch your first automated journeys. | • Build simple flows. • Use basic segments. • Add conversion goals. • Validate all paths with test devices. | • Journeys run smoothly. • Users enter + exit correctly. • Early conversions appear. |
Level Up | Add personalization + multi-channel orchestration. | • Use branches + conditions. • Integrate Web Suite, Push, Email, WhatsApp. • Use Predictive Segments. • A/B test journey variations. | • Journeys drive measurable uplift. • Higher completion + conversions. • Channels orchestrated cohesively. |
Get Back on Track | Remove blockers + simplify execution. | • Audit goals + triggers. • Simplify overly complex flows. • Reduce unnecessary triggers. • Follow best practices. | • Increased journey entries. • Fewer errors. • Higher goal completion. |
Optimize & Orchestrate | Scale Architect across your lifecycle. | • Build advanced journeys. • Connect to business KPIs. • Standardize flows for scale. • Use analytics to optimize. | • Predictable revenue from journeys. • Fully orchestrated experiences. • Scalable automation. |
As you move through these stages, your metrics will tell you whether your strategy is working or needs adjustment.
Now let’s look at the key metrics that matter for Architect, where to find them, and what to do when they’re off.
Architect key metrics: Diagnose & take action
The table below turns each metric into a simple diagnostic: where to find it, why it matters, what red flags to watch for, and which actions to take inside your InOne panel.
About dashboard names
In these guides, dashboard names appear with a short description in parentheses to clarify what insights each view provides.
Architect revenue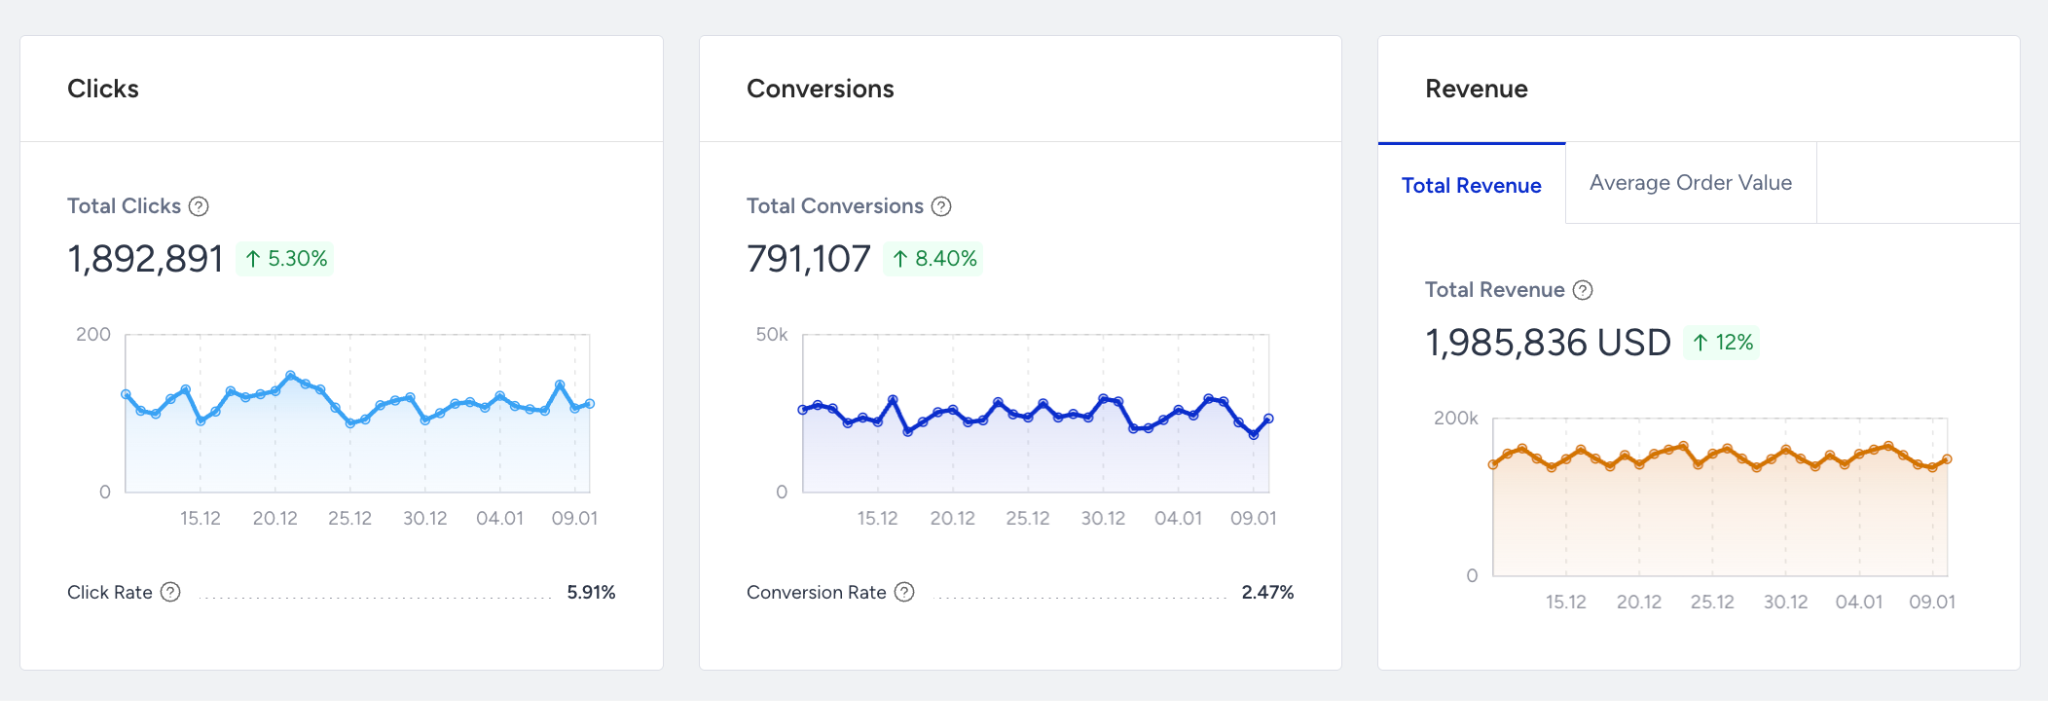
Where to find it: Live Statistics, Analytics
Why it matters: Shows revenue generated or influenced by Architect journeys. It’s your clearest signal of whether your automation is driving business outcomes.
What to watch for (decline / below benchmark): Revenue flat or declining while entries, sends, and clicks are healthy.
Actions to take / features to use: Improve segmentation (Predictive / RFM), refine offers, adjust timing, verify conversion tracking, focus journeys on high-intent use cases (cart recovery, winback, onboarding).
Benchmarks / watch for: Look for positive revenue trend over time as journeys mature.
Frequency: Weekly / Monthly
Examples: You add a new onboarding journey and see more clicks but no extra revenue → revisit offers and mapped conversion events.
Journey entries
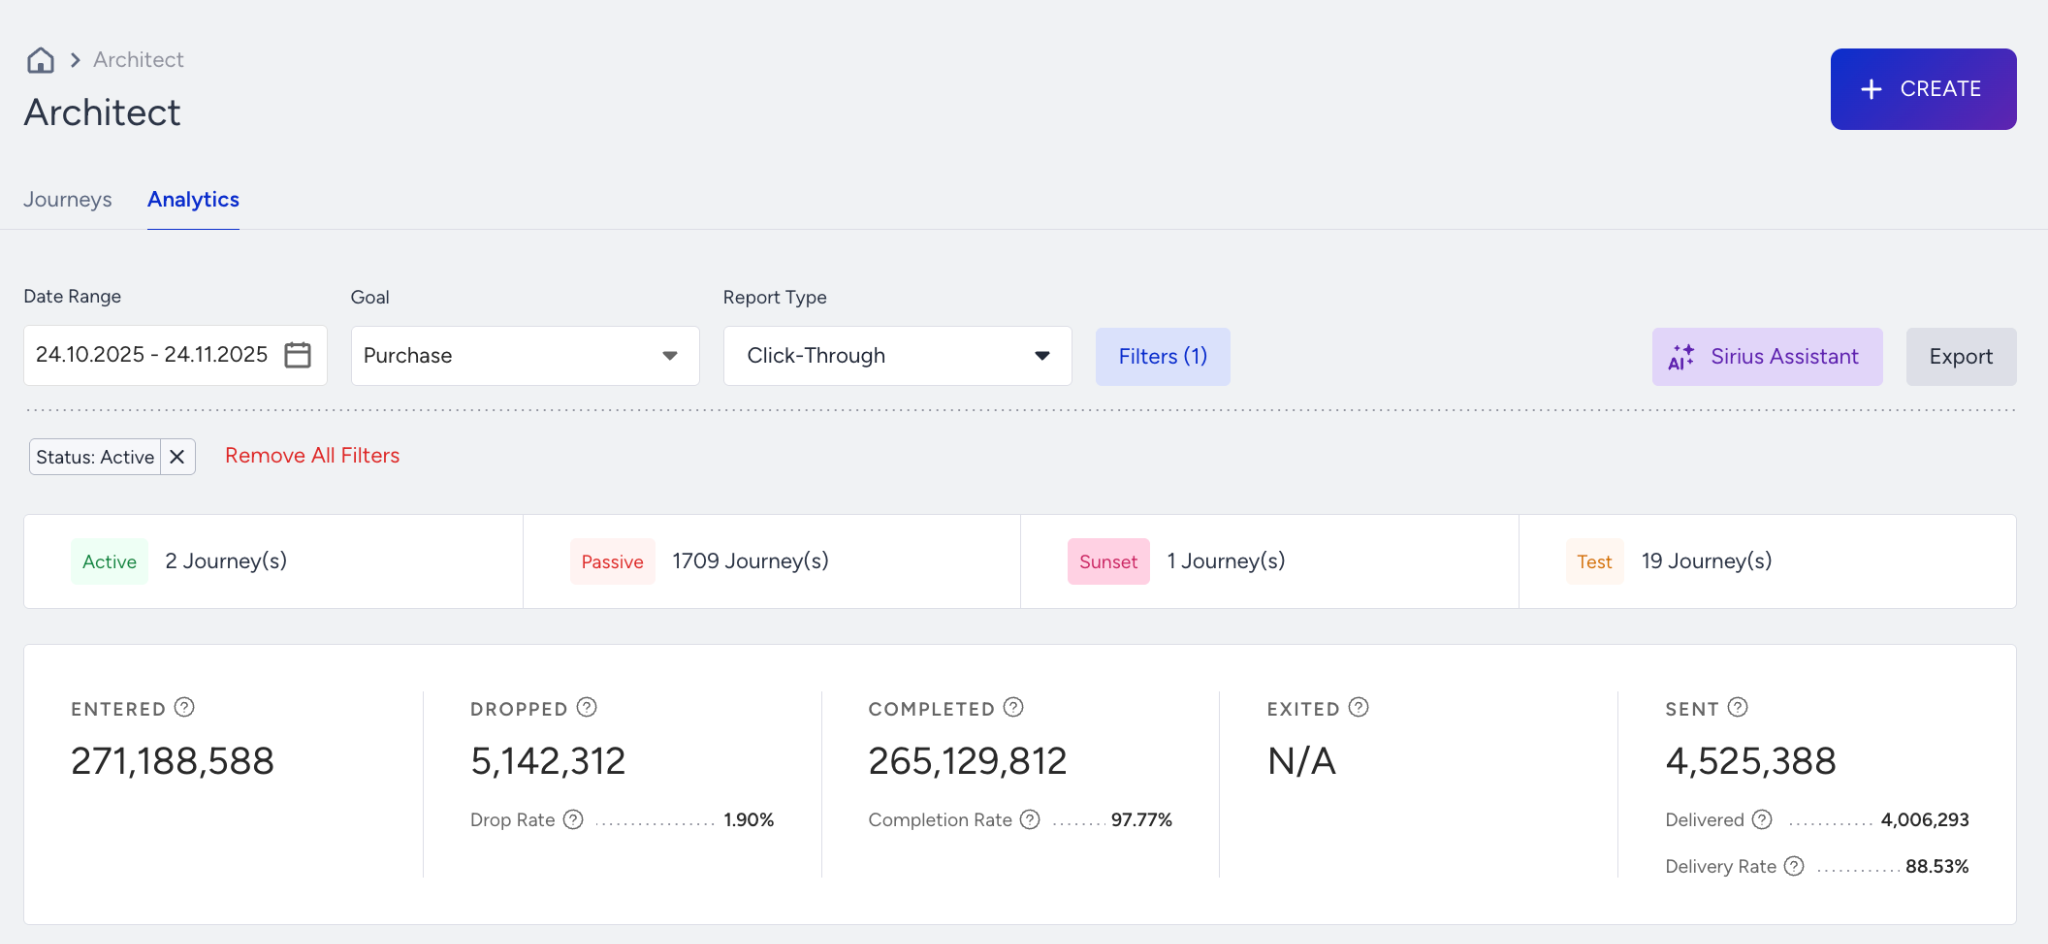
Where to find it: Architect Analytics Dashboard (Journey Performance)
Why it matters: Number of users entering a journey. Indicates how many users are eligible and how well triggers are configured.
What to watch for (decline / below benchmark): Very low entries vs expectations or vs previous periods.
Actions to take / features to use: Broaden entry rules, confirm events fire correctly, review audience filters, check that journey is Active and not suppressed by other flows.
Benchmarks / watch for: No fixed benchmark; compare vs traffic and your journey’s purpose.
Frequency: Daily / Weekly
Examples: Cart recovery journey shows only a handful of entries despite high cart creation volume → trigger event not mapped correctly.
Journey drop rate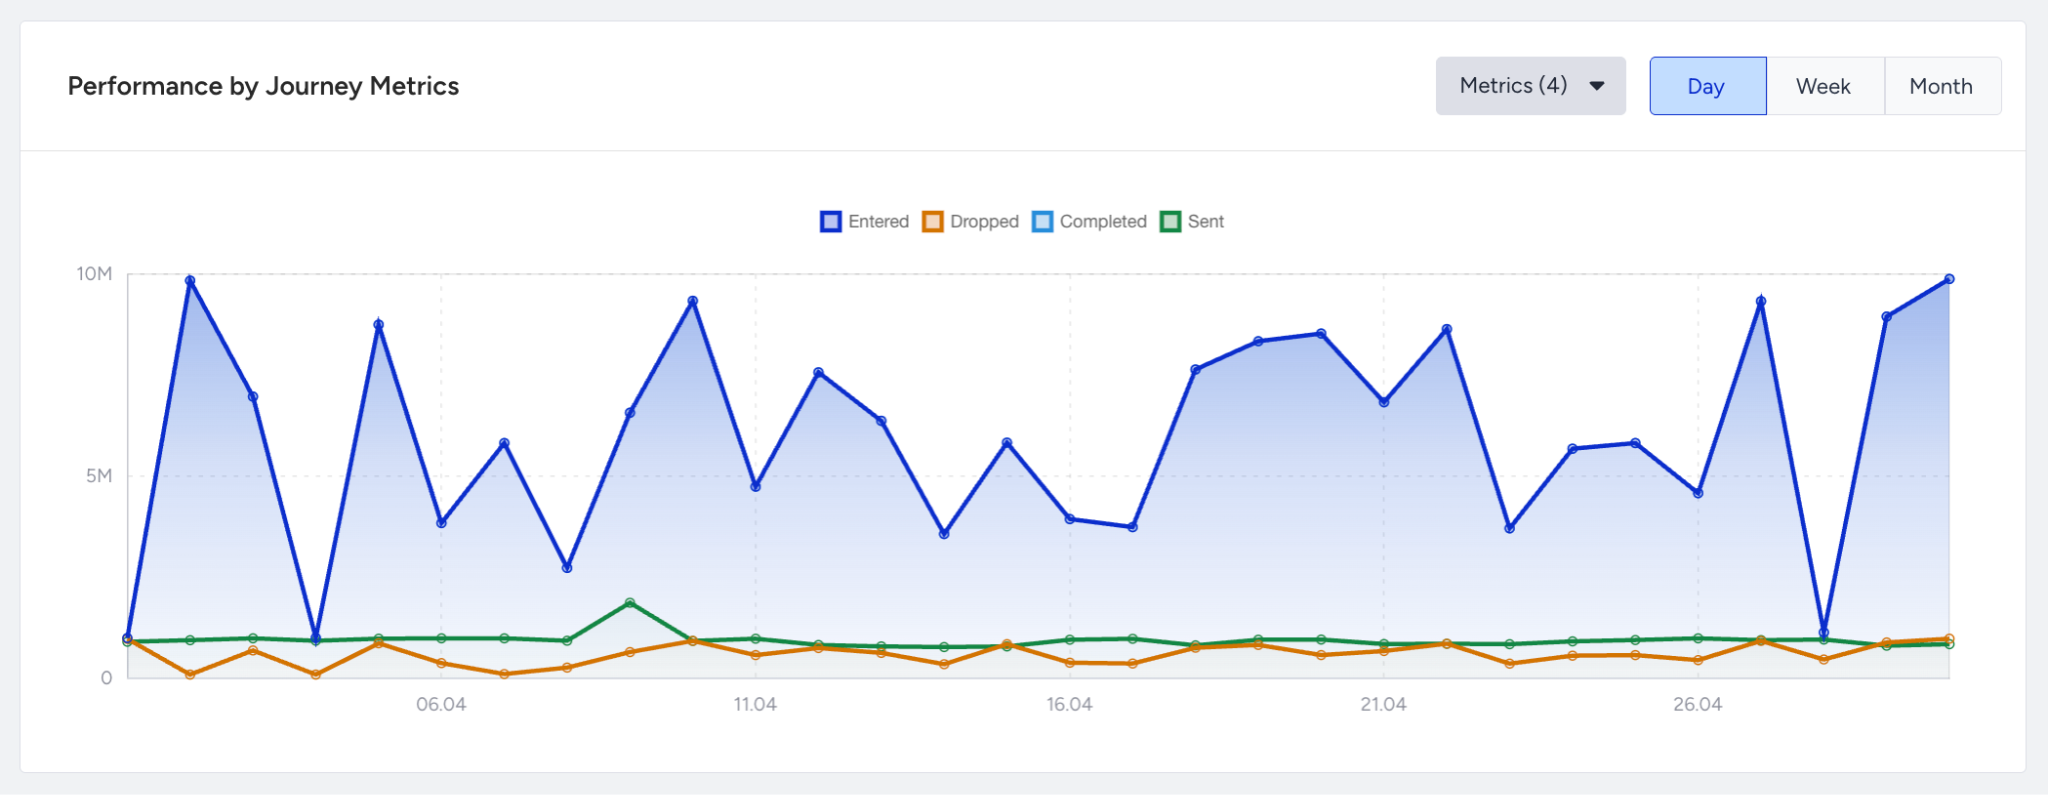
Where to find it: Architect Analytics Dashboard (Journey Performance)
Why it matters: % of users exiting the journey before reaching a key step or goal. Shows friction or misalignment in the flow.
What to watch for (decline / below benchmark): High drop rate around one or two specific steps.
Actions to take / features to use: Shorten flows, simplify branches, reduce waiting times, adjust conditions, ensure messages are relevant at that step.
Benchmarks / watch for: Watch for sudden spikes in drop rate after changes.
Frequency: Weekly
Examples: You add a long wait time and drop rate jumps at that node → shorten or move that wait.
Journey completion rate
Where to find it: Architect Analytics Dashboard (Journey Performance)
Why it matters: % of users reaching the defined journey end or goal. Indicates clarity and effectiveness of your flow.
What to watch for (decline / below benchmark): Low completion despite healthy entries, sends, and engagement.
Actions to take / features to use: Simplify journey logic, remove unnecessary steps, ensure required data exists, add fallback paths for missing data or eligibility.
Benchmarks / watch for: Aim for a stable or improving completion rate for key journeys.
Frequency: Weekly
Examples: Users enter an onboarding flow but only a small fraction reach the final step → too many branches or irrelevant steps.
User reachability
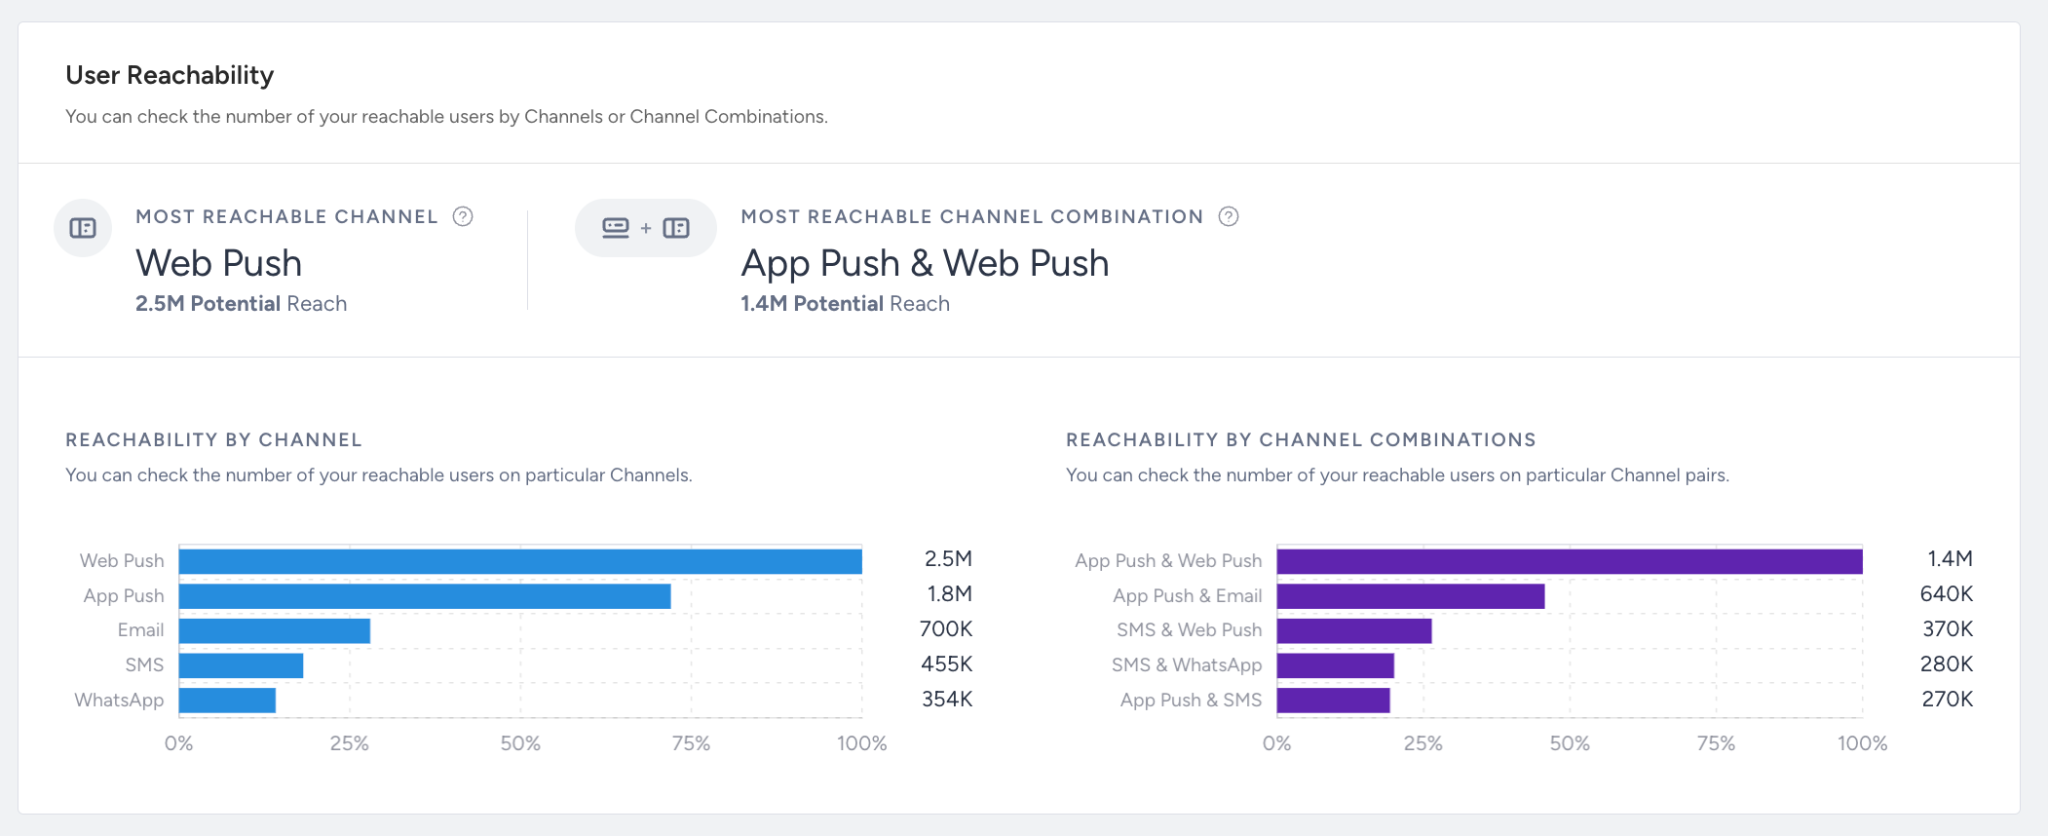
Where to find it: Architect Analytics Dashboard (Journey Performance)
Why it matters: % of users in the journey that can actually receive messages (email, SMS, WhatsApp, Push).
What to watch for (decline / below benchmark): Declining reachability, especially for specific channels.
Actions to take / features to use: Refresh consent and opt-ins, re-build lists with engaged users, fix push token issues, use Web Suite to collect new permissions.
Benchmarks / watch for: Try to maintain high reachability (varies by channel & region).
Frequency: Weekly
Examples: You see low reachability for push in a journey → many users don’t have tokens; add in-app or onsite prompts to collect them.
Journey sent
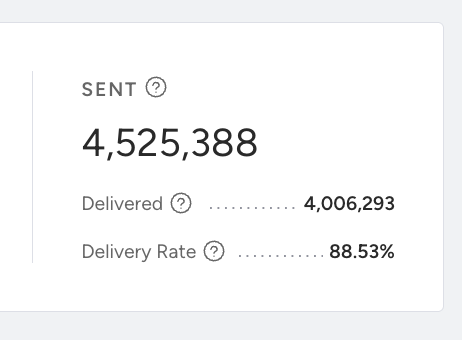
Where to find it: Architect Analytics Dashboard (Journey Performance)
Why it matters: Total number of messages sent across all steps in a journey. Helps you spot inactive branches or bottlenecks.
What to watch for (decline / below benchmark): Drop in message sends for a journey without planned changes.
Actions to take / features to use: Check if steps or branches are Paused, review step conditions, confirm that users aren’t getting filtered out by frequency, caps, or suppression lists.
Benchmarks / watch for: Compare Sent vs Entries to see if users are moving through as expected.
Frequency: Daily / Weekly
Examples: Entries are steady but messages sent drop sharply → a key branch was paused or a condition changed.
Click rate
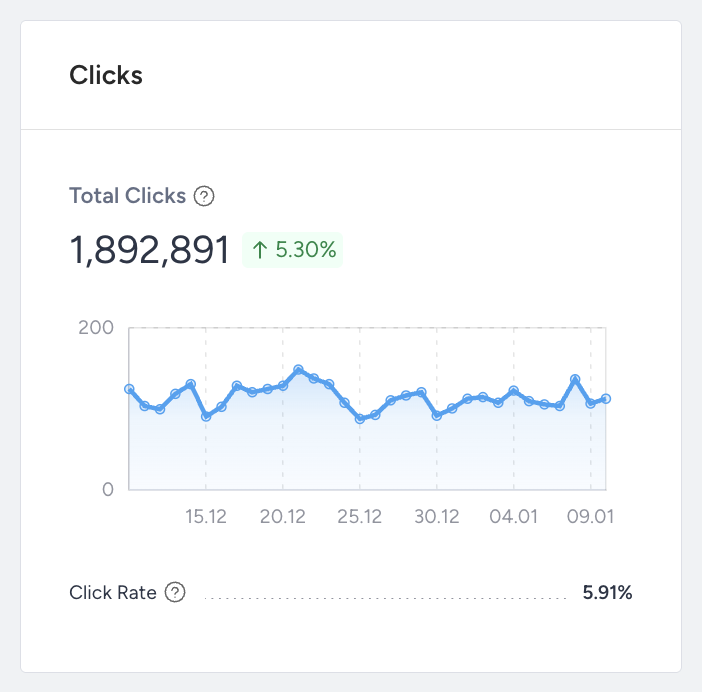
Where to find it: Architect Analytics Dashboard (Journey Performance)
Why it matters: % of messages clicked in the journey. Shows how compelling content and CTAs are at each step.
What to watch for (decline / below benchmark): CTR below your usual email/SMS/push benchmarks or sudden drop after content changes.
Actions to take / features to use: A/B test copy, visuals, timing, personalize content, refine targeting by behavior, test different CTAs and formats.
Benchmarks / watch for: Compare CTR per channel vs that same channel outside Architect campaigns.
Frequency: Weekly
Examples: A reminder step in the journey has much lower CTR than previous steps → rewrite message or change timing.
Conversion rate
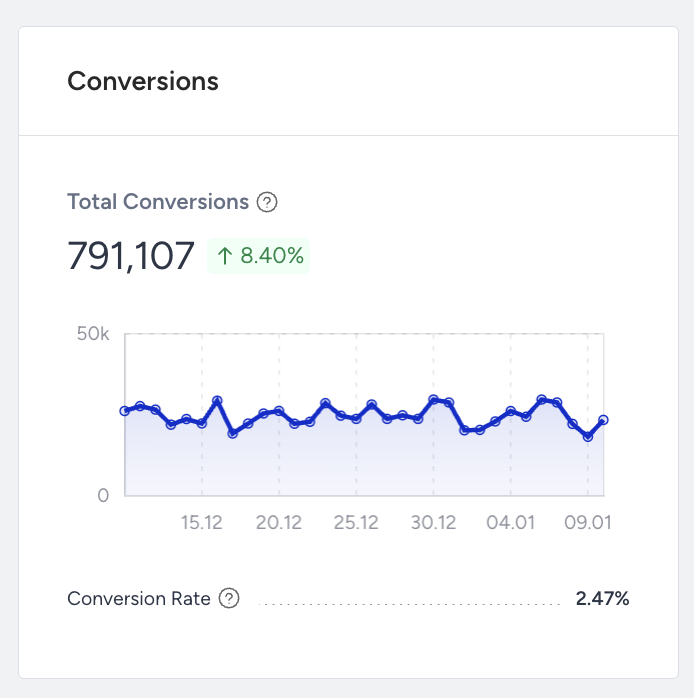
Where to find it: Architect Analytics Dashboard (Journey Performance)
Why it matters: % of users who complete the defined conversion goal after the journey or specific steps. Direct measure of journey effectiveness.
What to watch for (decline / below benchmark): Low conversion despite good sends and CTR.
Actions to take / features to use: Improve landing pages, reduce funnel friction, target higher-intent segments, adjust trigger timing to be closer to the decision moment.
Benchmarks / watch for: Track per-journey conversion and compare across similar use cases.
Frequency: Weekly
Examples: A winback journey gets good clicks but few conversions → offer not strong enough or landing page doesn’t match expectation.
Drop rate
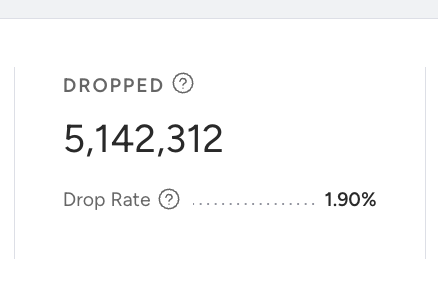
Where to find it: Live Statistics
Why it matters: % of users exiting at a specific step. Pinpoints exactly where users lose interest or fail eligibility.
What to watch for (decline / below benchmark): Sharp spike at one step vs others.
Actions to take / features to use: Fix branching logic, shorten waits, add fallback options, simplify message content, ensure required data is present before that step.
Benchmarks / watch for: Look for smooth step progression without big drop cliffs.
Frequency: Weekly
Examples: Most users exit at a segment-split node → condition too strict or data not available.
If you want, the next step could be to combine Email + App + Architect into a single, structured CRM performance playbook.
If a number doesn’t change immediately, expand the date range or compare with the previous period to validate performance trends.
Once you know what “good” looks like and how to read your numbers, the next step is making sure your foundation is solid.
Use this checklist to confirm that Architect is set up correctly before you chase more complex optimizations.
Health checklist: Architect success to-do list
Run through these checks monthly or whenever performance shifts unexpectedly. A small misconfiguration can easily turn into a big performance drop.
Integration & data health
Validate event and attribute tracking.
Test API, webhook, and tag integrations.
Check reachability and opt-in compliance.
Feature & campaigns
Launch high-impact journey templates.
Use personalization and dynamic content.
Test and review journeys before launch.
Optimize conversion & revenue
A/B test triggers, content, and timing.
Monitor entries, completions, and conversion rates.
Adjust frequency and targeting as needed.
Reduce drop-off & churn
Use win-back and feedback journeys.
Monitor drop and opt-out trends.
If something still doesn’t look right after you’ve reviewed the basics, it’s time to troubleshoot.
Here are common cases you might see in your analytics, along with practical steps you can take to resolve them.
Troubleshooting cases
Use this section when you notice a specific issue, like drops in engagement, revenue, or reach, and want a focused path to investigate and fix it.
Once you’ve stabilized performance and fixed the obvious issues, you’re ready to go beyond “working” to “working really well.”
These best practices and tips are designed to help you get more value from Architect with the same or less effort.
Best practices & pro tips
You don’t need to adopt every tip at once. Treat this section as an idea bank and apply ideas that match your goals and capacity.
Map the customer journey and identify key moments for automation.
Segment users by behavior, lifecycle, and value for relevance.
Personalize with dynamic content to boost engagement.
Use multi-channel orchestration for seamless experiences.
Keep journeys simple (under 100 elements).
Set clear goals and KPIs for every journey.
Monitor drop-off points and optimize.
Experimentation drives results. Use A/B Split and Control Group features to measure accurately and prove what works.
Set frequency caps: Prevent overexposure and reduce opt-outs.
Compliance as a growth enabler: Always include opt-out options, honor preferences, and follow platform guidelines.
Unlock deeper insights with Sirius Assistant, your built-in AI analytics agent.
As you apply these ideas, you’ll likely run into the same recurring questions we hear from other teams.
FAQ & troubleshooting
This FAQ covers the most common topics so you don’t have to guess.
Q: Why aren’t our journeys triggering as expected?
A: Check event and attribute tracking, integration steps, entry conditions, and opt-in compliance.
Q: How can we test our journey before launching?
A: Use Test Journey, Test Message (per channel), and Dry Run. Refer to Journey Testing Guide for further details.
Q: How do we stay compliant with journey regulations?
A: Use compliance-approved templates, collect opt-in consent, include opt-out instructions, and follow platform/privacy standards.
Q: How do we escalate a technical issue?
A: Gather logs/screenshots, confirm checklist items, and submit via Insider One Help Center.
Additional resources
Use the resources below to continue learning, test more advanced strategies, or get extra help when you need it.
Bookmark this guide and revisit it whenever you launch new campaigns, review performance, or plan your next quarter with Architect.
Save and return to this guide as needed. For inspiration across all Insider channels, explore the Use Case Library. This resource is best for gathering ideas, not for replacing strategic planning.