When you are at the A/B split element on the canvas, you can click the Go to A/B Split Analytics button on the element to see the analytics of this channel.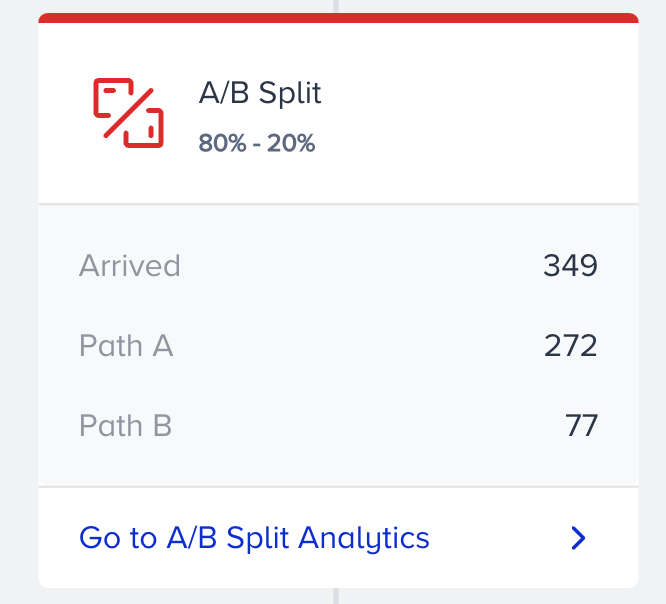
A/B split analytics enable you to:
- See which path performs better.
- See which content results better.
- See which channel order performs better.
To filter the A/B split stats, you can;
- Select Conversions, Conversion Rate, Total Opens/Clicks, or Revenue to evaluate your A/B split metrics using the dropdown on the top left corner of the page.
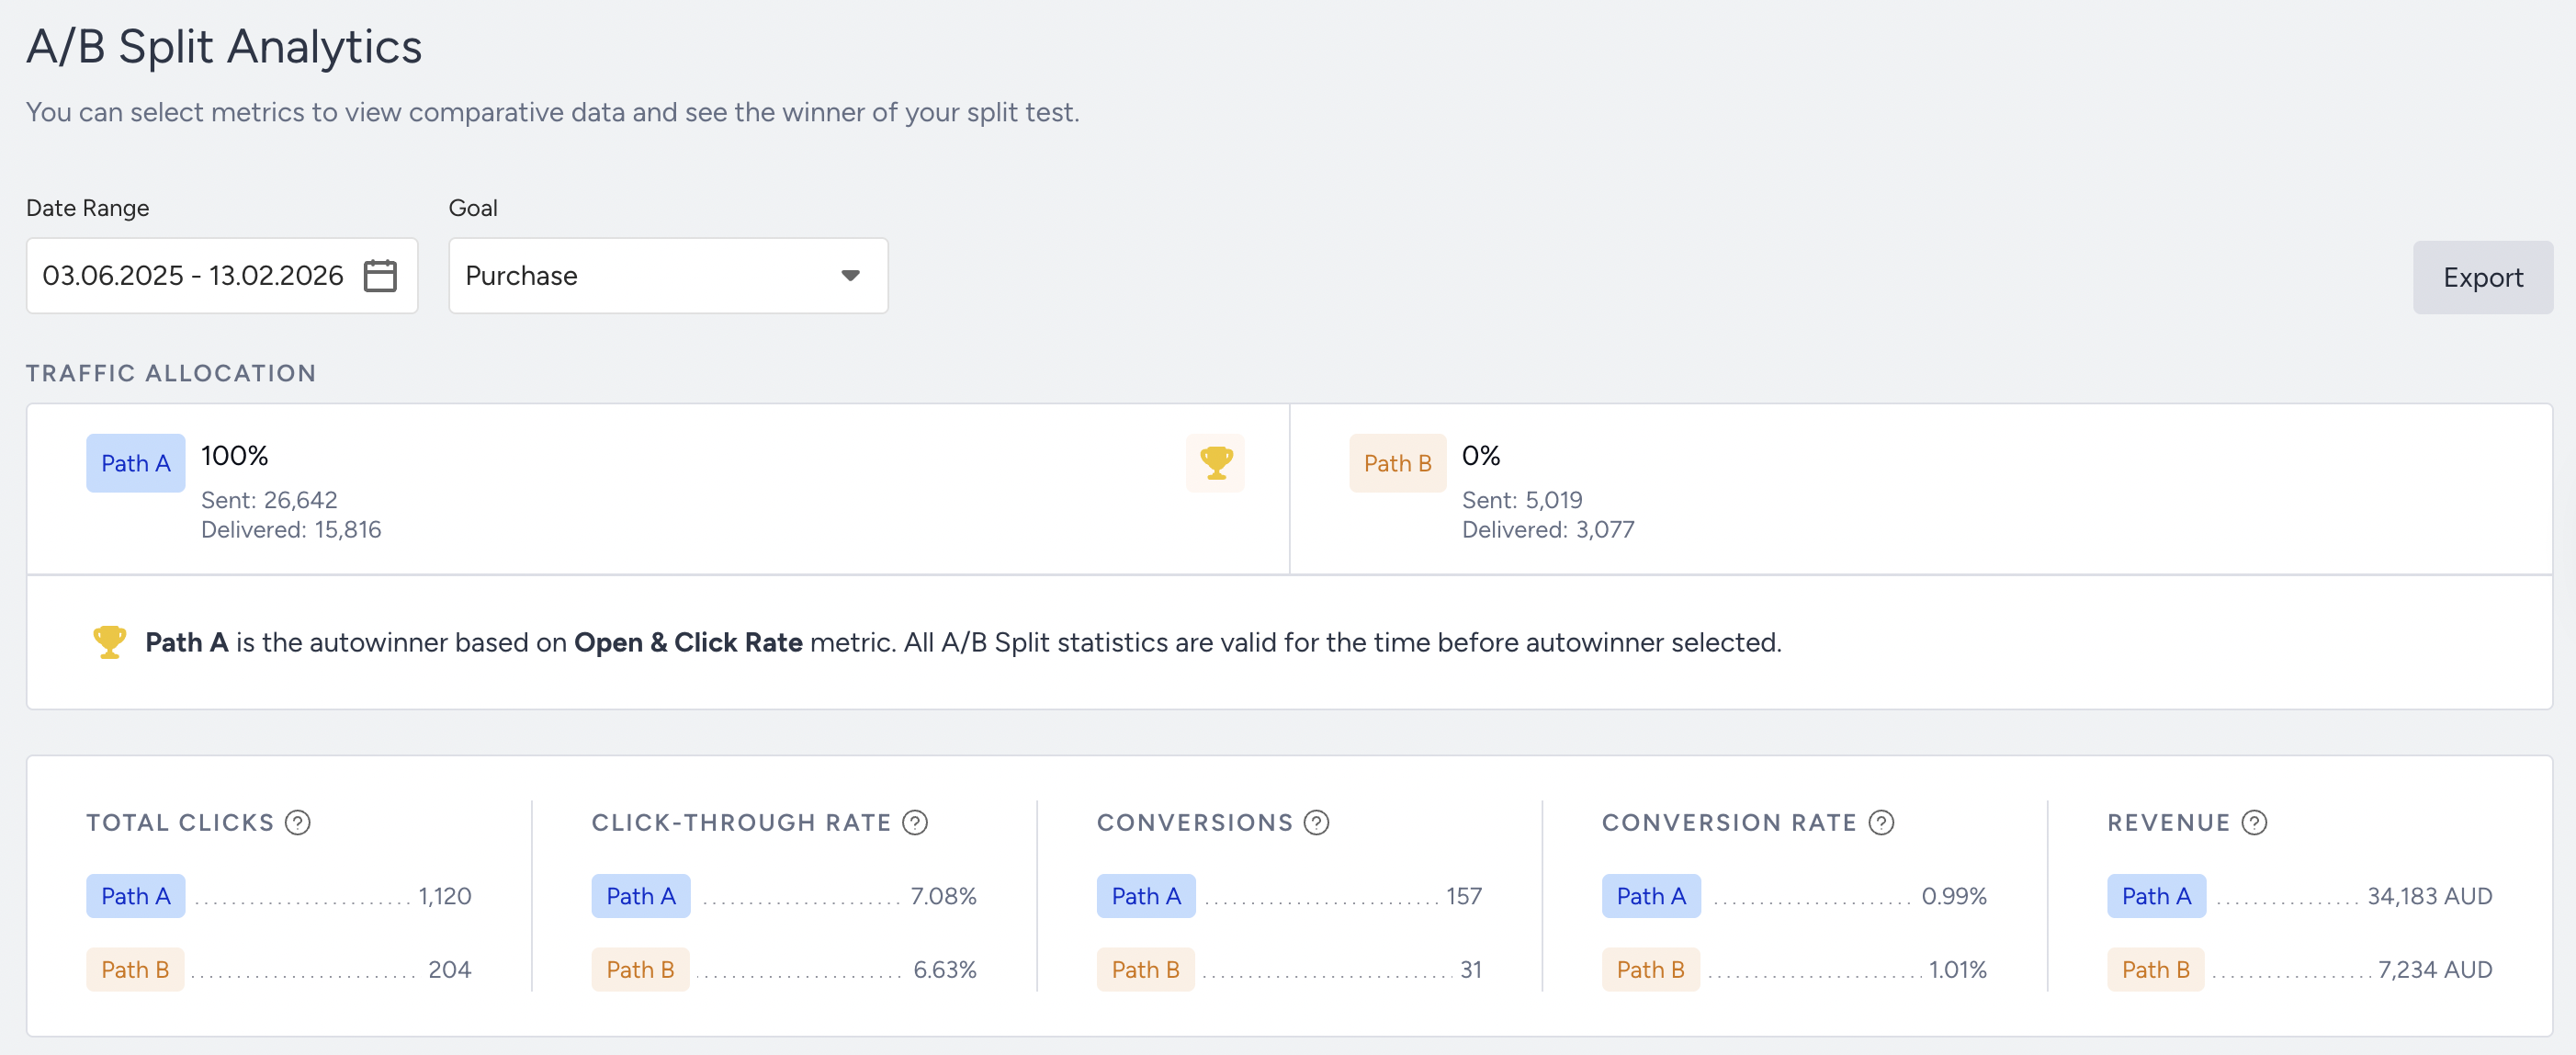
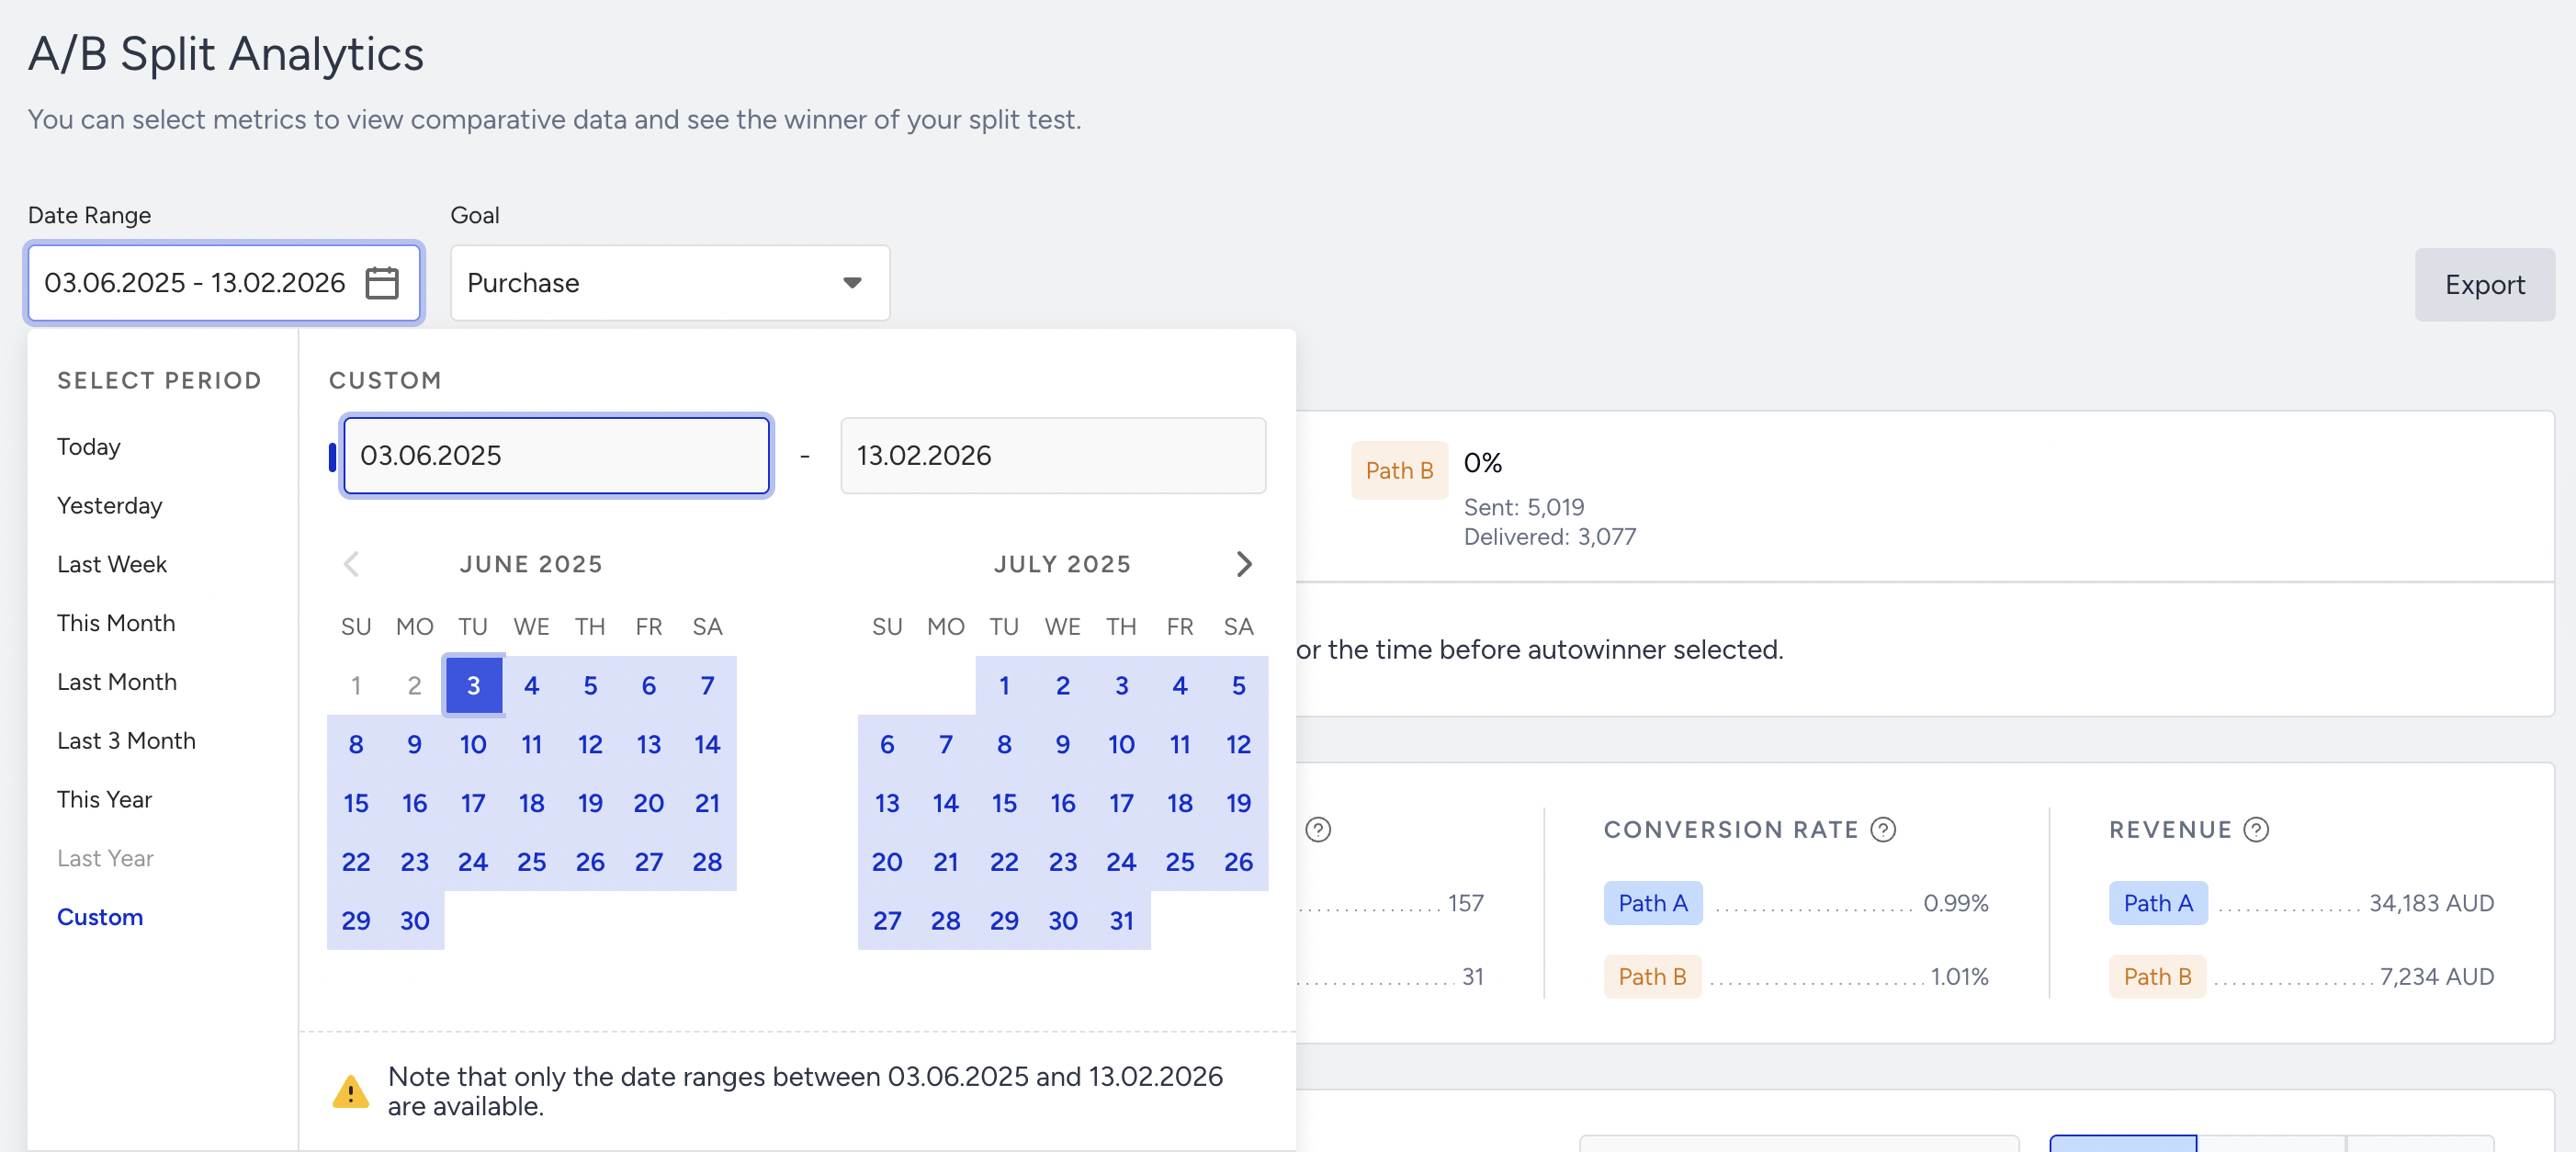
- Select a time range using the date picker on the top right corner of the page.
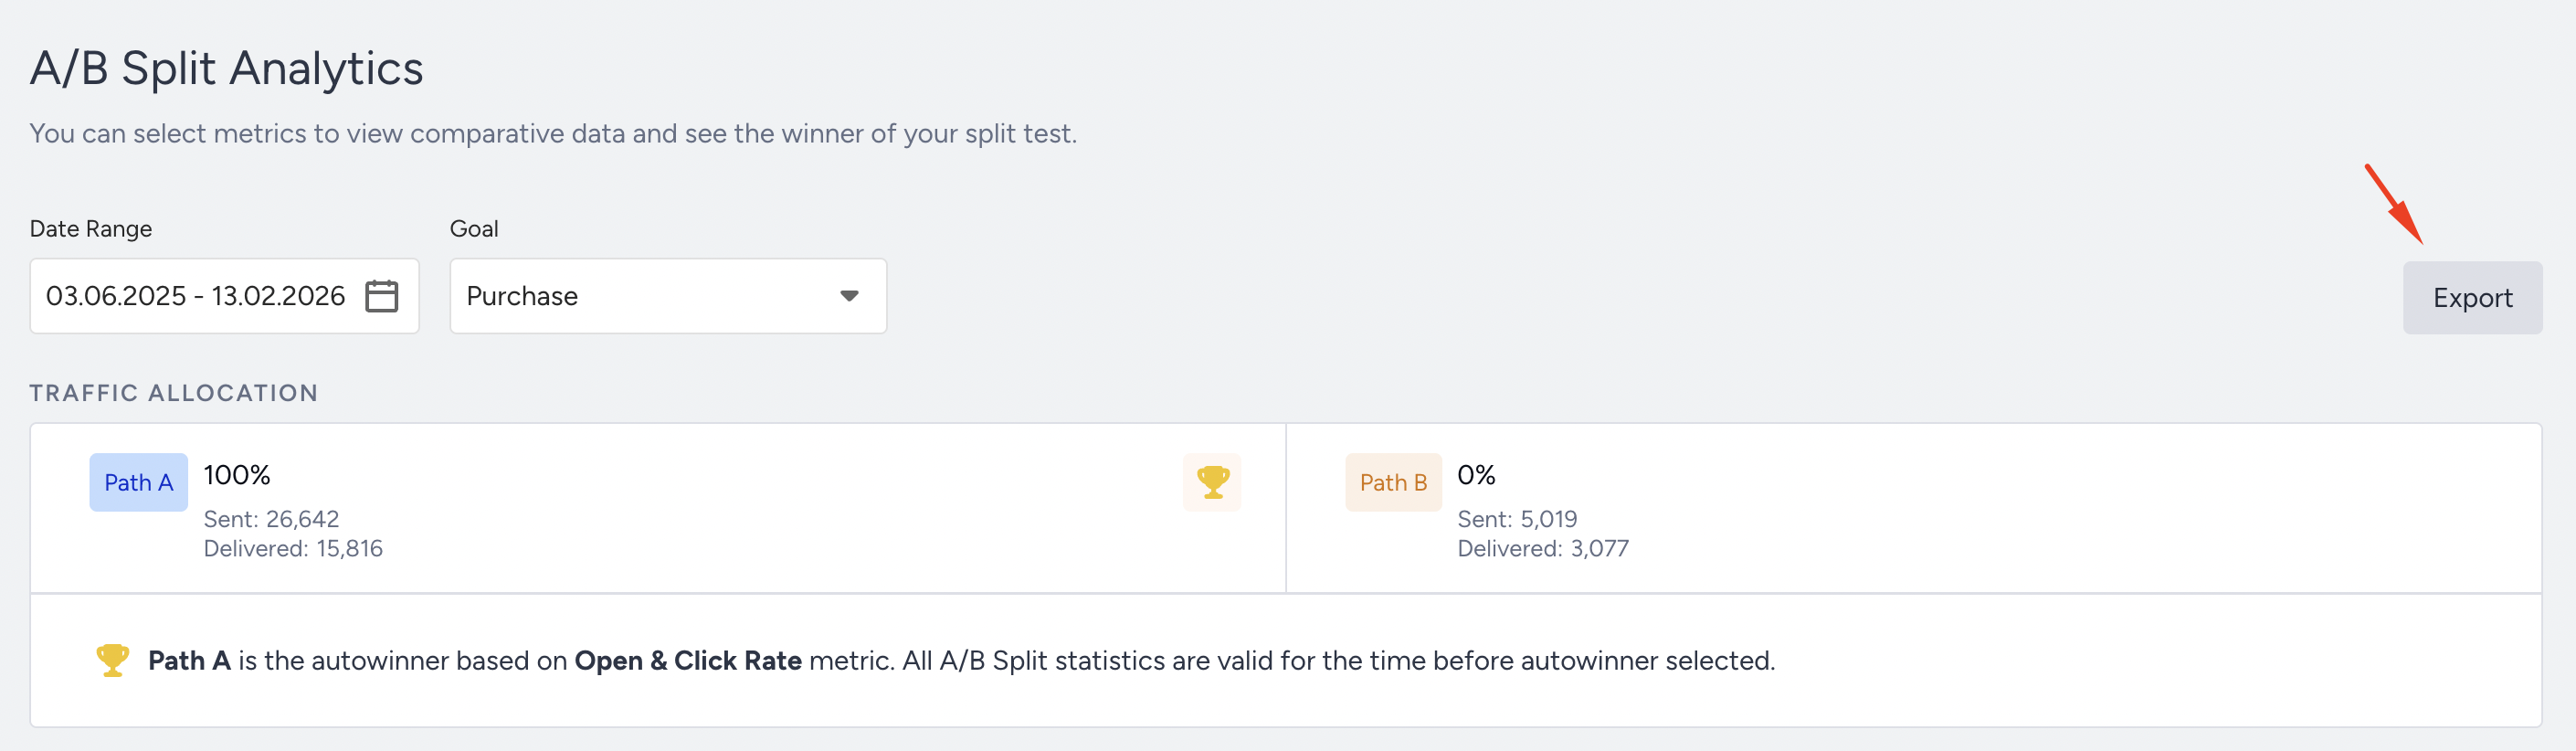
You can also export your report in Excel by clicking the Export button.
Narrowing down your results, you can view the results for each path based on one of the following metrics, and a summary of the results. For example, if path A has a conversion rate of 25% and path B of 33%, it would say "Path B has more Conversion Rate than others".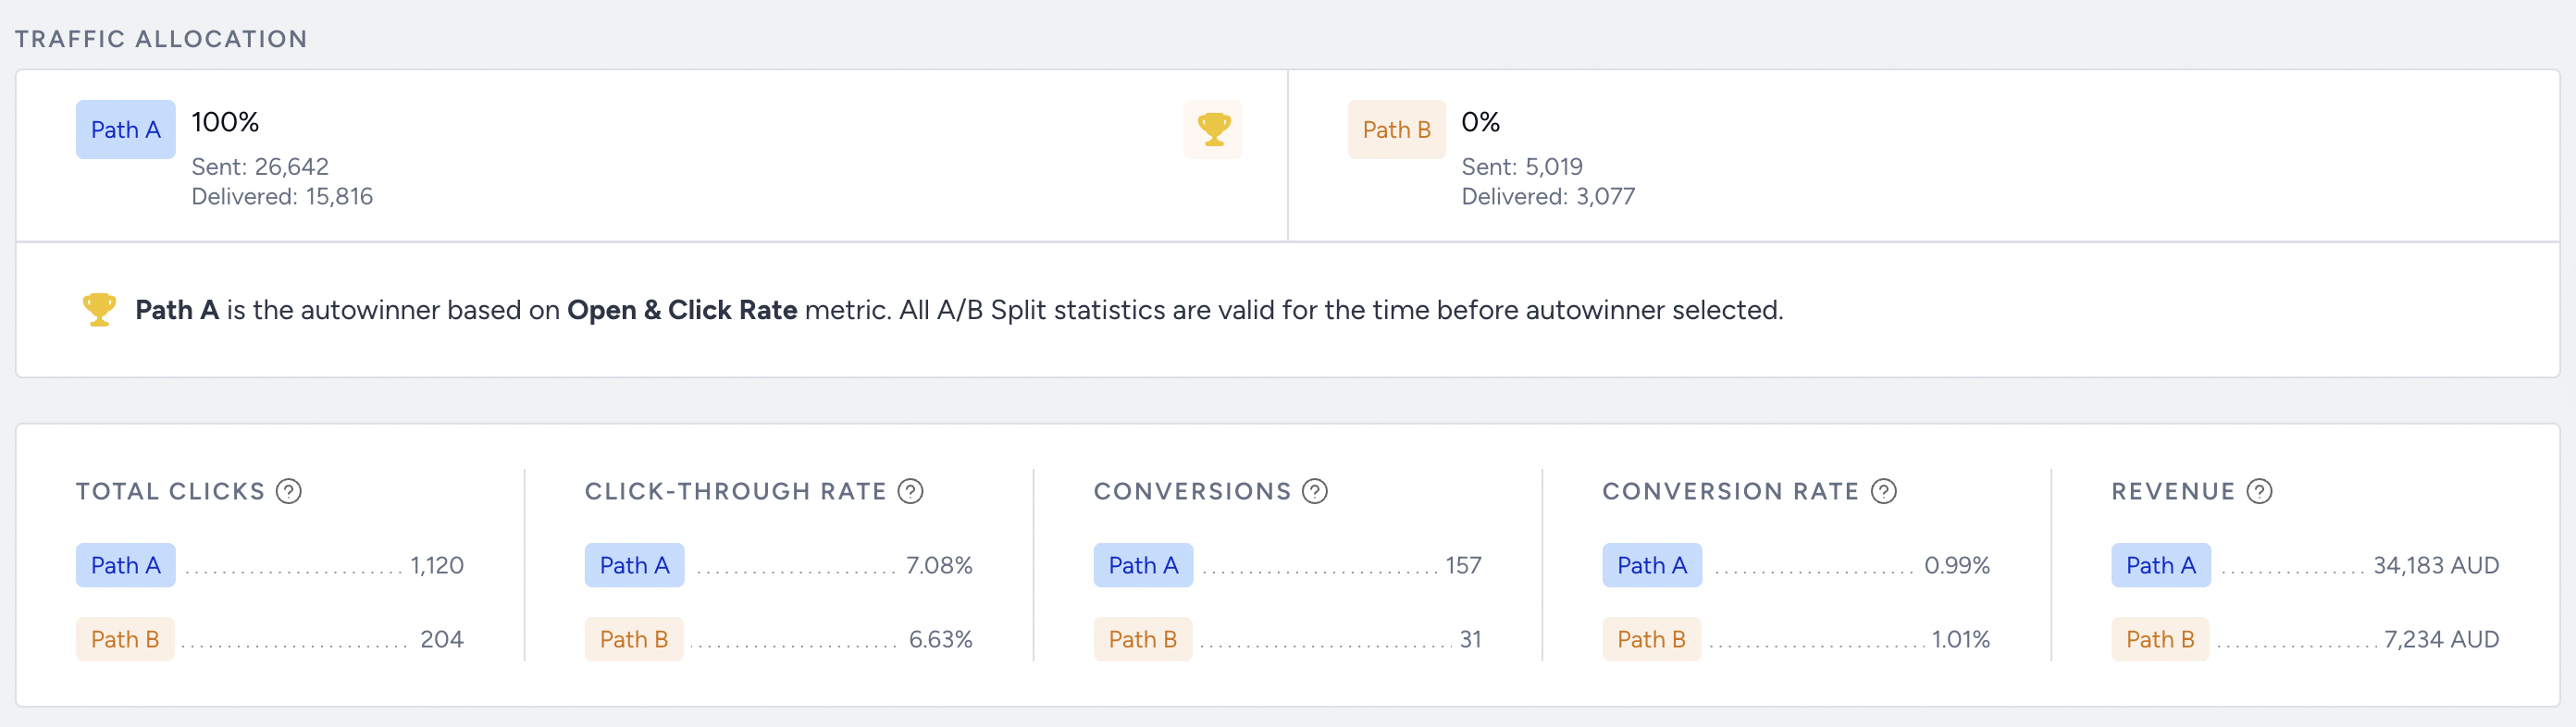
The chart section displays the daily, weekly, or monthly details on a line chart based on your time range selection and the metric you can select using the dropdown on the top left corner of this section. You can also choose Conversions, Conversion Rate, Total Opens/Clicks, Open & Click Rate, or Revenue.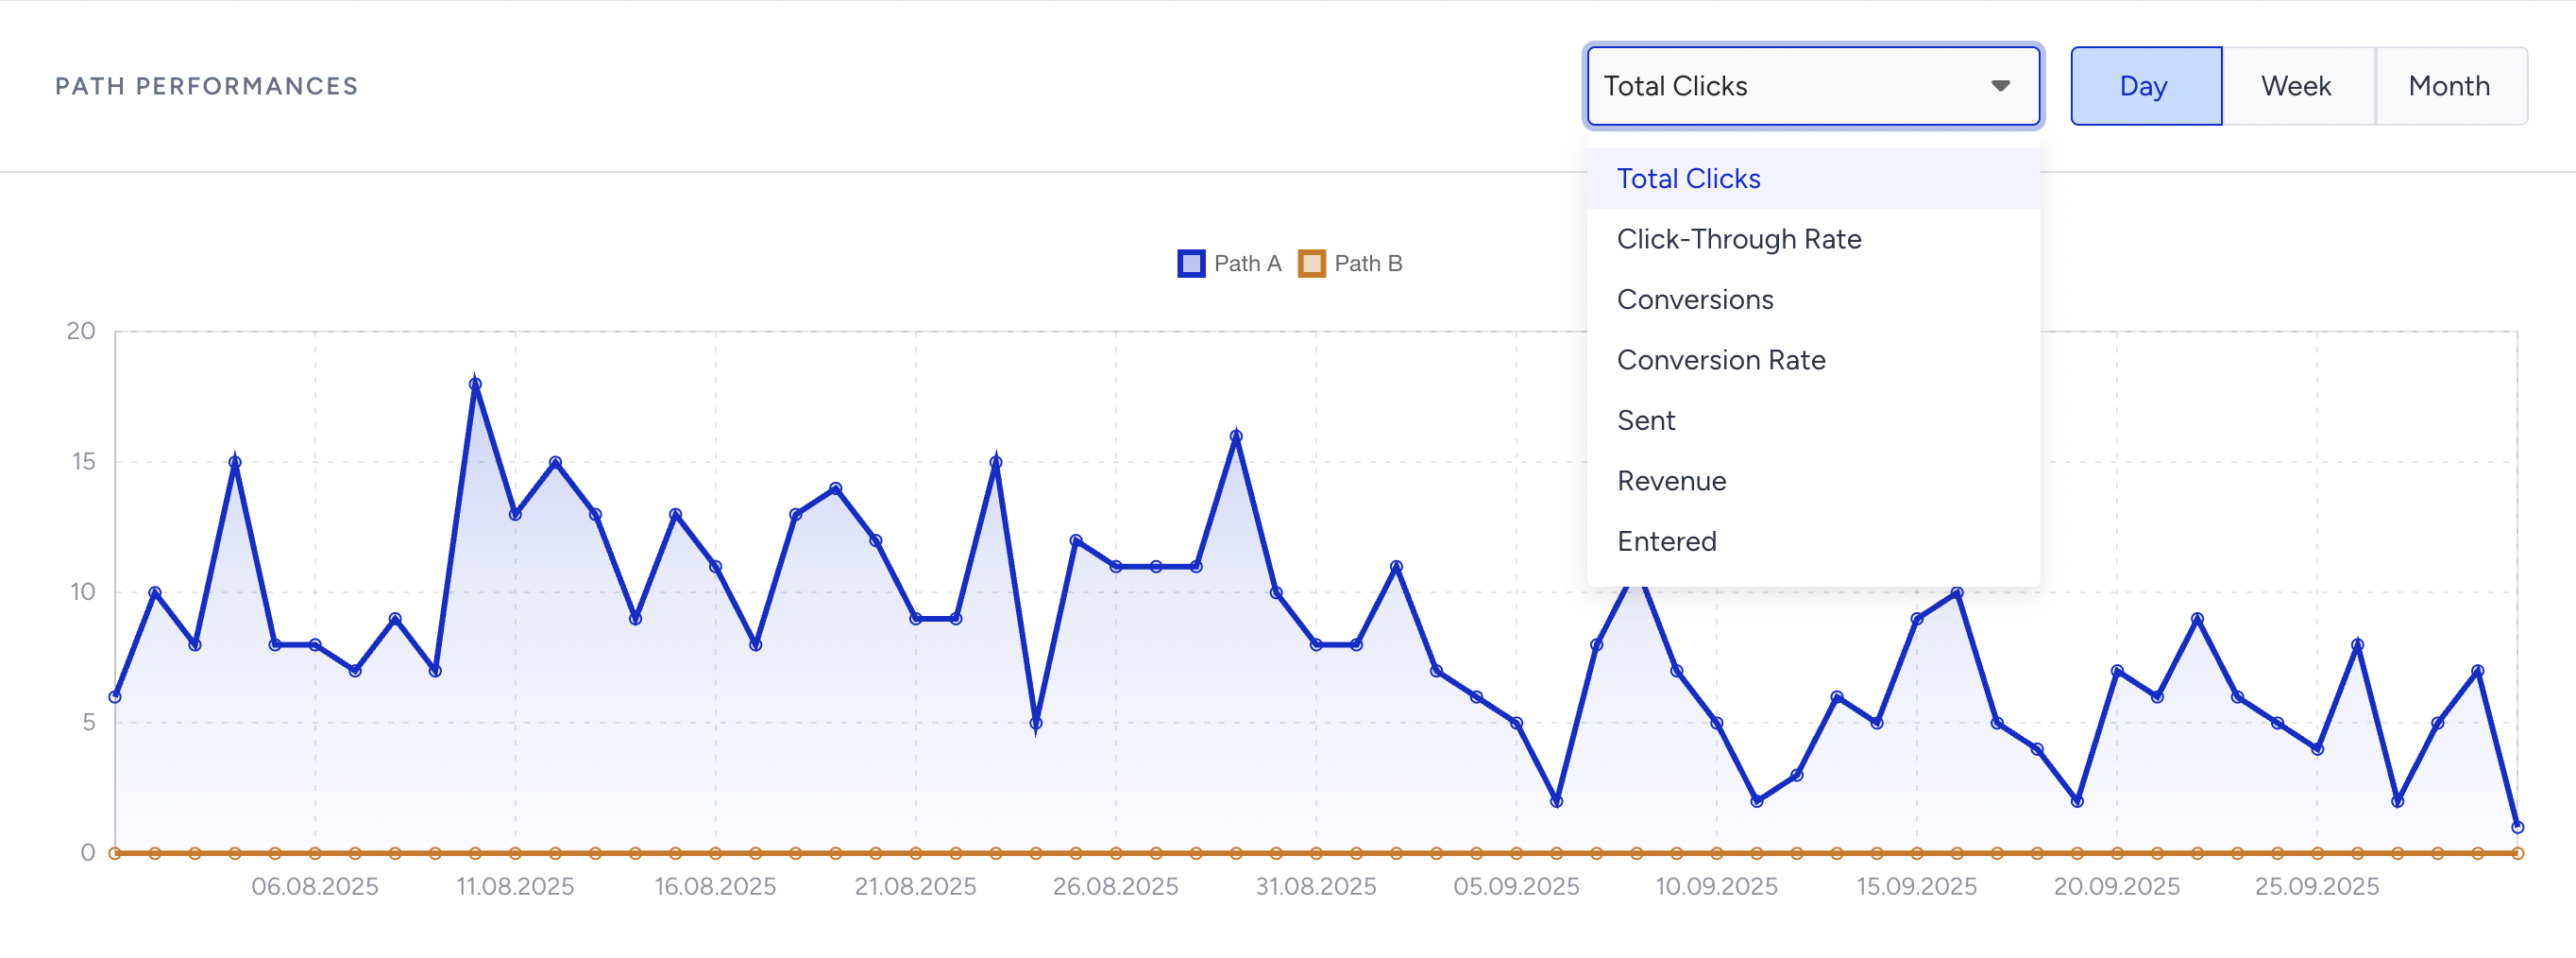
- Conversions: Total number of channel conversions for paths A and B.
- Conversion Rate: Average value of channel conversion rate for paths A and B.
- Total Opens/Clicks: Total number of channel opens/clicks for paths A and B.
- Revenue: Total channel revenue for paths A and B.
Examples of reconnected paths:
Below, paths A and B are connected at the bottom so that the calculation will consider this connection point as the end of both paths.
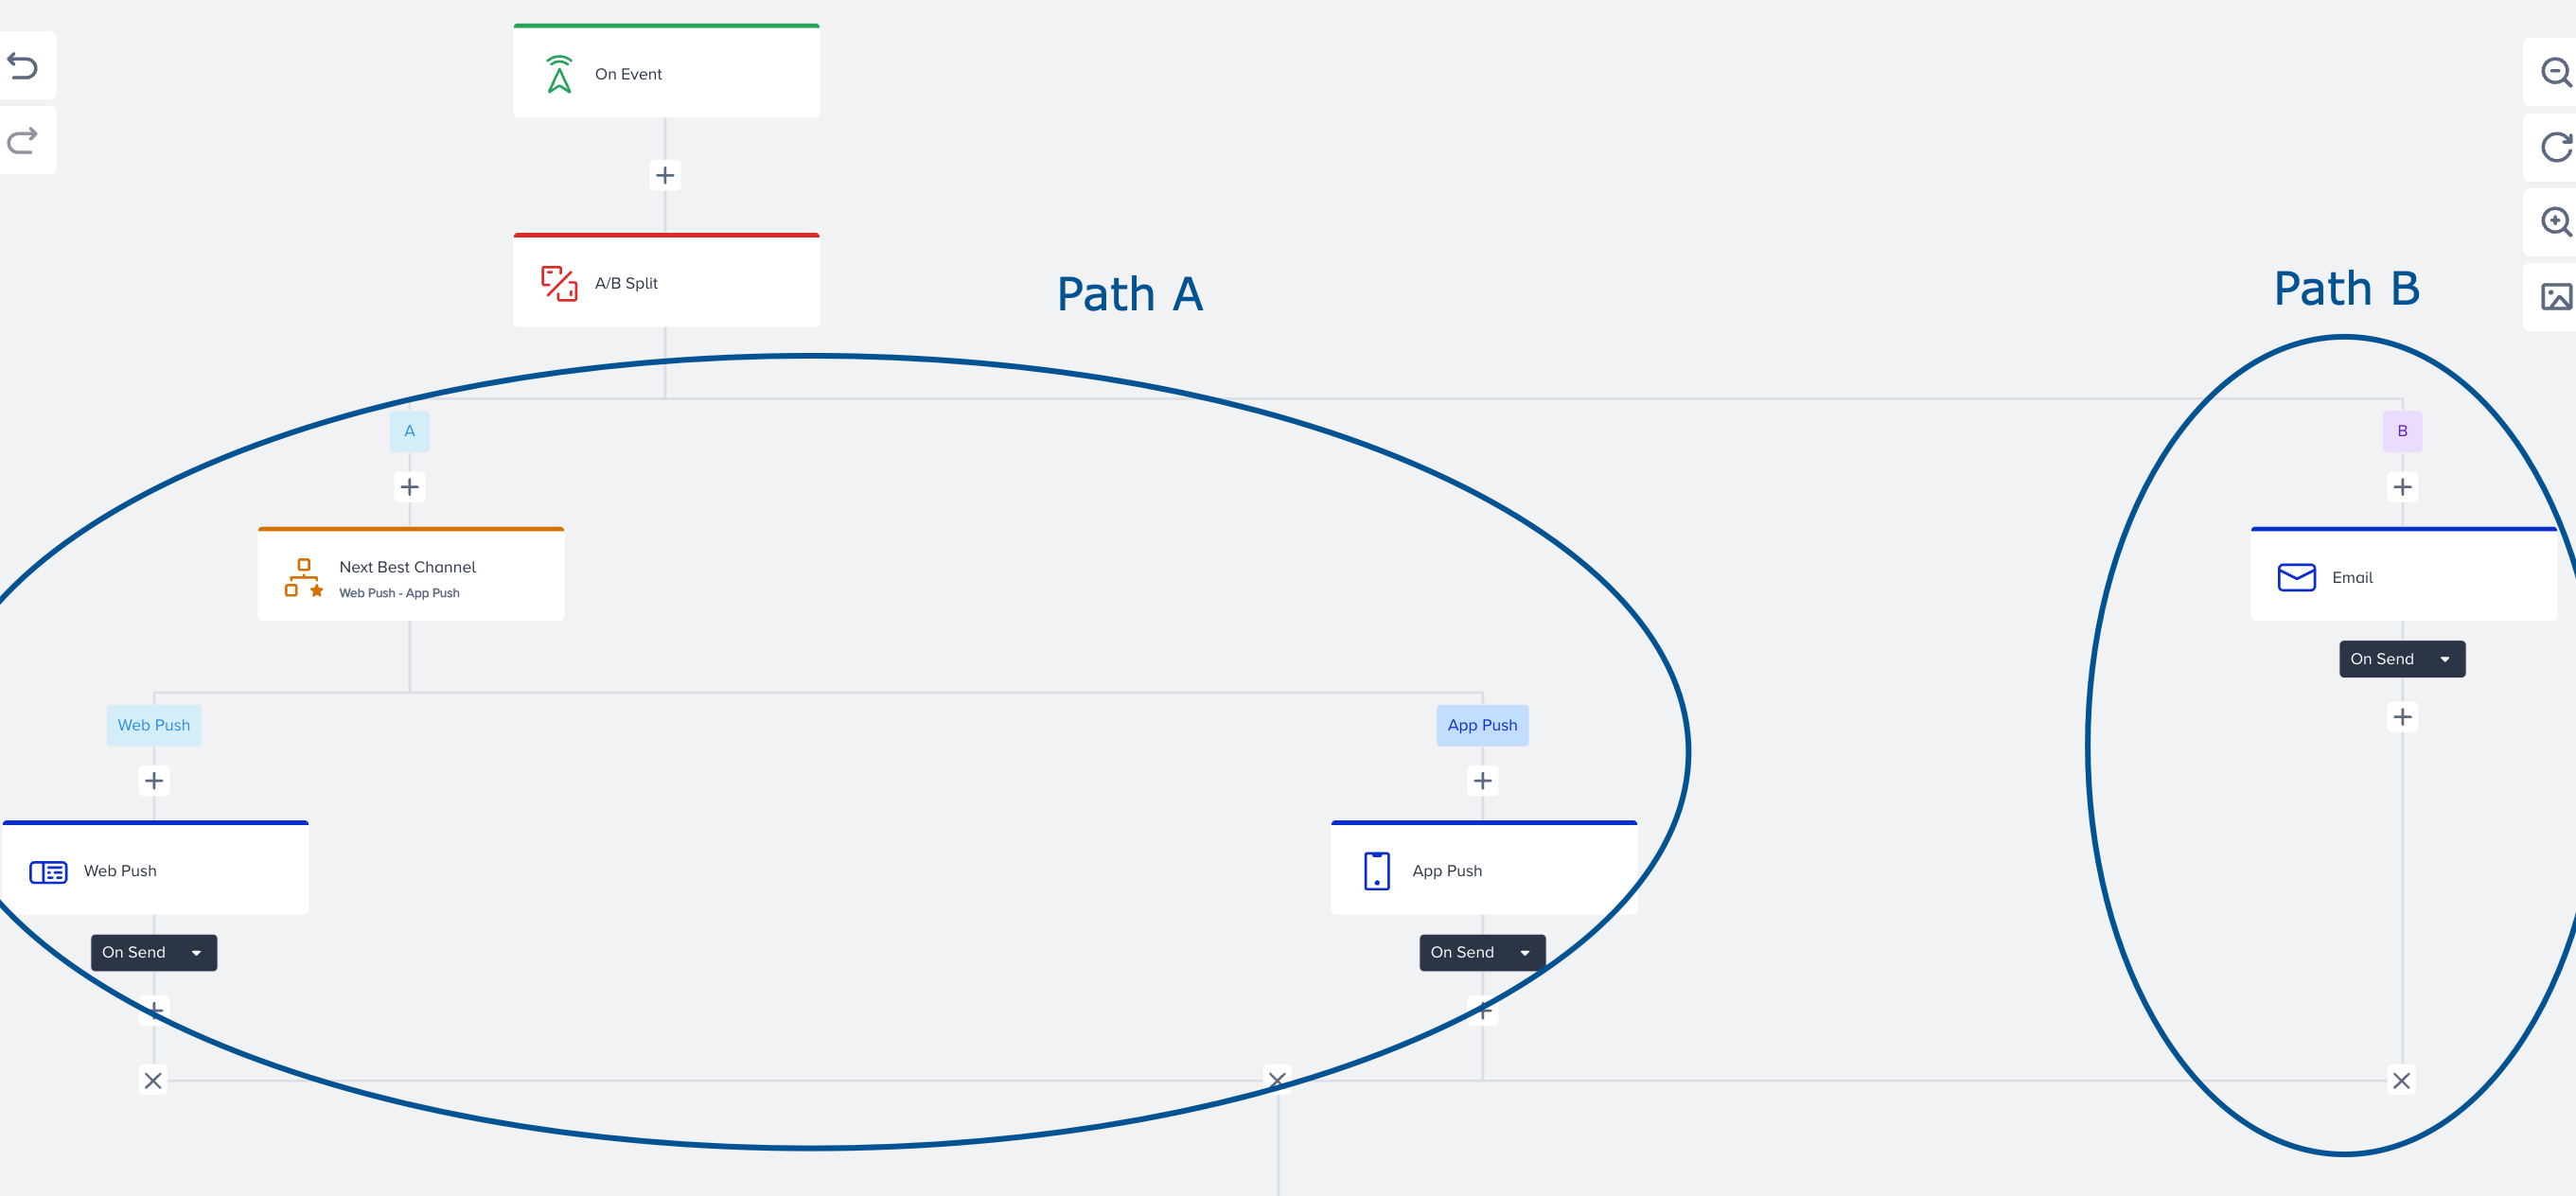
In this example, paths A and B are reconnected at the bottom left side. However, path B has another branch that goes further. The calculation will consider the left side of path B, which is connected with path A, and the right side of path B, which keeps flowing without connection as the same path.

Read more on Reconnect Journey Paths.
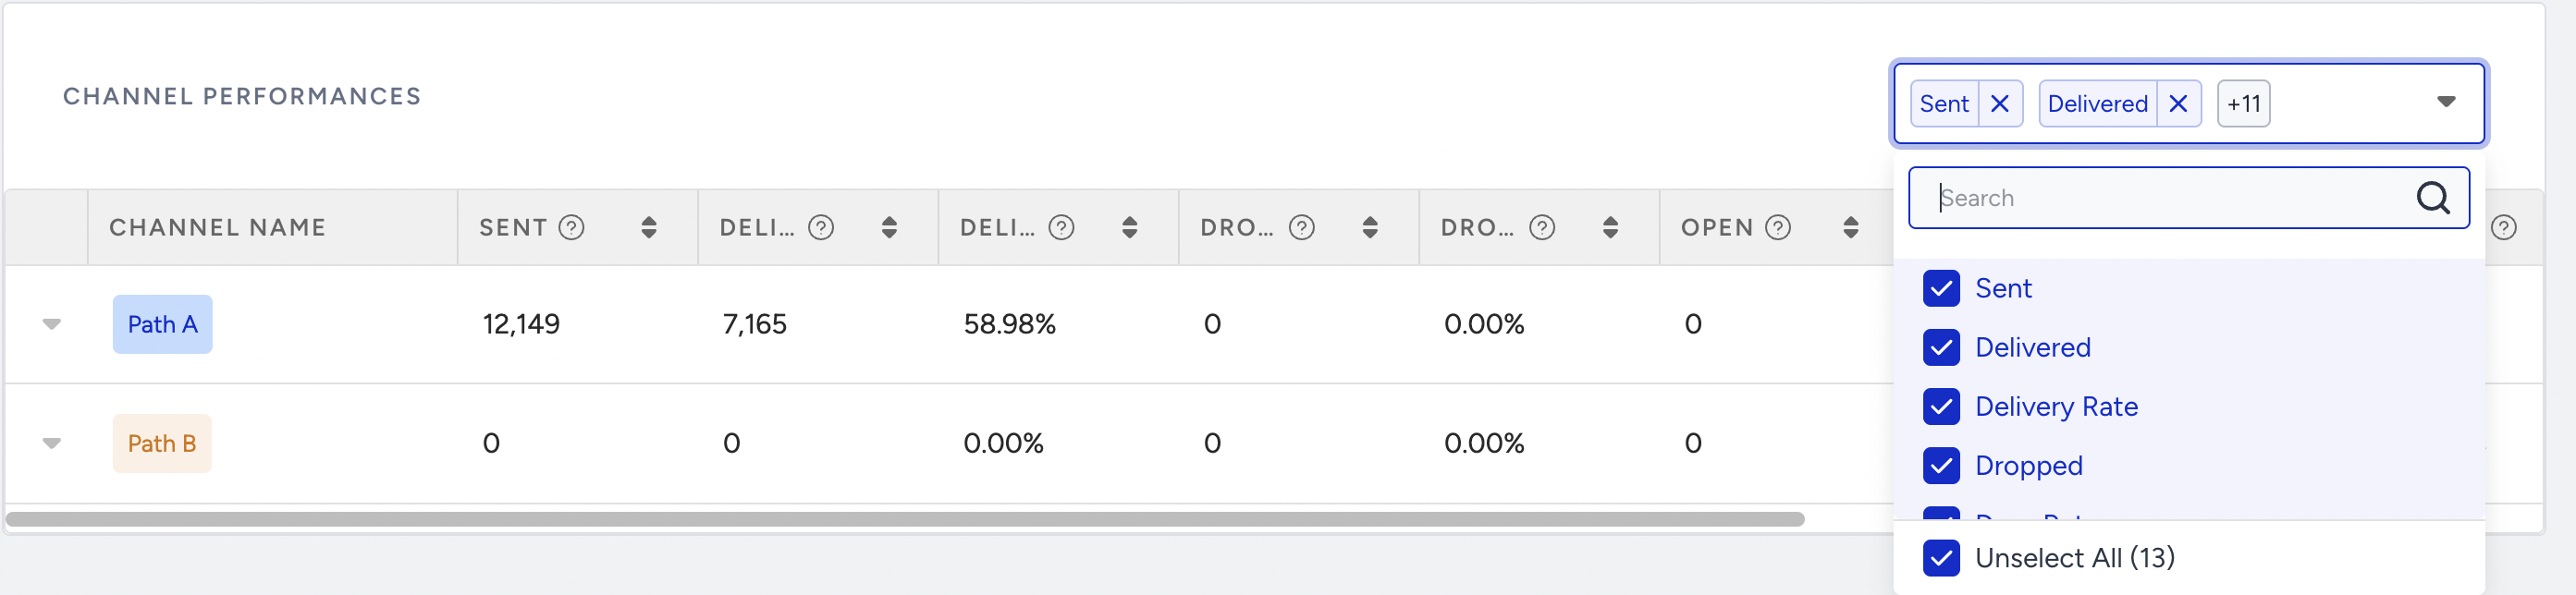
In the Channel Performances by Path chart, you can select Total Clicks, Click-Through Rate, Conversions, Conversion Rate, Sent, Revenue, and Entered.
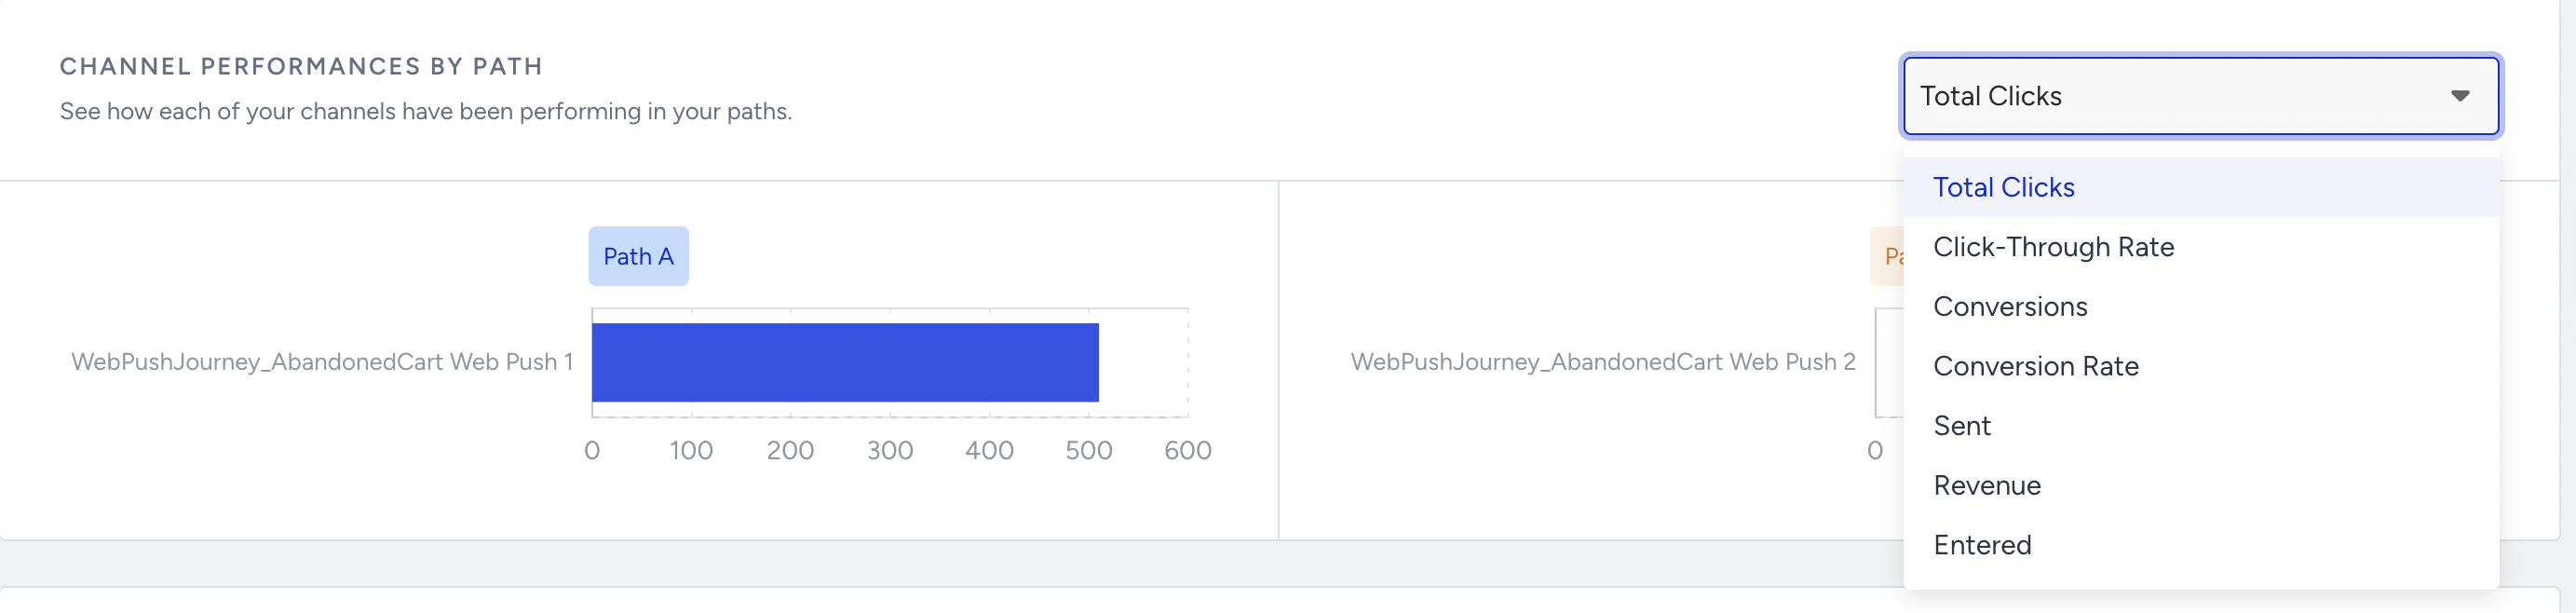
Landing on the Channel Performances section, you can filter the results based on the paths and metrics.
If A/B Winner Autoselection is activated inside the A/B Split element, results are reflected on the A/B Split element analytics based on the selected metric. You can see the winner path with the green Autowinner tag on the path metrics.