When you are at the Call an API element on the canvas, you can click the Go to Call an API Analytics button on the element to see the analytics of this channel..png)
To filter the Call an API metrics, use the date picker at the top right corner of the page to select a time range.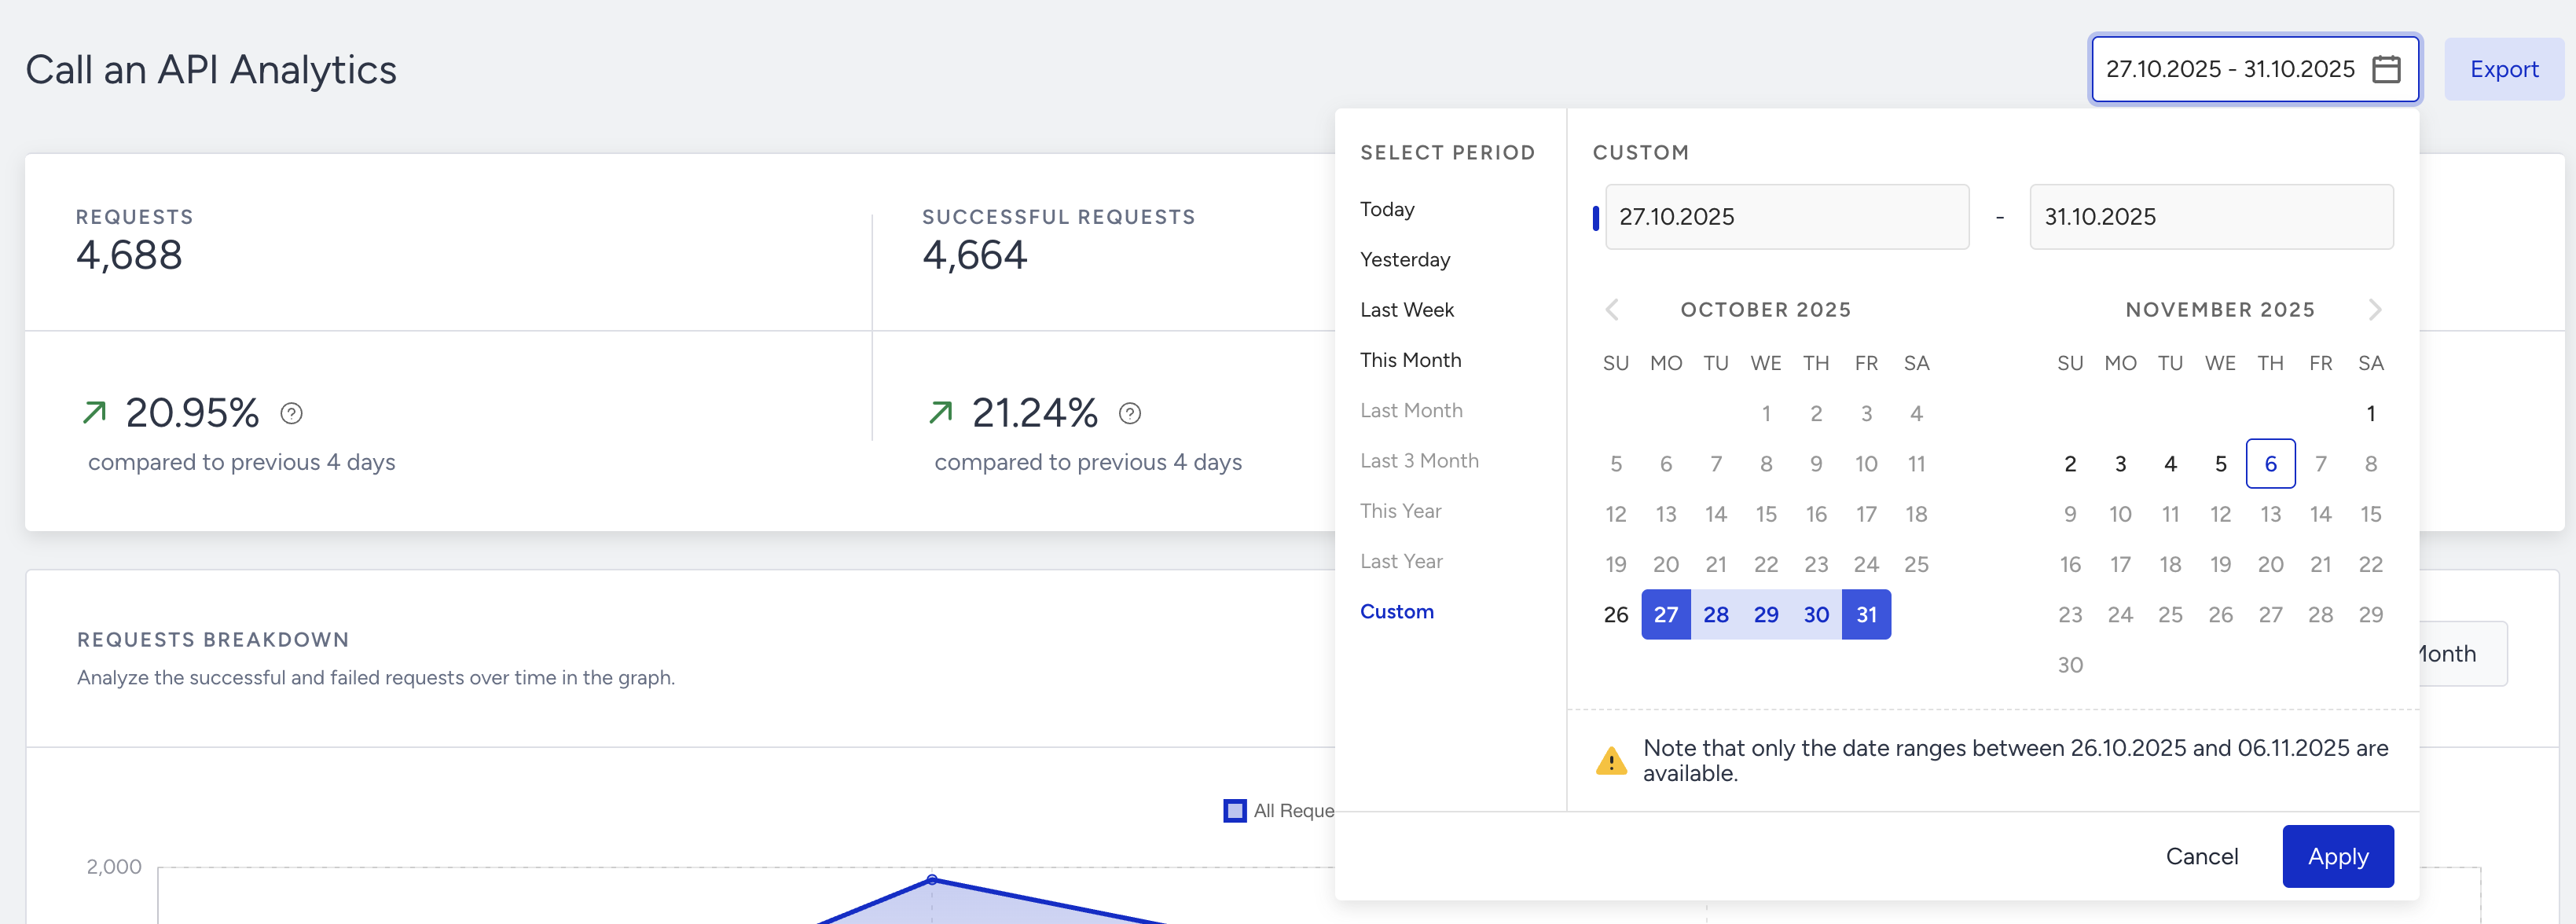
You can also click the Export button to export your report in Excel format.
Narrowing down your results, you can see the following metrics: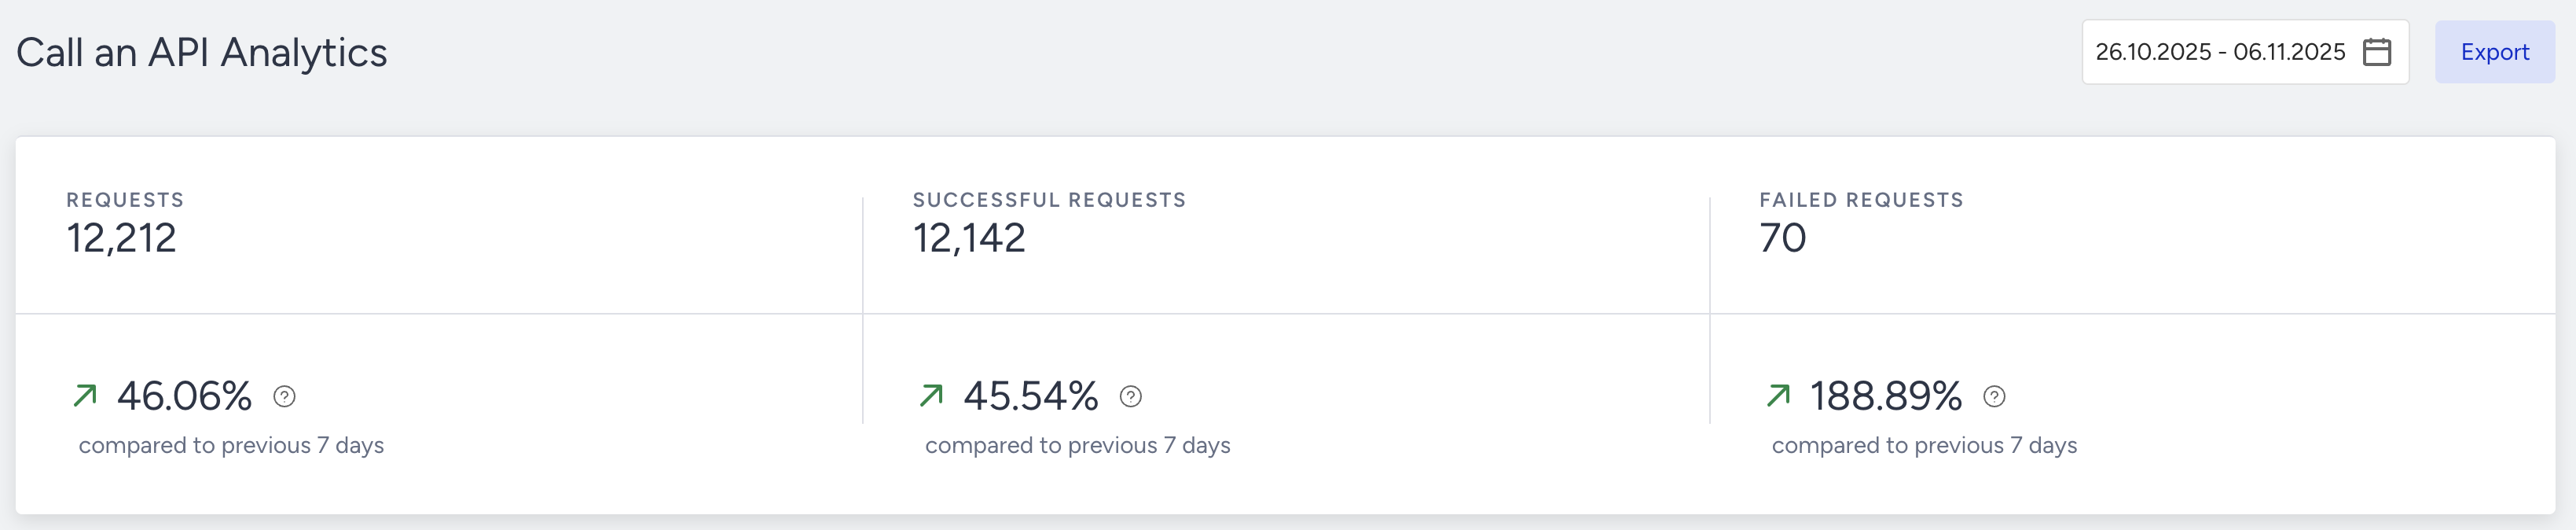
You can see incremental or decremental changes in total API requests, successful requests, and failed requests based on the selected date range. For example, selecting last month will compare it with the previous month. Selecting 7 days on the date picker will compare the selected 7 days to the previous 7 days.
- Requests: The number of API requests sent to the set endpoint (URL).
- Successful Requests: The number of requests resulted in success.
- Failed Requests: The number of requests that have returned with a failed response code.
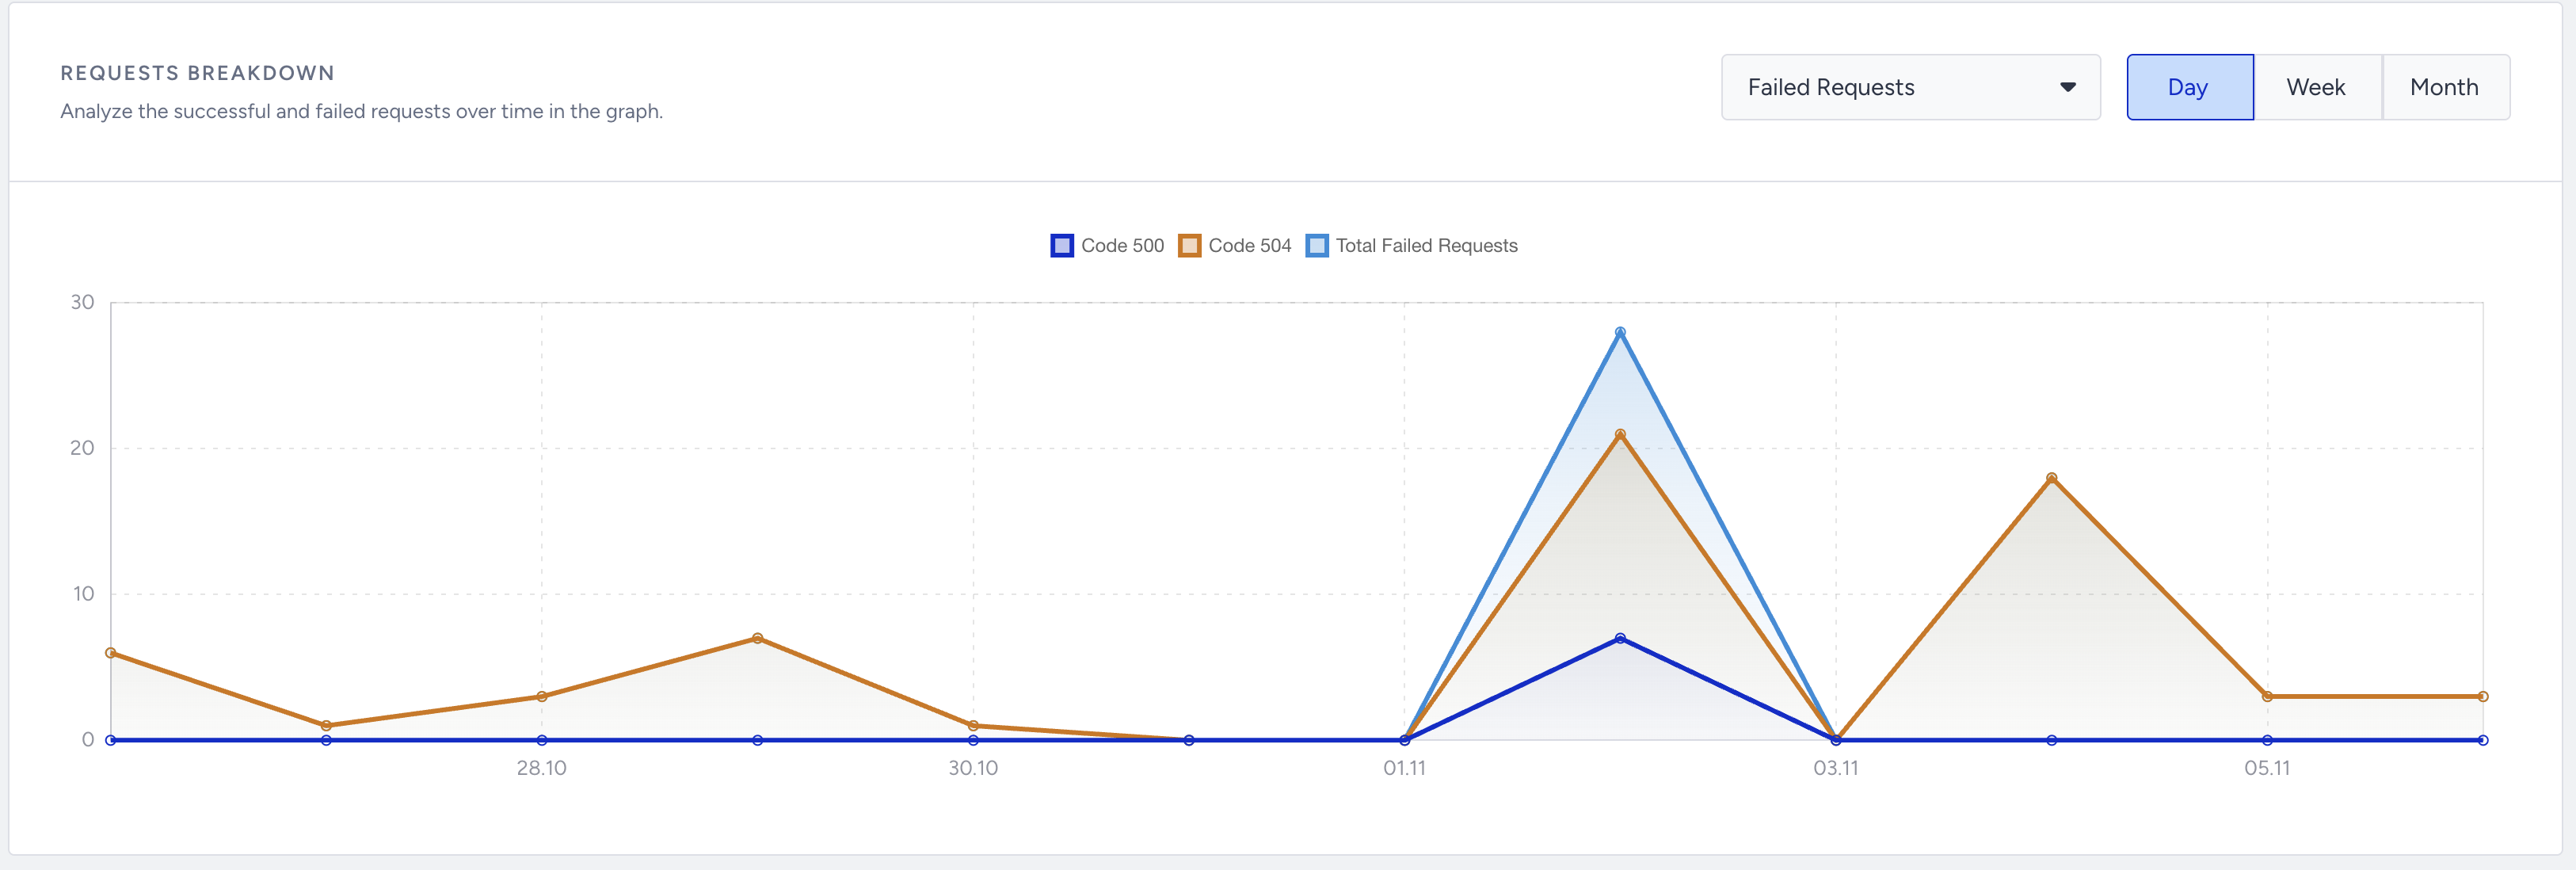
The trend charts section displays the daily, weekly, or monthly details on a line chart based on your time range selection, and the metric you can select using the dropdown on the top left corner of this section. You can also select All, Successful, or Failed Requests.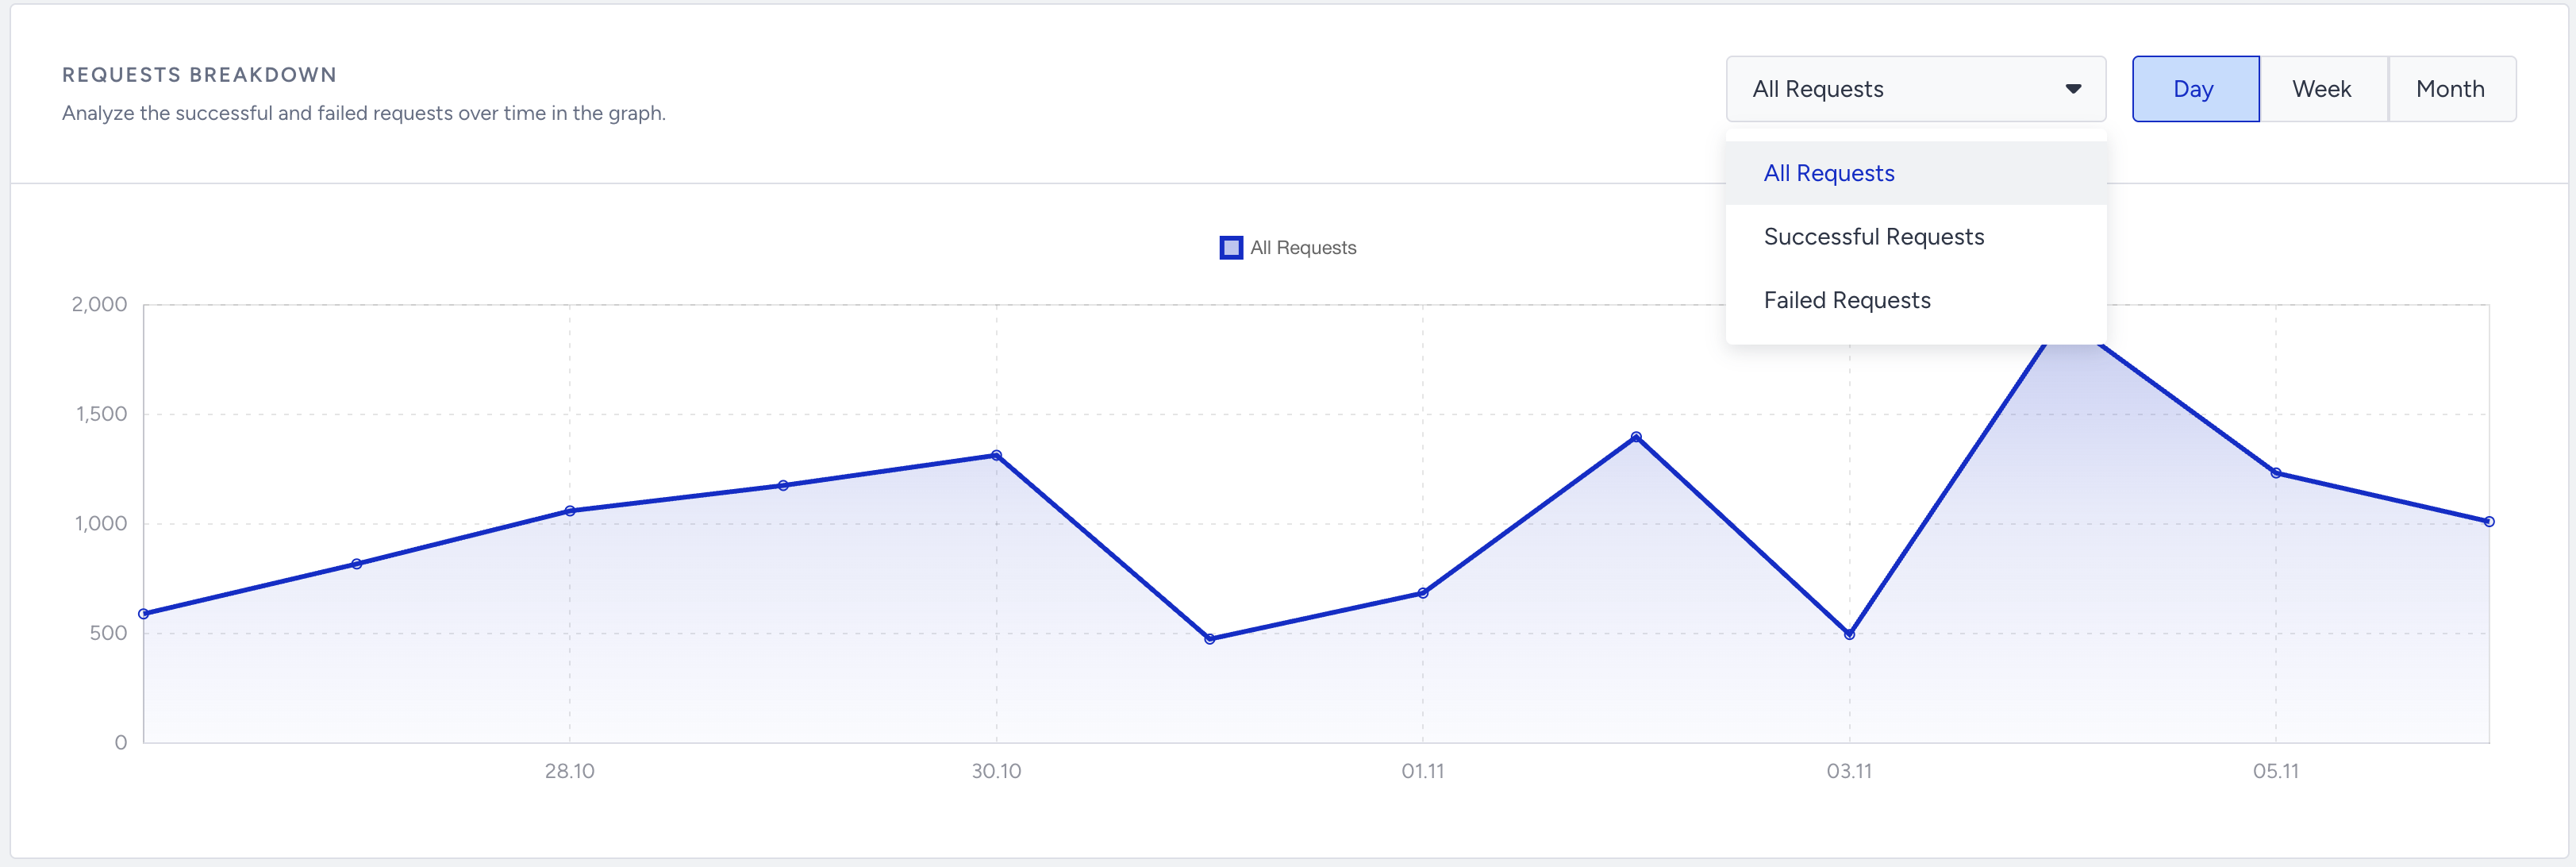
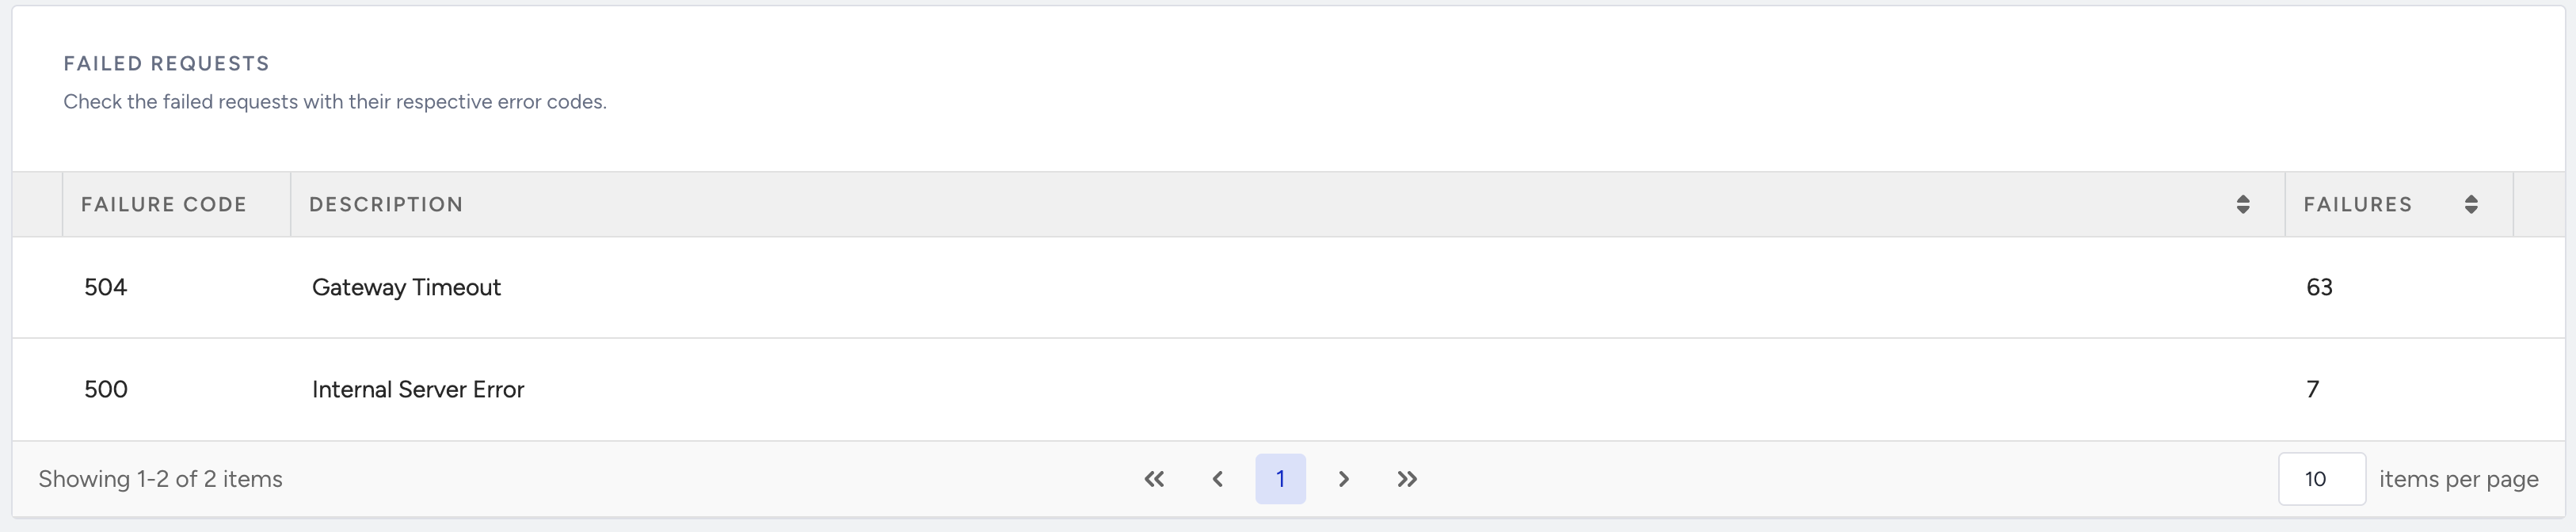
Under Failed Requests, you will see the total failed requests as well as the number of failed requests for every failed response code.
In this table, you will find the number of failed requests for each failed response code for the given date range. These response codes follow a universal standard, but their descriptions are also provided in the table for easier navigation.