Suggested readings: Architect Channel SMS, Using SMS, Architect SMS Analytics
When you are at the SMS element on the canvas, you can click the Go to SMS Analytics button on the element to see the analytics of this channel.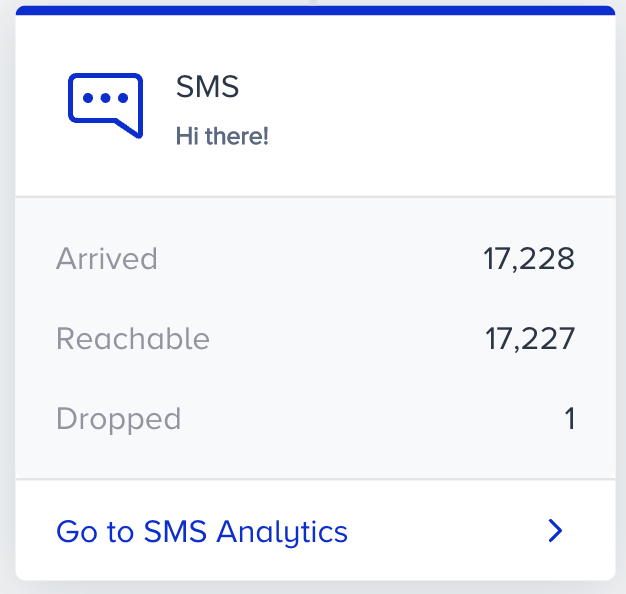
To filter the SMS metrics, you can:
- Select a goal to evaluate your SMS metrics using the dropdown in the top left corner of the page,
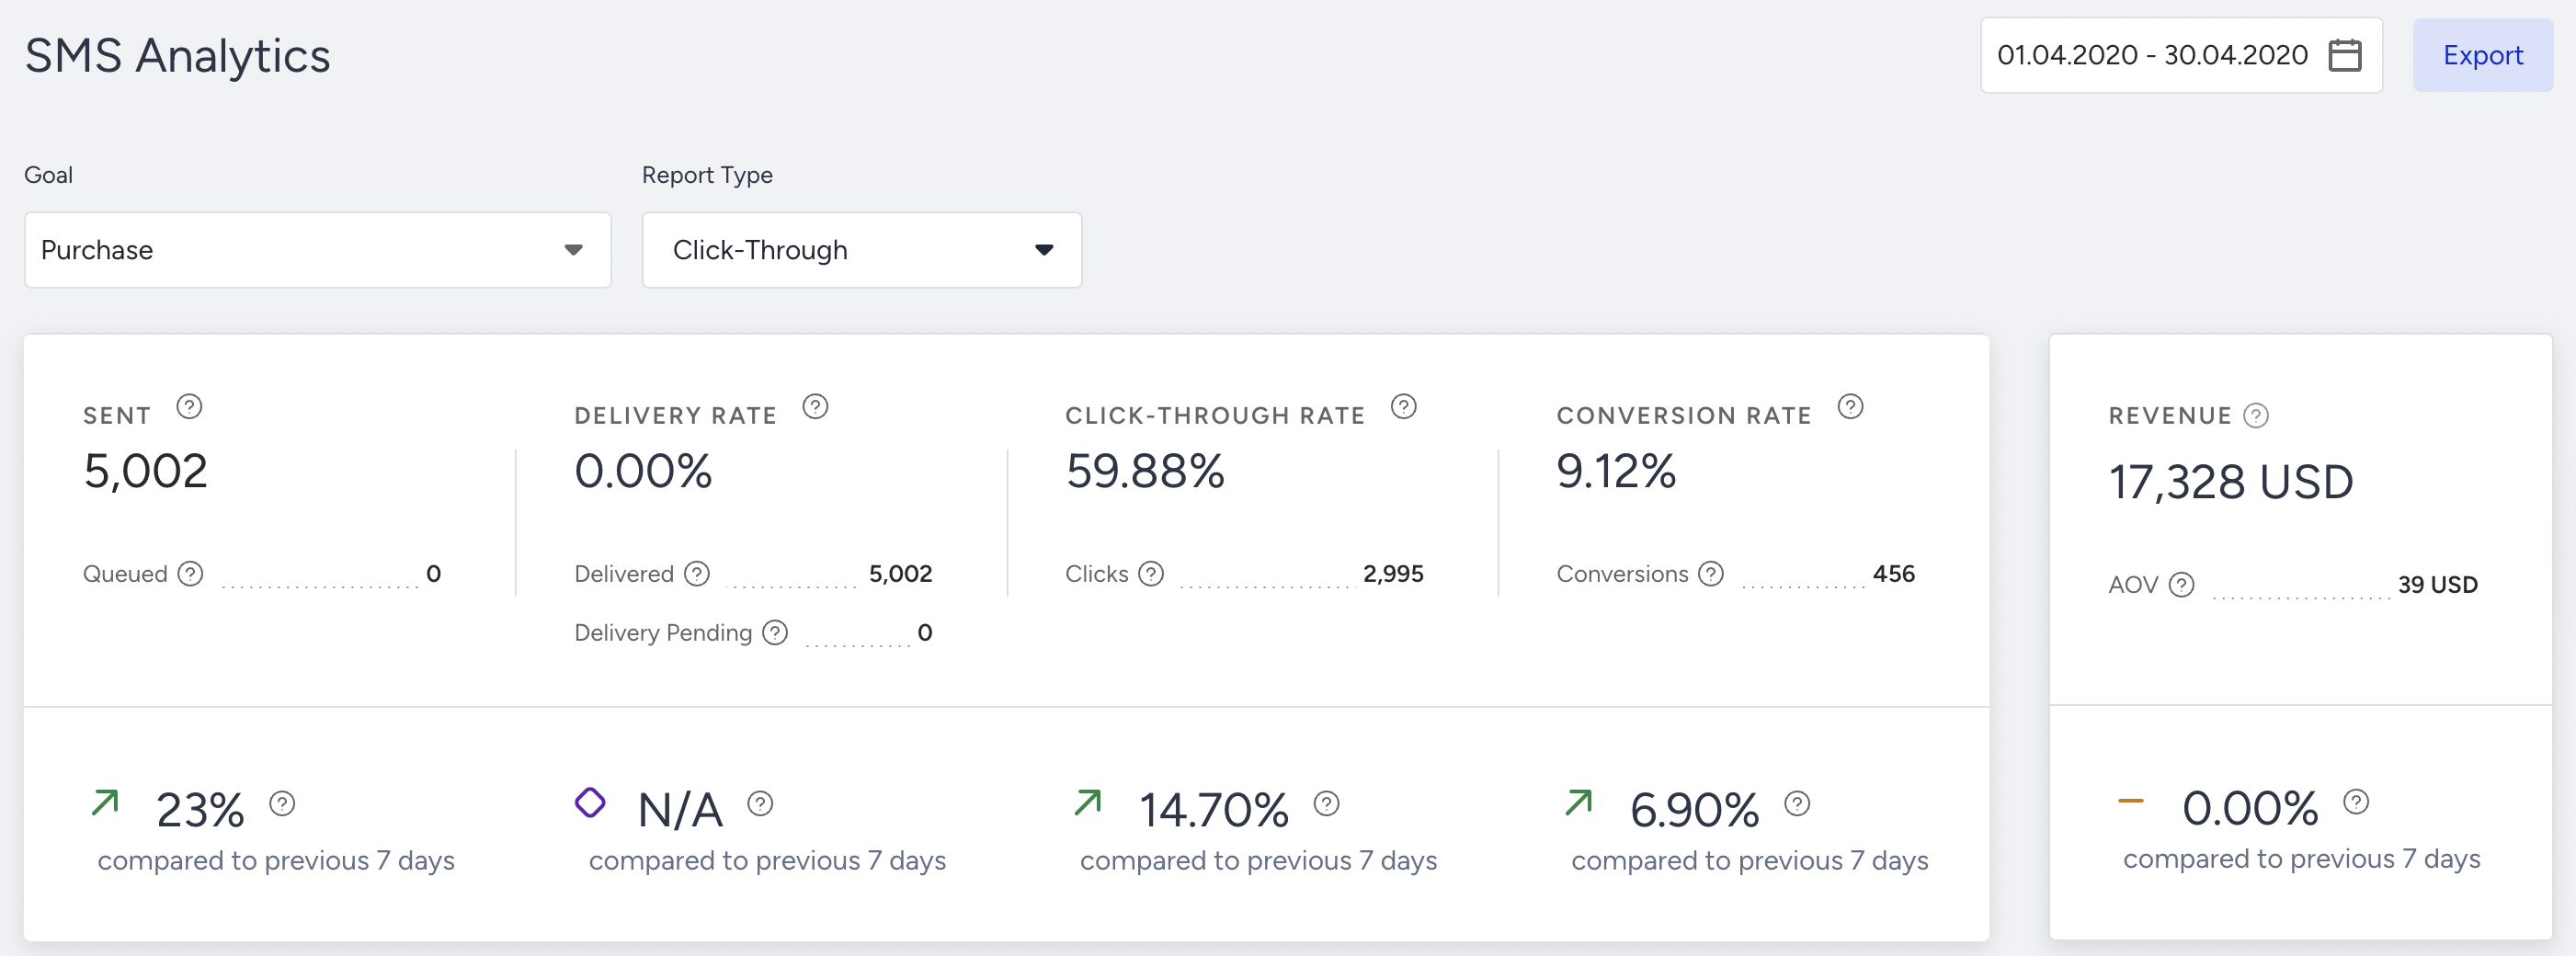
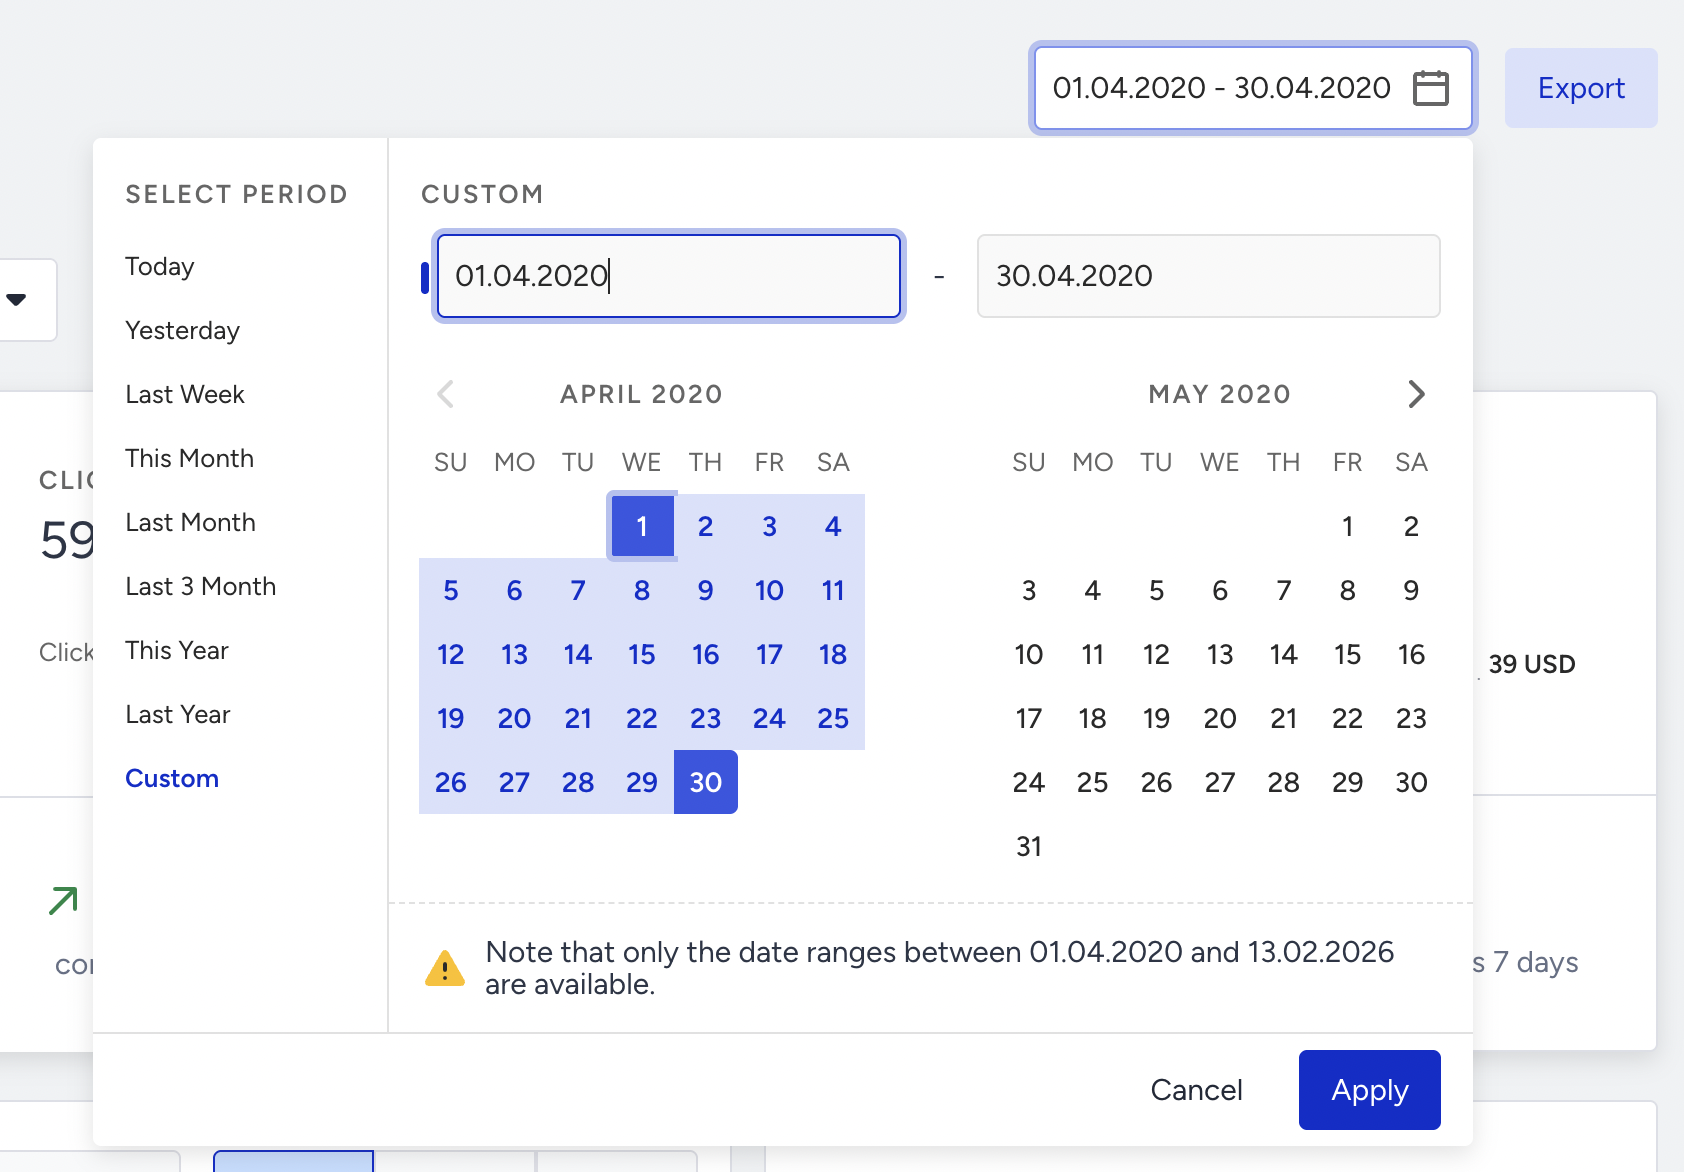
- Select a time range using the date picker in the top-right corner of the page.
You can also click the Export button to export your report to Excel.
You can also use the Architect Channel Analytics API to export your results.
Channel Metrics
Narrowing down your results, you can see the following metrics:
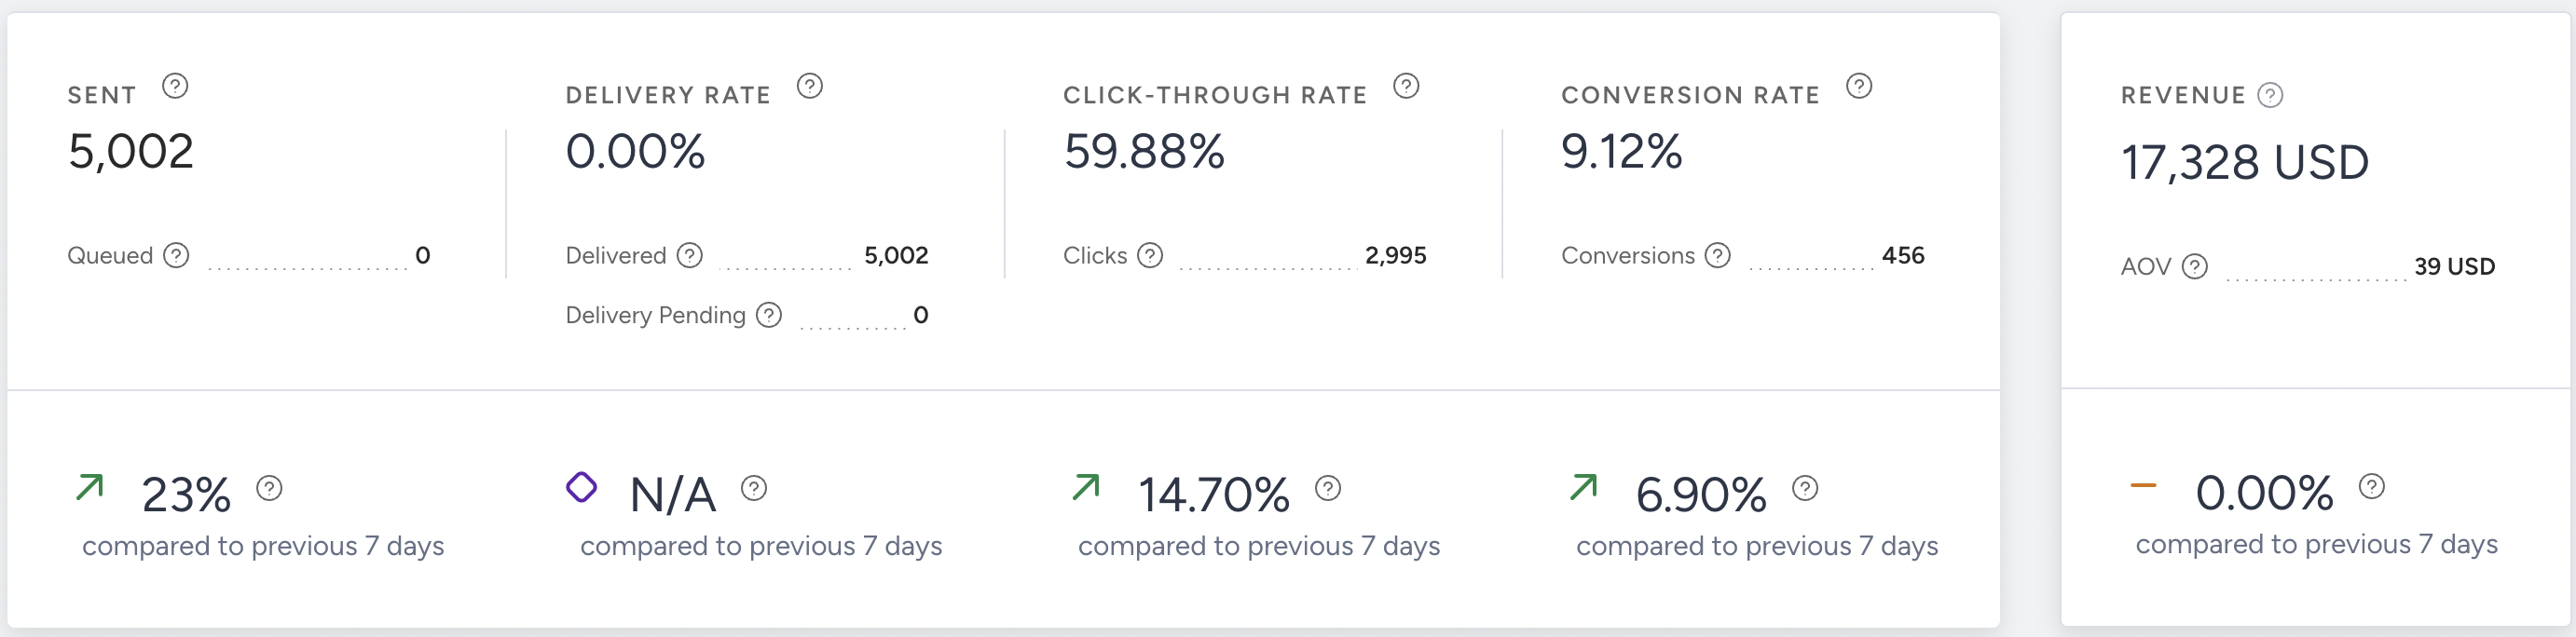
You can see incremental or decremental changes in sent, delivery rate, click-through rate, conversion rate, and revenue based on the selected date range. For example, when you select last month, it compares the last month to the previous month. When you select 7 days in the date picker, it compares the selected 7 days with the previous 7 days.
- Sent: The number of messages addressed to the users via SMS.
- Queued: The number of messages waiting to be transferred to the recipients by the service provider.
- Delivery Rate: The percentage of the Delivered to the Sent SMS messages.
- Delivered: The number of messages delivered to the users via SMS. Note that if you send SMS text of more than 160 characters, the delivered counts each SMS more than once.
- Delivery Pending: The number of Sent messages with no delivery reports received yet from the service provider.
- Click-Through Rate: The percentage of times that the users click on the URL in the message to the delivered messages via SMS.
- Clicks: The number of times that the users click on the URL in the message.
- Conversion Rate: The percentage of successful goal accomplishments to the delivered messages via SMS.
- Conversions: The number of successful goal accomplishments via SMS. Conversion changes according to the Conversion Goal selection in the dropdown.
- Revenue: The total value of the purchases made via SMS.
- Average Order Value: The division of revenue by the number of purchases made via SMS.
Performance by Metrics
The trend charts section displays daily, weekly, or monthly data in a line chart based on your selected time range and the metric chosen from the dropdown menu in the top-left corner. Available metrics include Sent, Delivered, Clicks, Conversions, Delivery Rate, Click-Through Rate, Unsubscriber Rate, Unsubscribers, and Conversion Rate.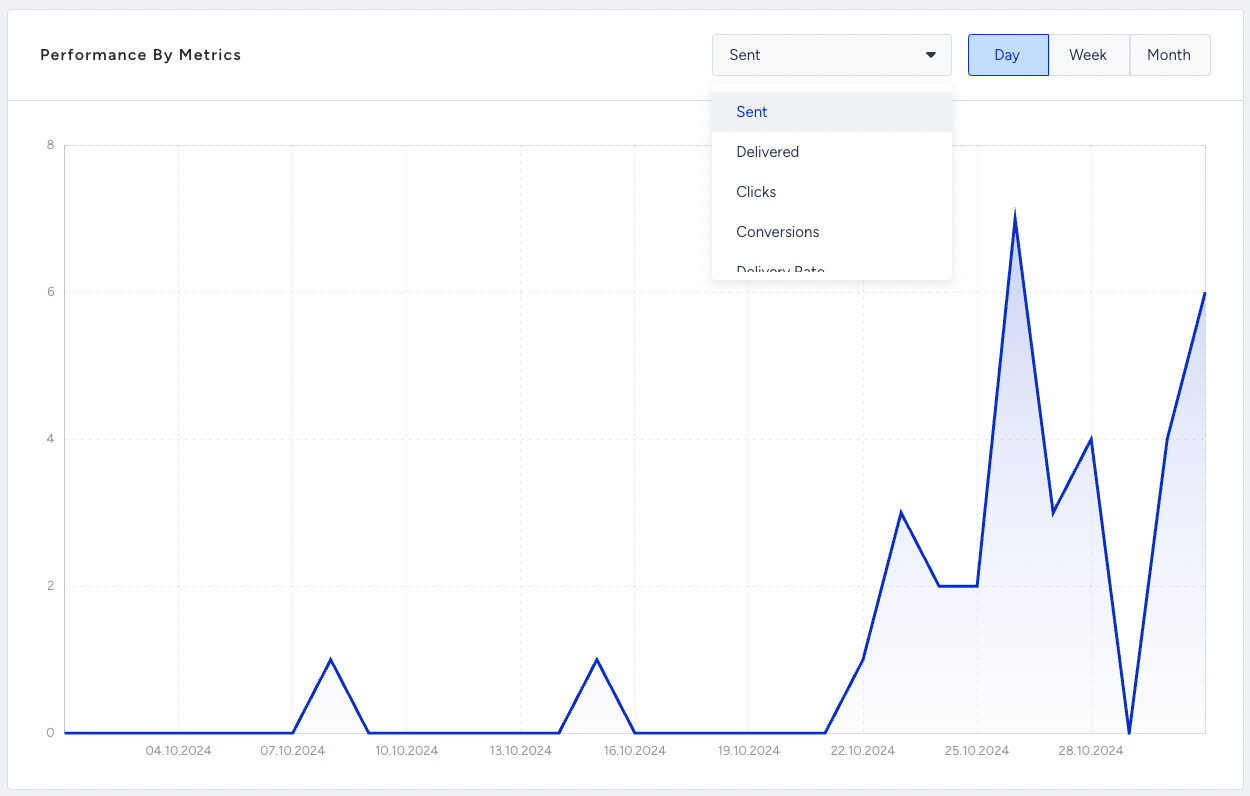
Unsuccessful Messages
Various factors can cause messages to be unsuccessful. In the Unsuccessful Messages section, you can view and analyze the primary reasons behind Dropped and Undelivered messages.
Dropped Messages
Dropped messages are the total number of SMS messages that weren’t transferred to the service provider to be addressed to the recipients. 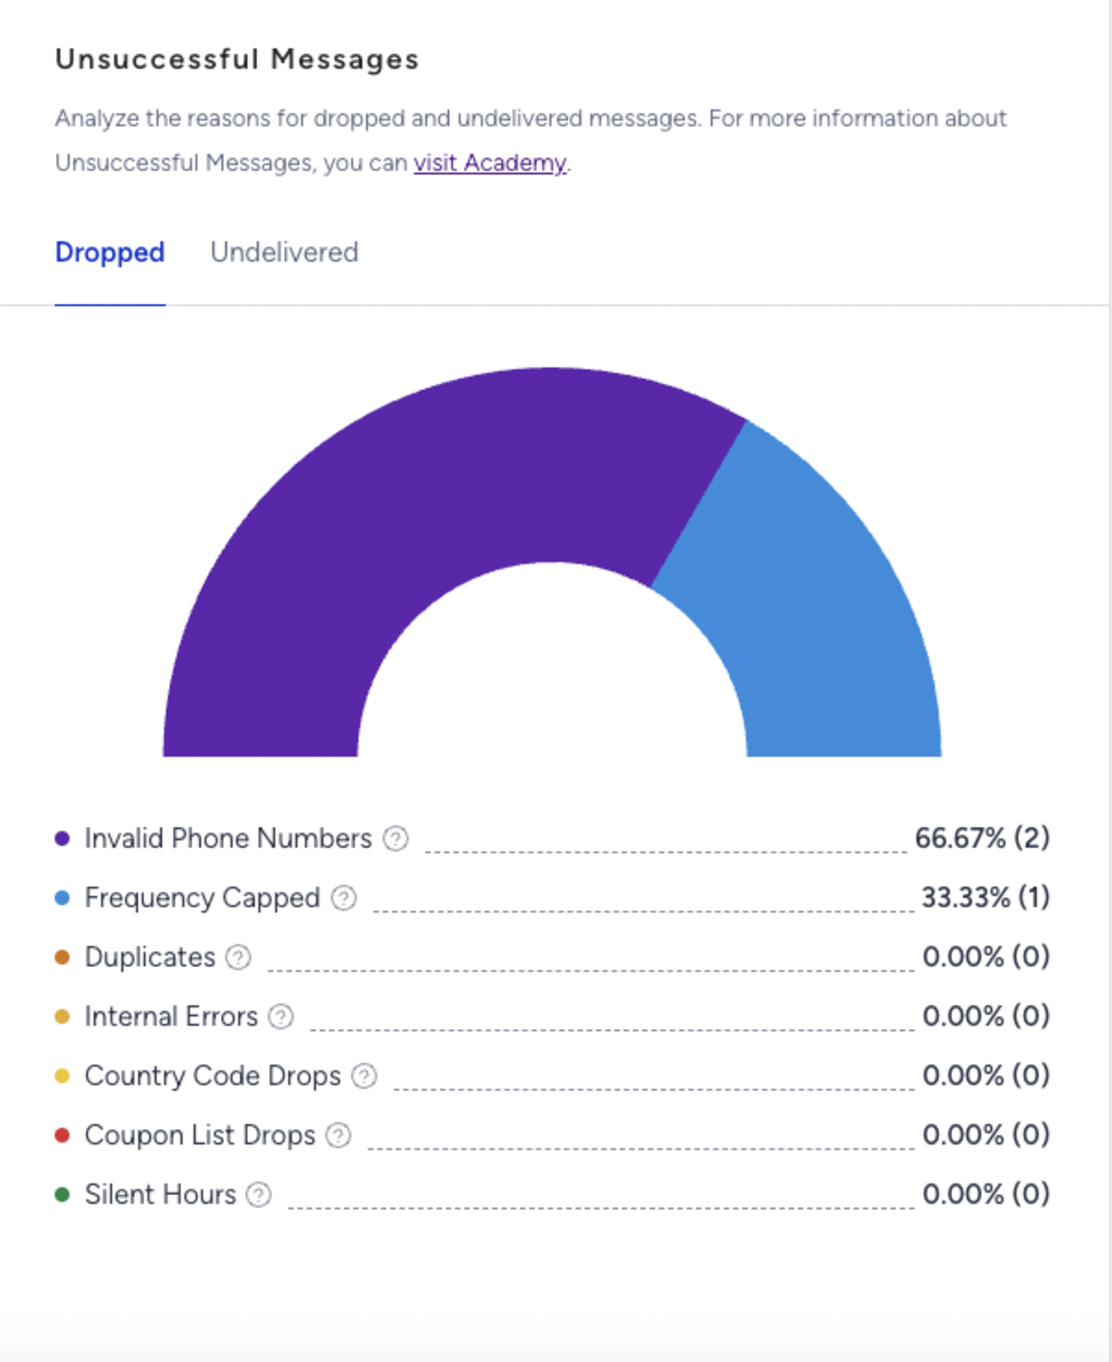
- Frequency Capped: The percentage (and the number) of the dropped messages due to the Channel Frequency Capping settings.
- Duplicates: The percentage (and the number) of dropped messages due to duplicate recipients in the audience.
- Internal Errors: The percentage (and the number) of dropped messages due to various internal system issues(bugs, server problems, technical malfunctions).
- Country Code Drops: The percentage (and the number) of the dropped messages due to the phone numbers with country codes other than the specified in your contract.
- Invalid Phone Numbers: The percentage (and the number) of dropped messages due to the phone numbers being in a non-standard format.
- Coupon List Drops: The percentage (and the number) of the dropped messages due to insufficiently dedicated coupons in the selected coupon lists.
- Silent Hours: The percentage (and the number) of dropped messages due to preventing the delivery of messages for a period of time by enabling Silent Hours.
Undelivered Messages
Undelivered Messages are the total number of SMS messages that weren’t addressed to the recipients by the service provider.
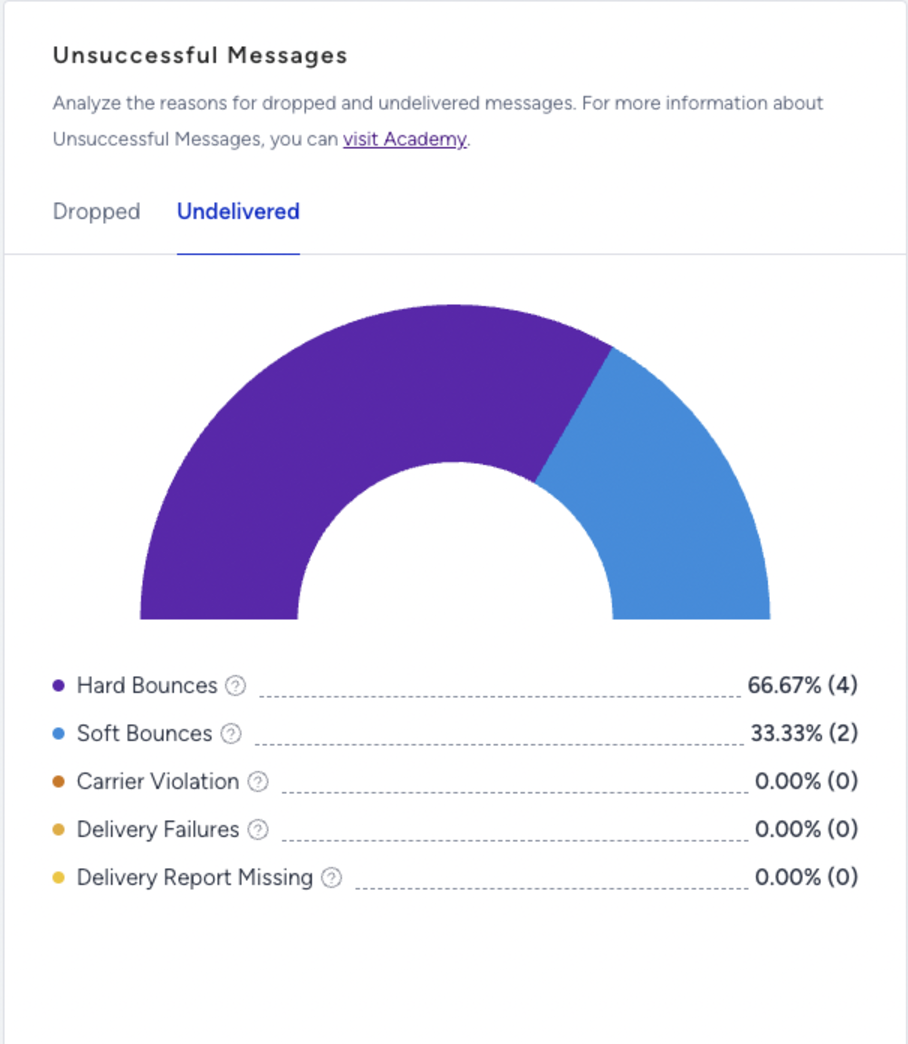
- Carrier Violation: The percentage (and the number) of undelivered messages due to content or spam filtering by the service provider.
- Hard Bounces: The percentage (and the number) of the undelivered messages since the recipients’ phone numbers are not in use. You can find below possible reasons for Hard Bounce;
- Unknown Number: The destination number you are trying to reach is unknown and might no longer exist.
- Message Blocked: The destination number you are trying to reach is blocked from receiving this message due to blacklisting.
- Landline or Unreachable Carrier: The destination number cannot receive this message; attempting to reach a landline or an unreachable carrier.
- Soft Bounces: The percentage (and the number) of the undelivered messages since the recipients are not reachable at that moment.
- Unreachable Phone: The destination phone you are trying to reach is switched off or unavailable at the moment
- Roaming: You are trying to reach a number that is currently roaming and cannot accept the message right now.
- Delivery Failures: The percentage (and the number) of Undelivered messages due to technical issues at the service provider side.
- Delivery Report Missing: The percentage (and the number) of Undelivered messages due to no delivery reports received from the service provider
Next, you can see the SMS Message Parts, Unsubscriber Rate, and Unsubscribers metrics.
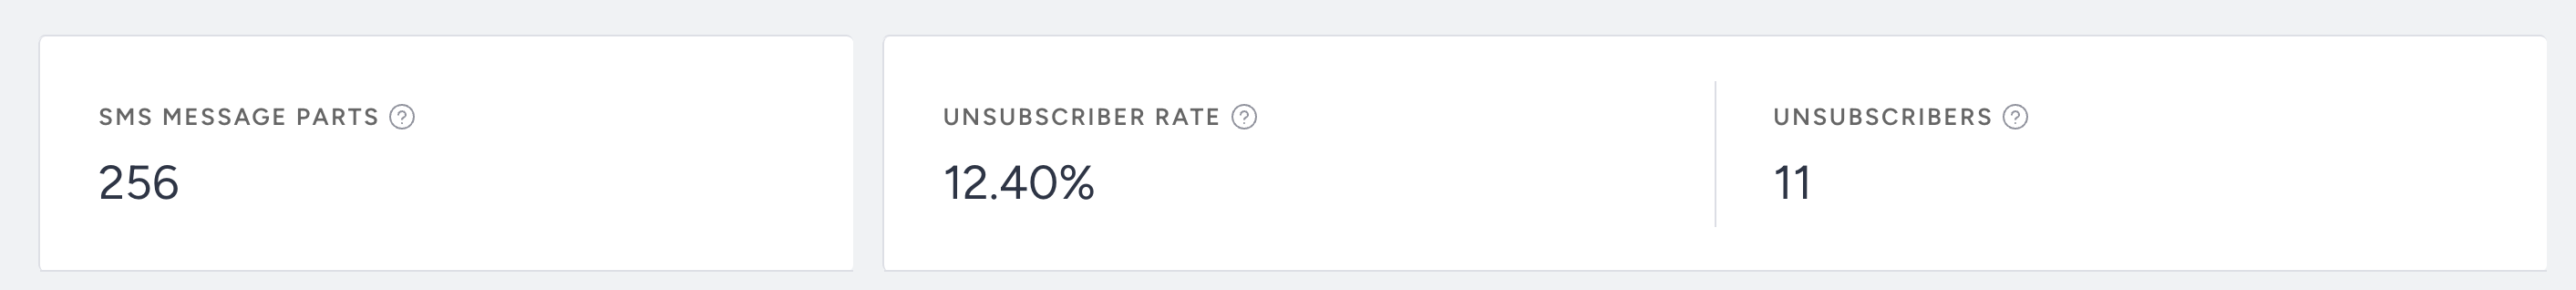
According to your message type, whether SMS or MMS, SMS or MMS Message Parts metrics will be shown.
- SMS Message Parts: The total number of SMS message parts allocated to send all the content in the SMS messages.
- MMS Message Parts: The total number of messages allocated for sending all the content in the messages.
- Unsubscriber Rate: The percentage of the Unsubscribers to the number of Delivered messages.
- Unsubscribers: The number of recipients who opted out of your messages.
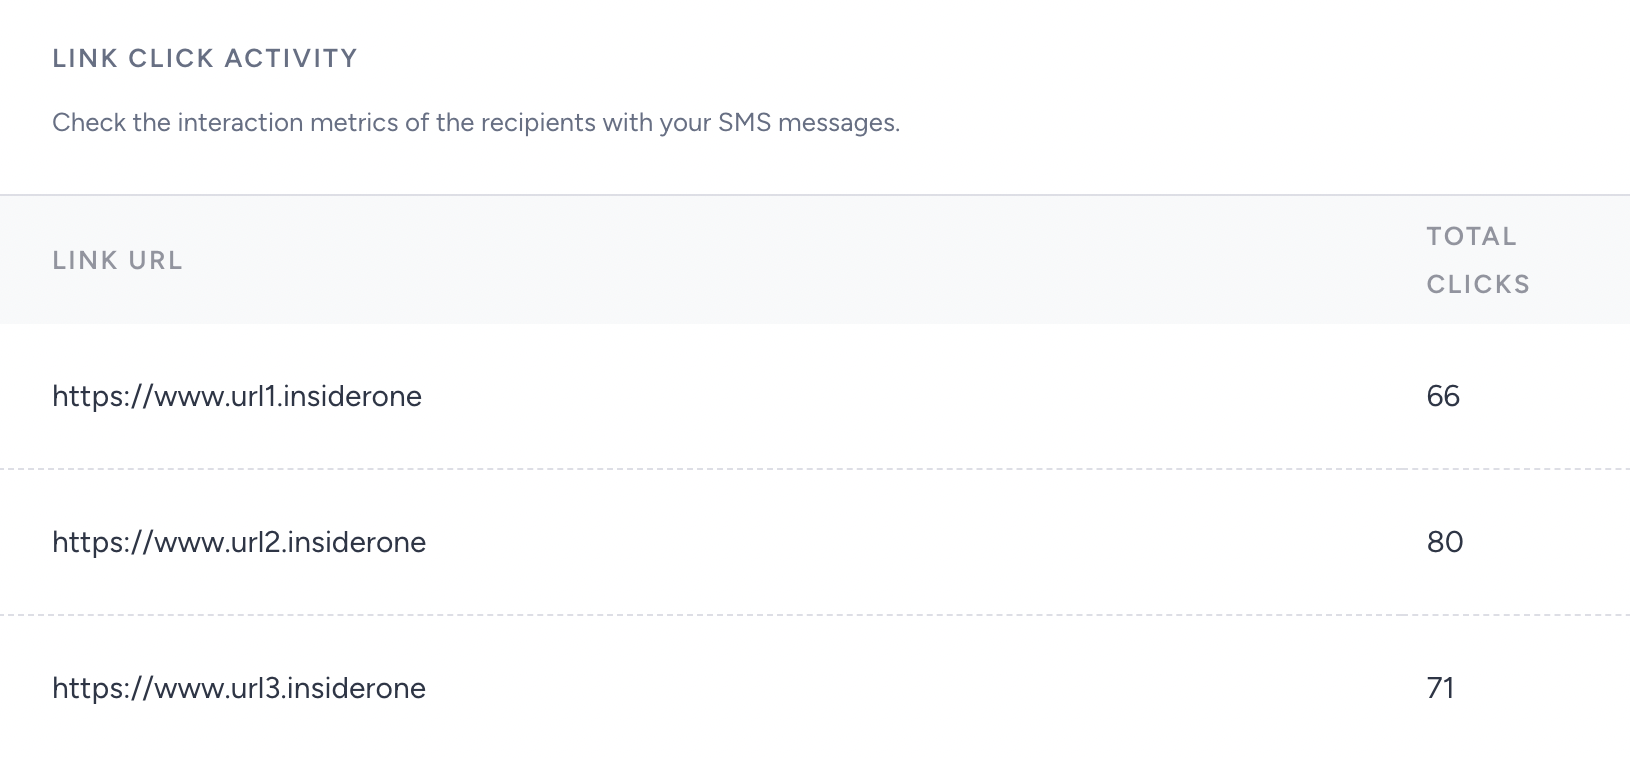
Link Click Activity
You can use the link click activity section to see and track the performance of your links allocated in your SMS campaigns.