Suggested Reading: Executive Summary Dashboard: Metric Definitions, Historical Data Comparison on Onsite Campaign Analytics
Historical data comparison helps you compare your data between a selected date range and the previous range of the same duration and provides insights about your top 5 products' (OnSite, Mobile App, Web Push, Email, and Architect) historical performance.
Your title goes here
Data comparison is available on your dashboard by default. If necessary, you can disable it.
How does historical data comparison work?
The comparison mechanism considers the selected date range and the previous date range of the same duration. For example, if you choose the 10 January 2023 - 13 January 2023 range (4 days), the system will compare the data to that in the 6 January 2023 - 9 January 2023 range (4 days).
You can interpret the data comparison as per the following indicators:
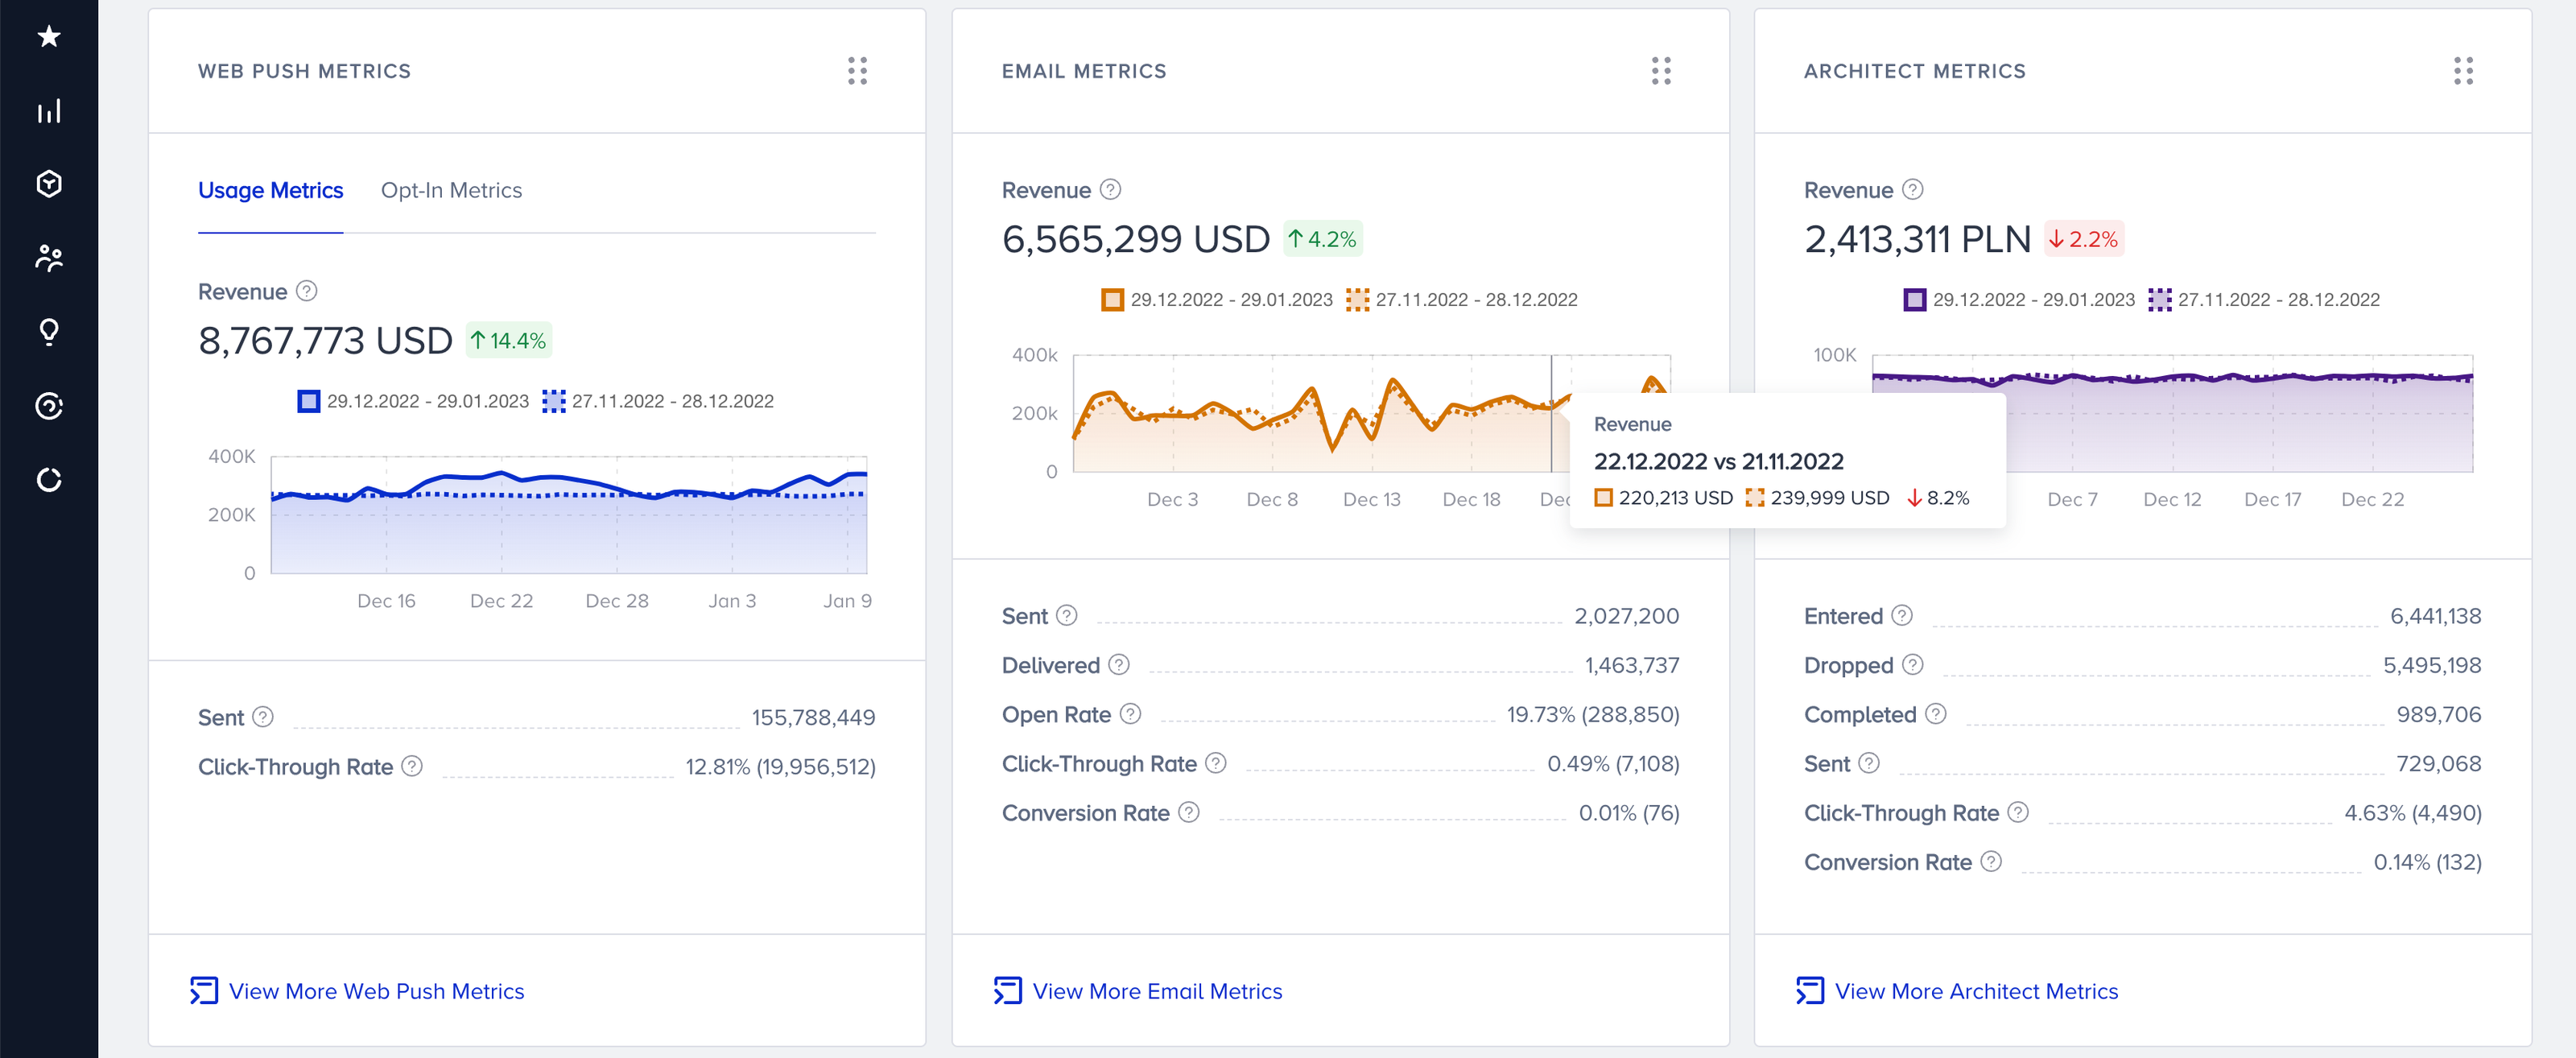
- Green label: Represents the increase in the respective figure(s). E.g., ↑14.6%.
- Red label: Represents the decrease in the respective figure(s). E.g. ↓2.2%.
- -0.0%: Represents no significant change within the selected period.
- N/A: Indicates that comparison for the selected date ranges is not applicable. This might happen when the data for one of the date ranges is 0.
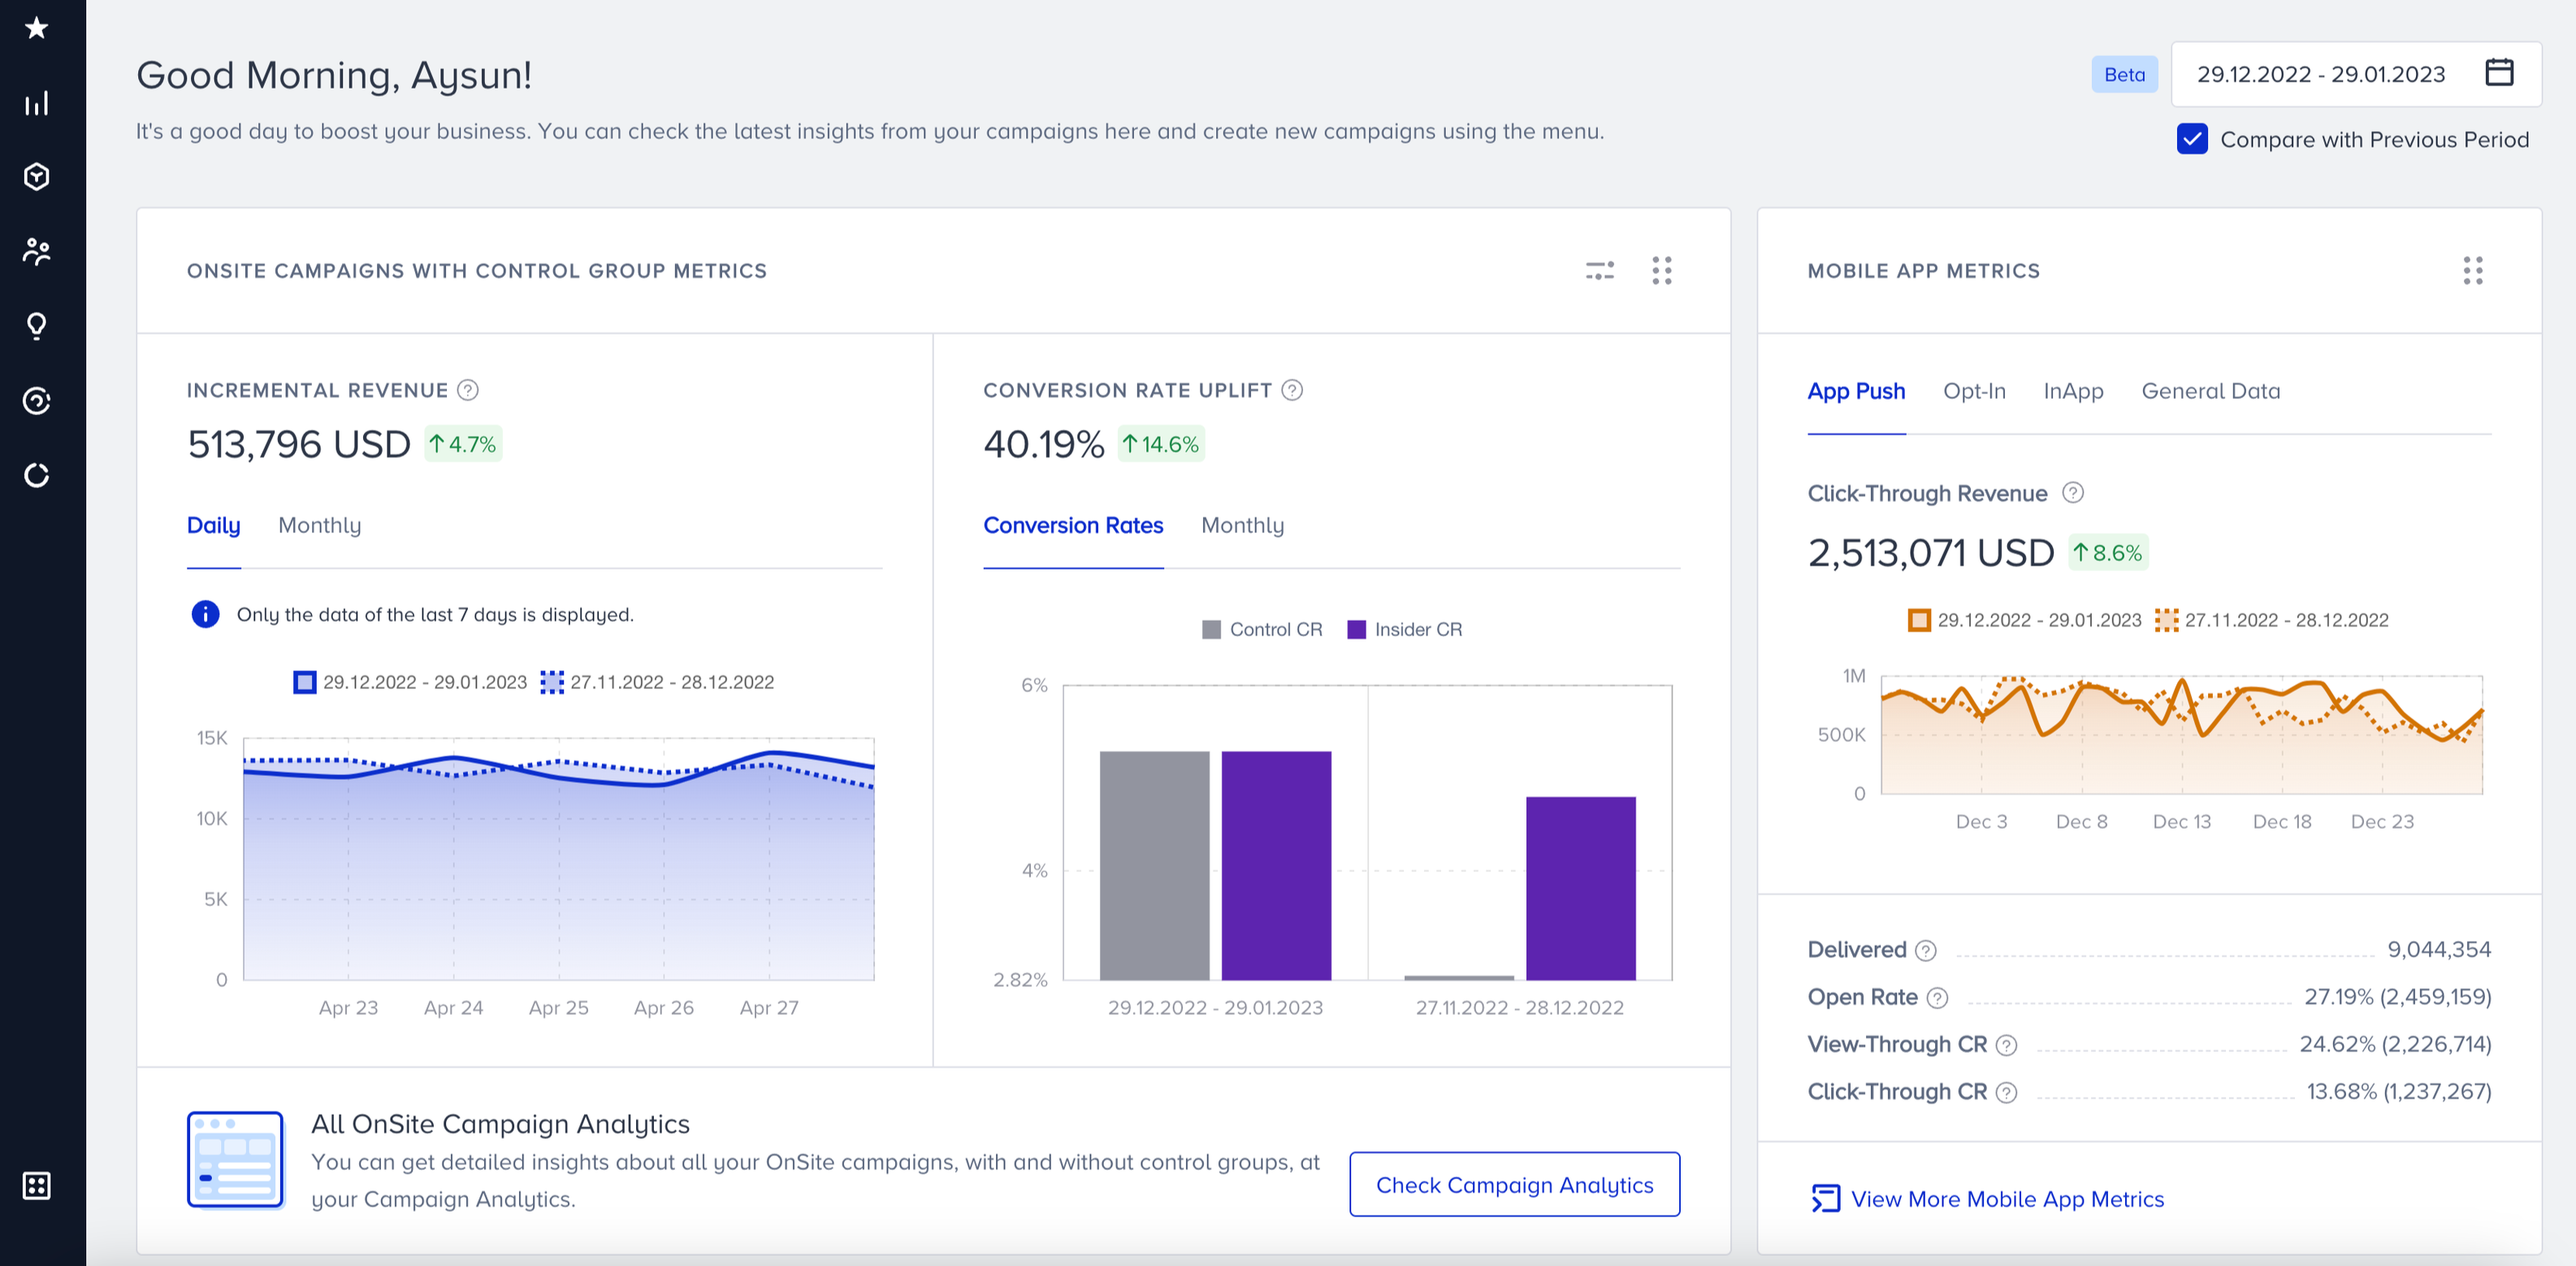
What are the capabilities of data comparison?
- The maximum date range you can compare data for is 45 days. This means you can compare the data of a 45-day range to that of the previous 45-day range. Any date range selected longer than 45 days will not display any comparison.
- Data comparison is applicable for summary/key metrics and graphs.
- The incremental revenue graph of the OnSite Campaigns can be compared only for 7-day ranges due to the calculation formula of Incremental Revenue. To see more ranges, click the Monthly tab on the Incremental Revenue section.