When you are at the In-App element on the canvas, you can click the Go to In-App Analytics button to see this channel's analytics.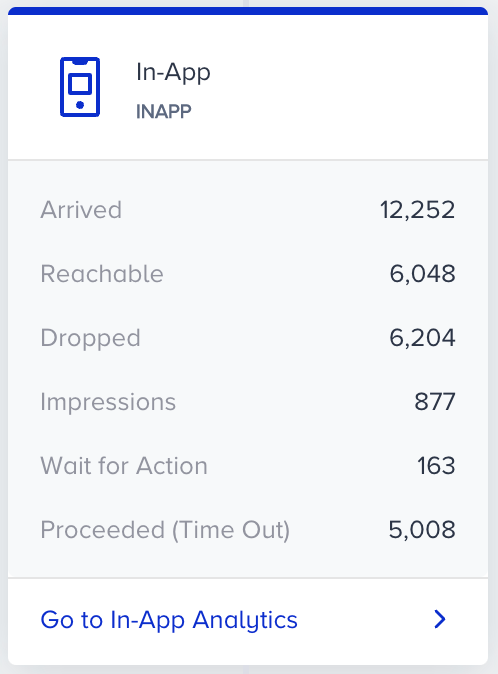
You can filter the In-App metrics by:
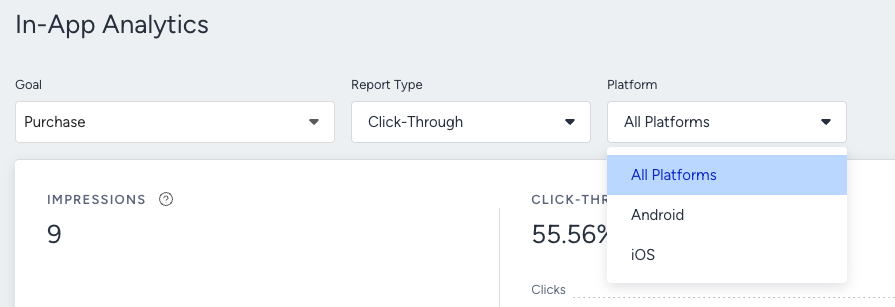
- Select a platform to evaluate your in-app metrics using the dropdown at the top of the page.
- Select a time range using the date picker in the top-right corner of the page.
.png)
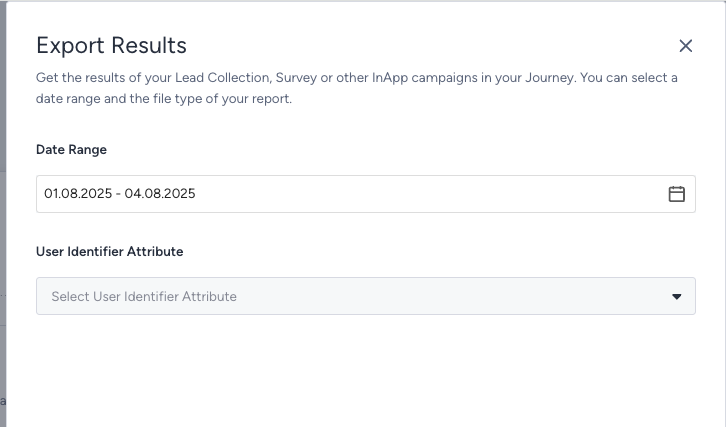
Click the Export button, then select Export Analytics to export your channel analytics to Excel. Select the Export Results option to export the results of your Lead Collection, Survey, or other InApp campaigns.
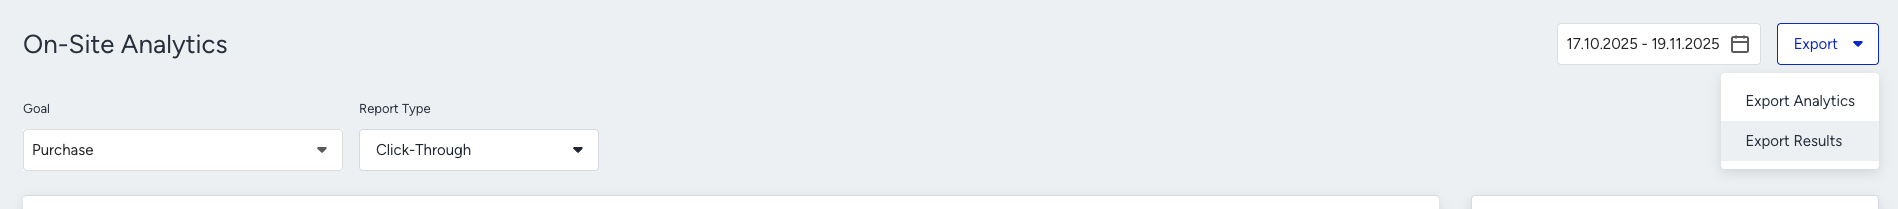
You can export results by selecting a date range and the user identifier attribute you select.
Channel metrics
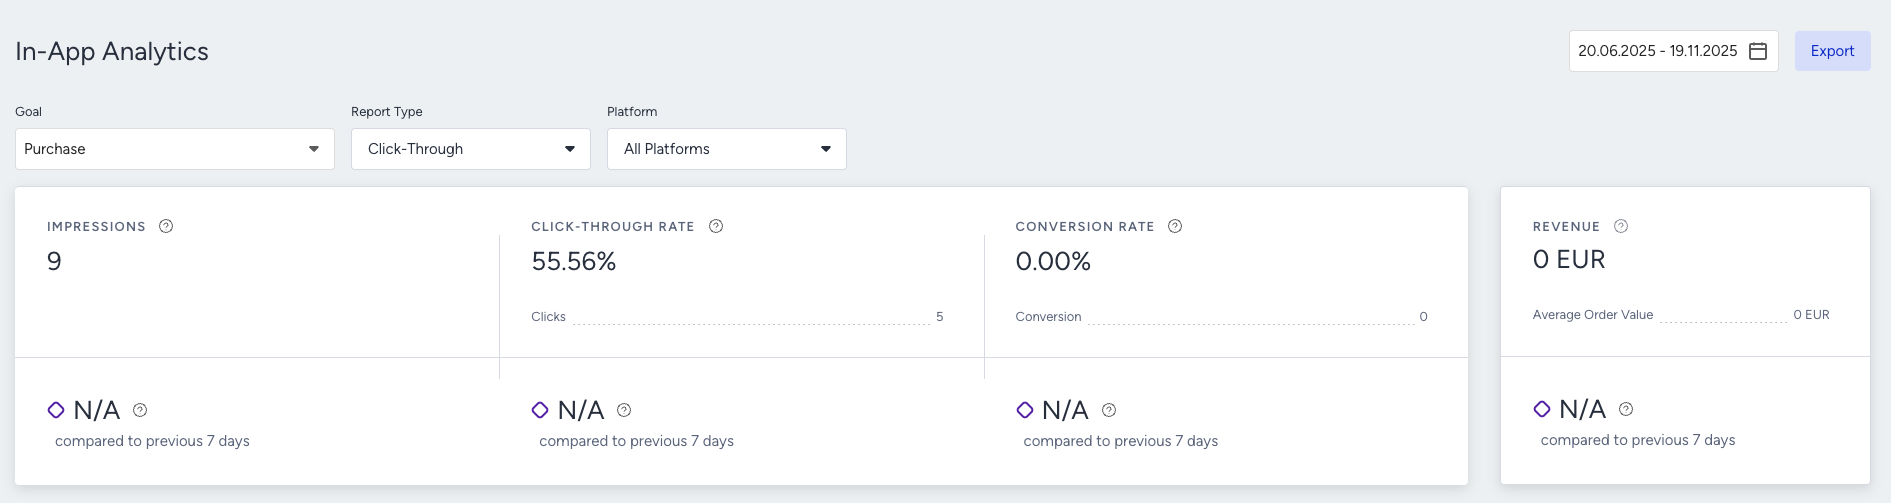
Narrowing down your results, you can see the following metrics:.png)
You can see the incremental or decremental changes in impressions, click-through rate, conversion rate, and revenue based on the selected date range. For example, selecting last month compares the last month to the previous month. Selecting 7 days in the date picker compares the selected 7 days with the previous 7 days.
- Impressions: The number of In-App campaigns shown to the users.
- Click-through rate: The percentage of times users interacted with the campaign to the shown campaign via In-App.
- Clicks: The number of times that the users interacted with In-App. Close buttons and overlay clicks are not counted as clicks.
- Conversion rate: The percentage of successful goal accomplishments to the shown campaign via In-App.
- Conversions: The number of successful goal accomplishments via In-App. Conversion changes according to the Conversion Goal selection on the dropdown.
- Revenue: The total value of the purchases made via In-App.
- Average Order Value: The revenue division by the number of purchases made via In-App.
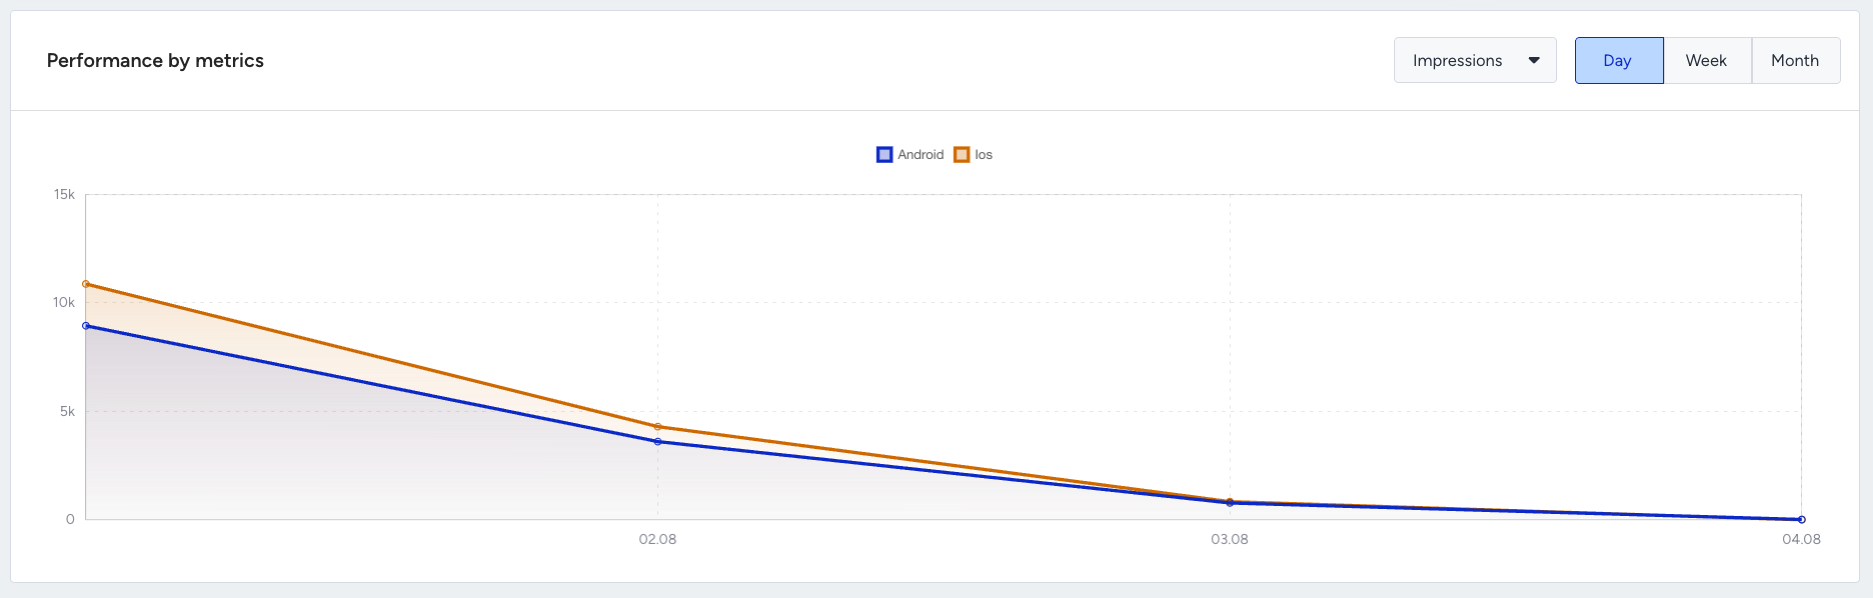
Performance by metrics
The trend charts section displays the daily, weekly, or monthly details on a line chart based on your time range selection, and the metric that you can select using the dropdown on the top right corner of this section. You can also select Impressions, Clicks, or Conversions for different operating systems on which your campaign is running.