your title goes here
Suggested Reading: For further details on SMS analytics, refer to SMS Channel Analytics.
SMS Analytics
You can evaluate how each SMS campaign (element) performs in your journey flow as it runs.
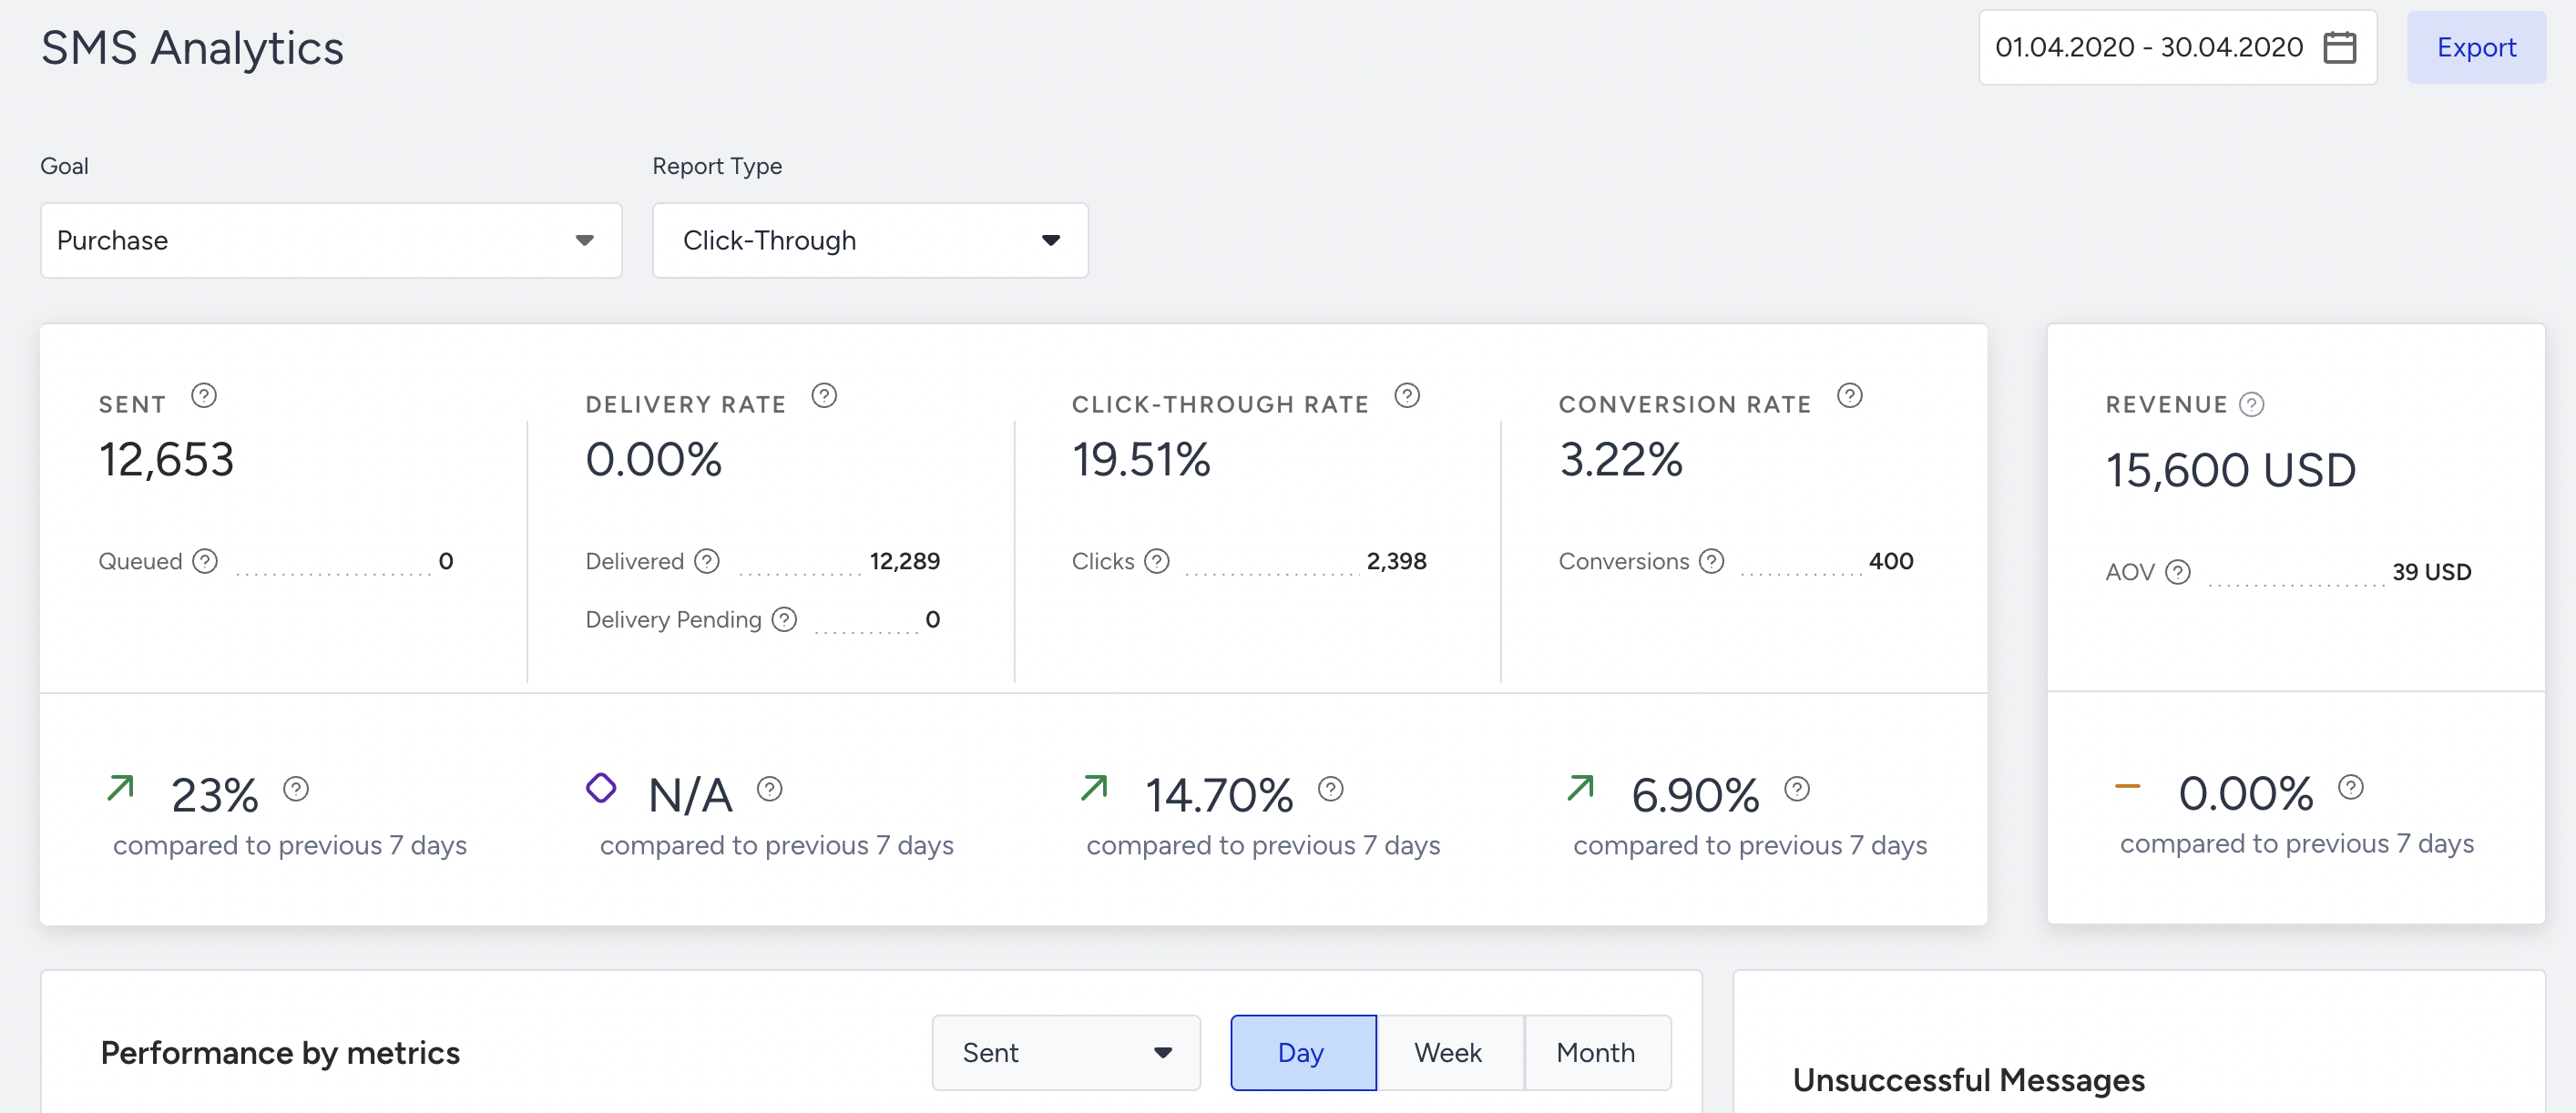
You can see Sent, Queued, Delivery Rate, Delivered, Delivery Pending, Click-Through Rate, Clicks, Conversion Rate, Conversions, Revenue, and Average Order Value metrics, and their trends.
- Sent: The number of messages addressed to the users via SMS.
- Queued: The number of messages waiting to be transferred to the recipients by the service provider.
- Delivery Rate:The percentage of the Delivered to the Sent SMS messages.
- Delivered: The number of messages successfully transferred to the recipients.
- Delivery Pending: Te number of Sent messages with no delivery reports received yet from the service provider.
- Click-Through Rate: The percentage of times that the users clicked the URL in the message to the delivered messages via SMS.
- Clicks: The total number of times that the recipients clicked the links in your messages.
- Conversion Rate: The percentage of the successful goal accomplishments to the delivered messages via SMS.
- Conversions: The number of successful goal accomplishments.
- Revenue: The total value of the purchases made via SMS.
- Average Order Value: The division of Revenue by the number of purchases made via your messages.
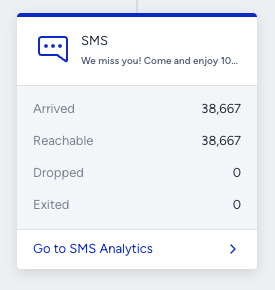
Live Stats
After the journey is launched, you can view the statistics of each element directly on the canvas. For more information on the available metrics and their descriptions, refer to Live Statistics.