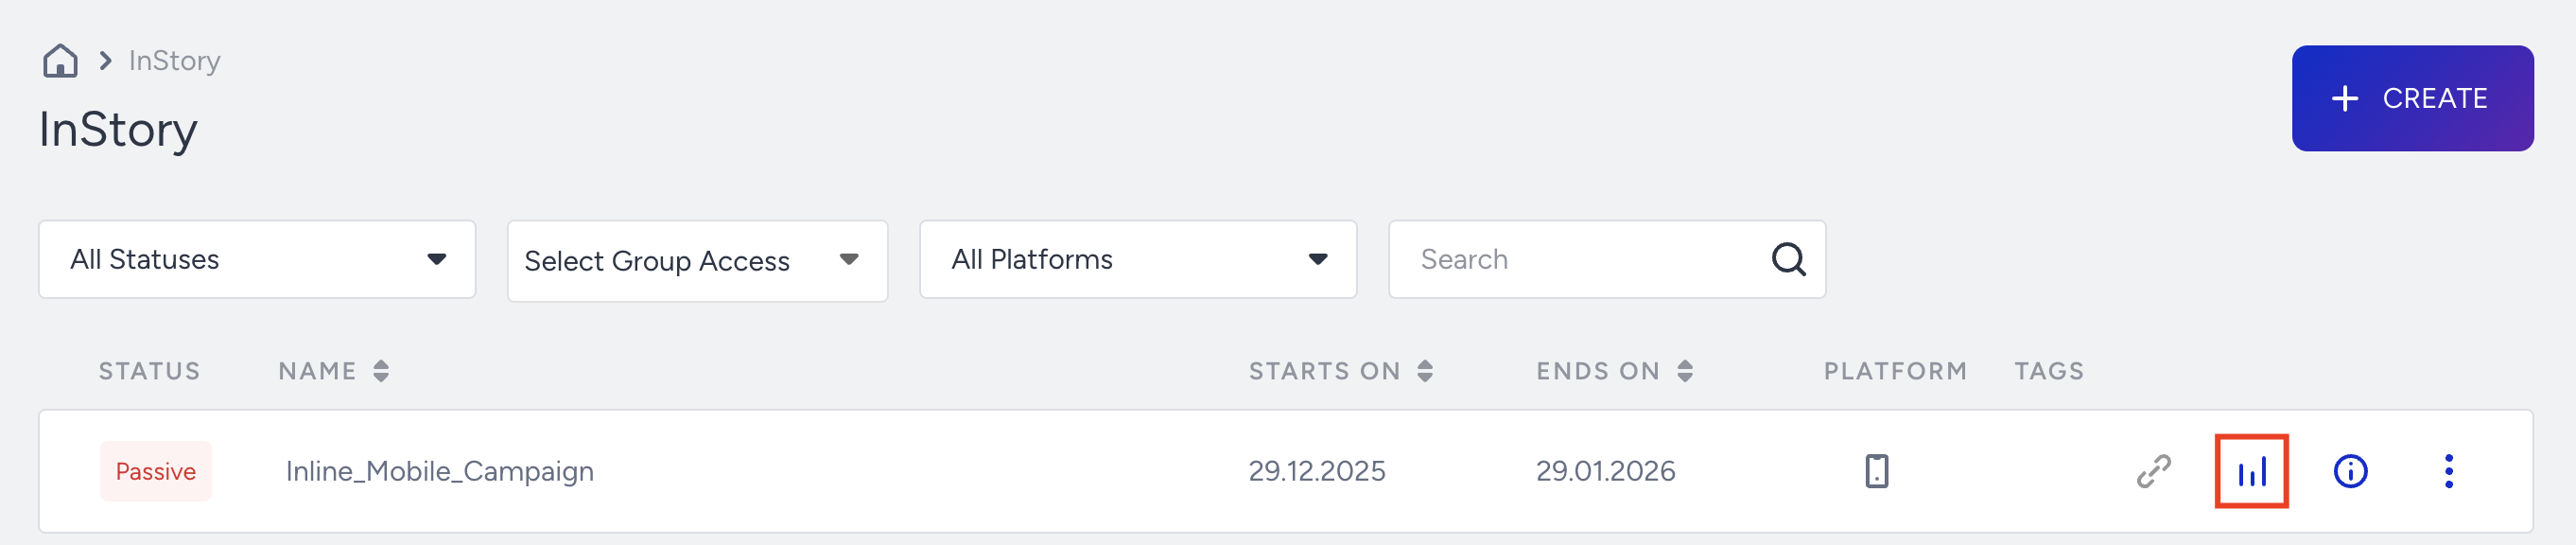
To better understand and measure the performance of an individual InStory campaign, click on the Analytics on the campaign you want to view on the InStory campaign listing page.
You can view the results based on the time range you select. You can export the result by clicking the Export button to an Excel file or a URL link to share.
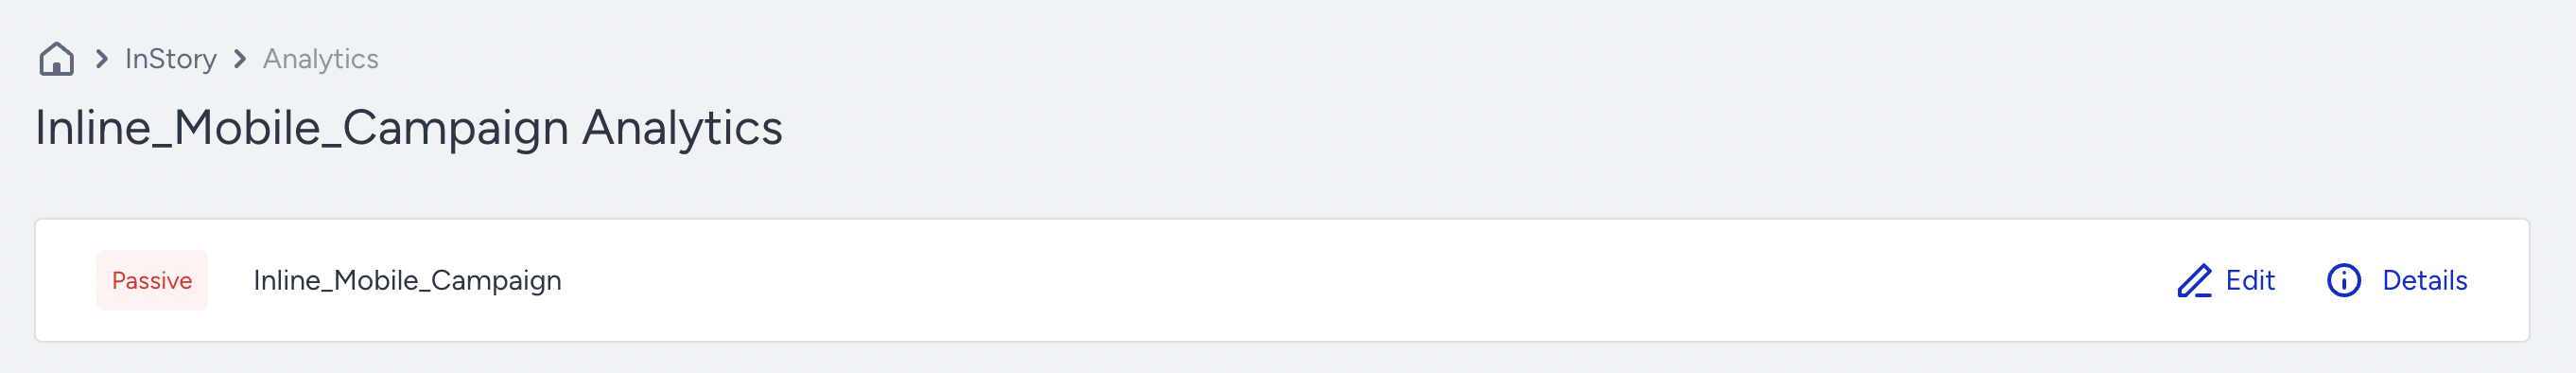
You can reach your campaign page and edit it when you click Edit, or view the details in the side menu when you click Details.
Impression Funnel
You can change the Conversion Criteria and Base Group to see the performance.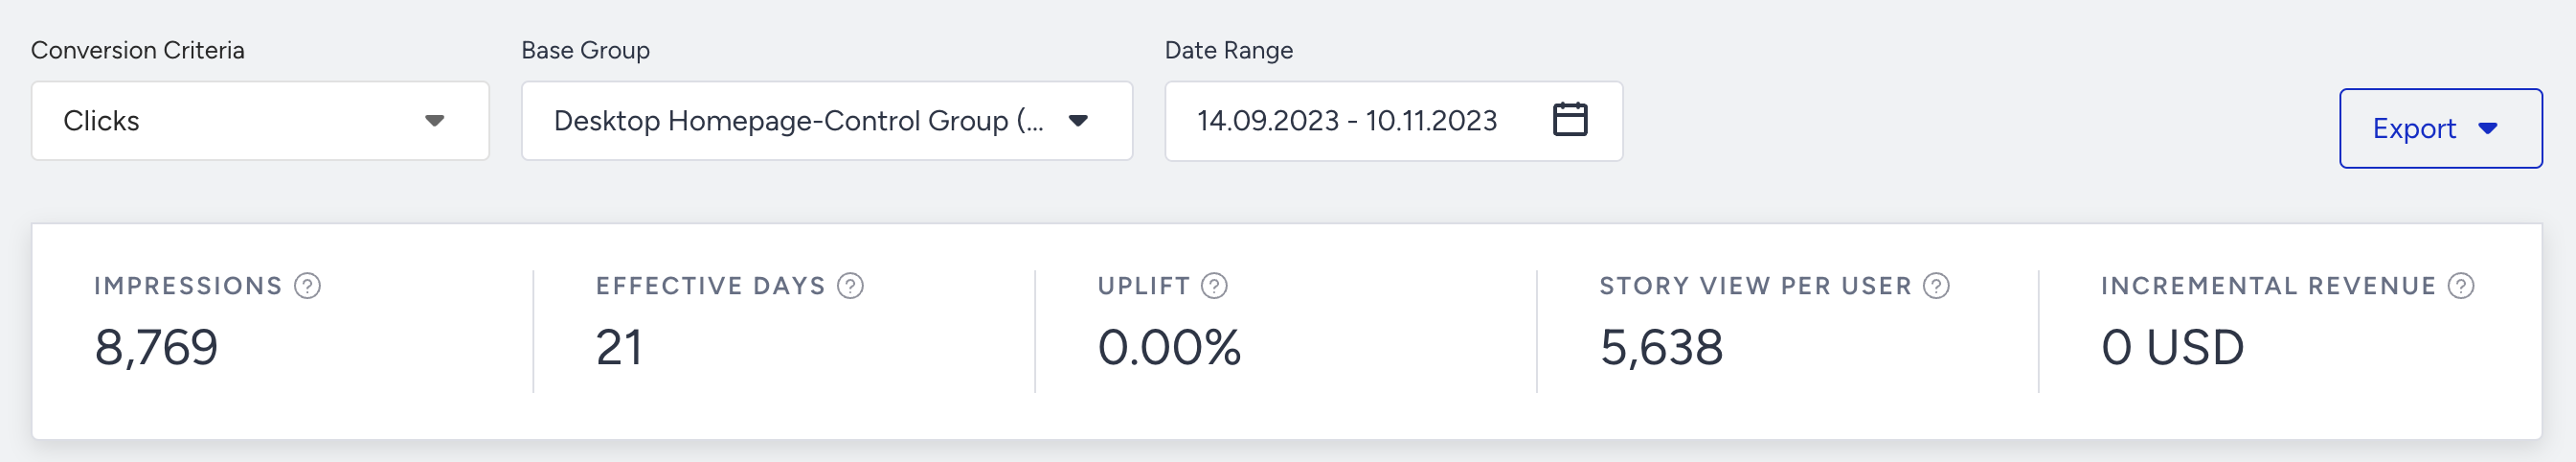
Impressions: The number of times that your users viewed your variant.
Days Active: The number of days at least one variant had been viewed more than 10 times.
Uplift: Conversion Rate uplift of the most successful variant compared to the control group.
Incremental Value: Calculated difference of the most successful variation compared to the control group.
Metrics
You can analyze metrics based on impressions, conversions, and conversion rates on a daily, weekly, or monthly basis.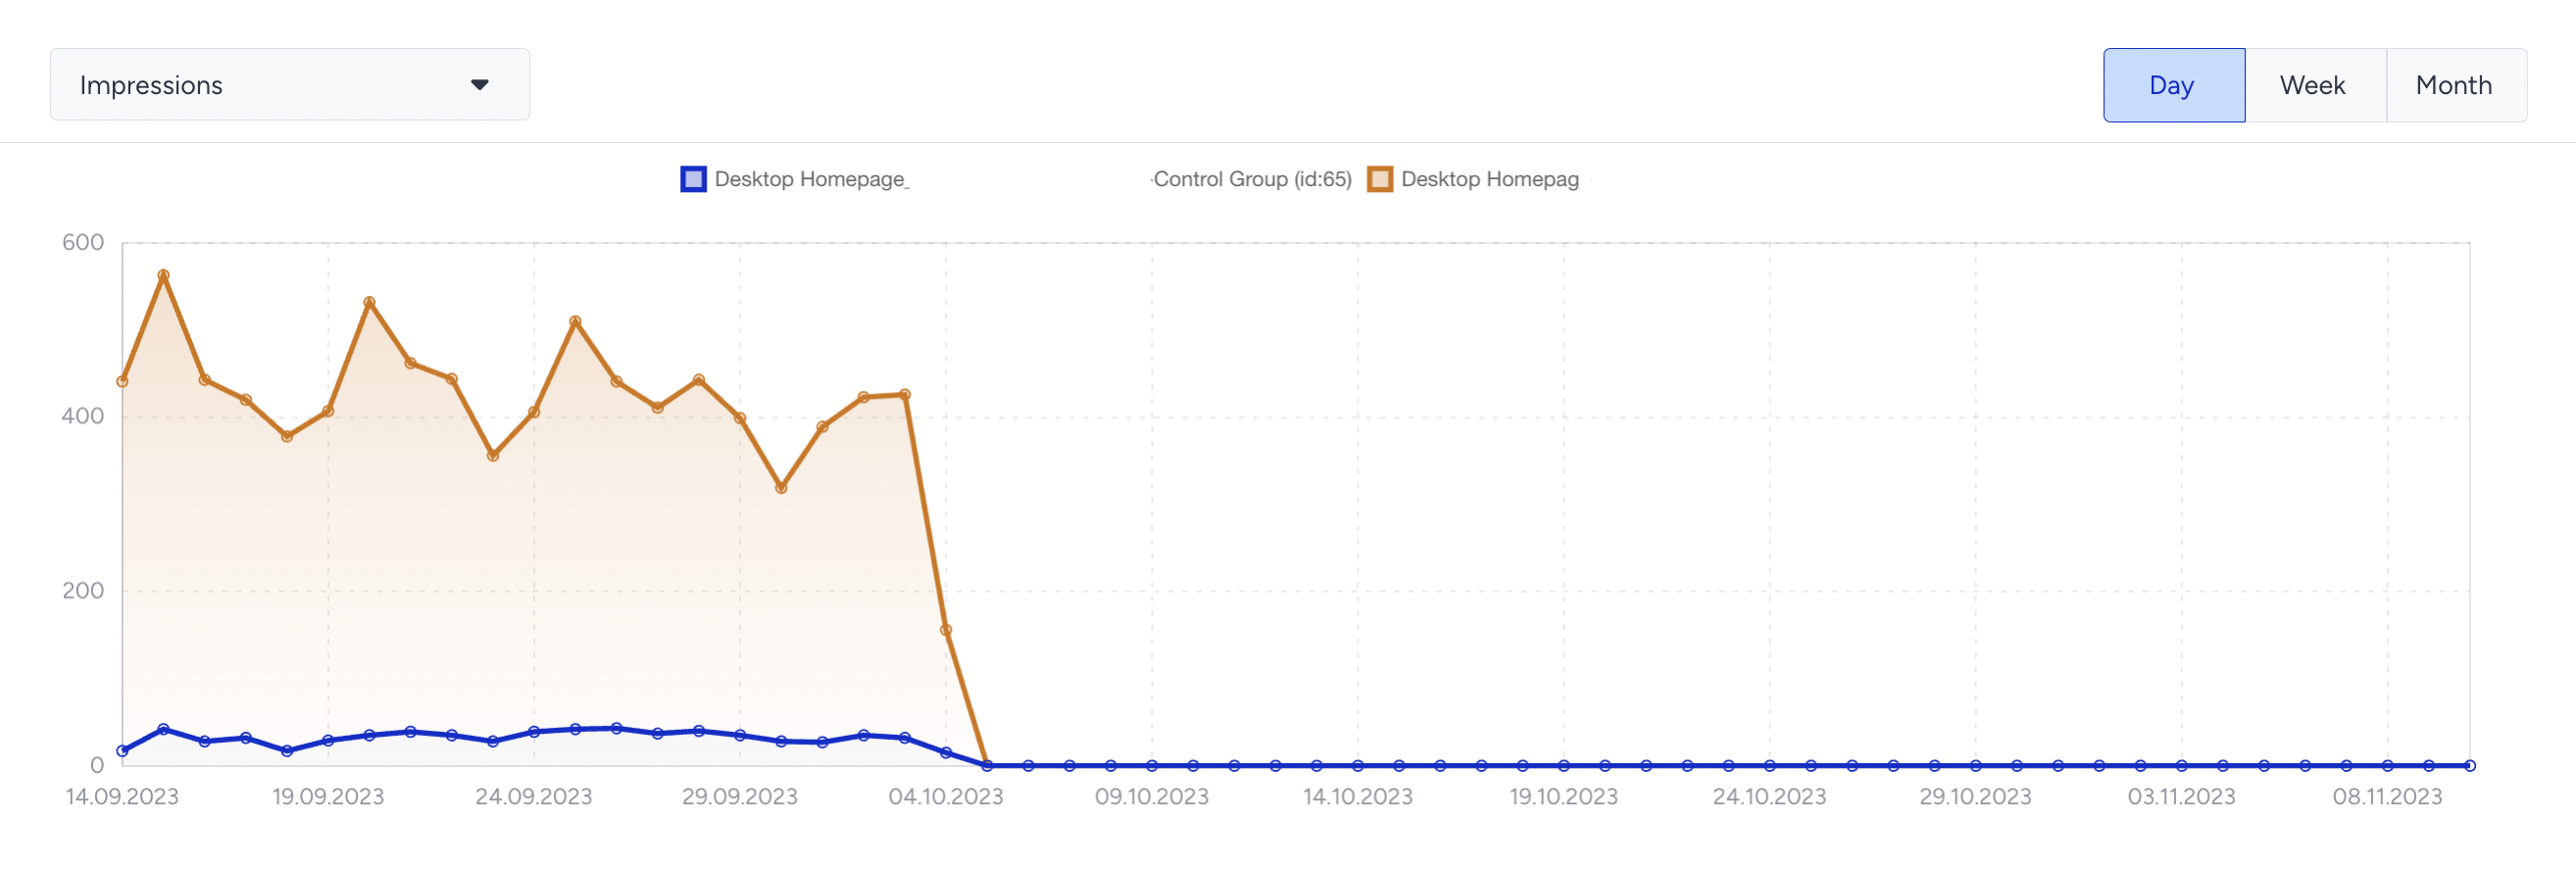
Purchases Goal Metrics
You can select and compare the purchase goals metrics of your variations.
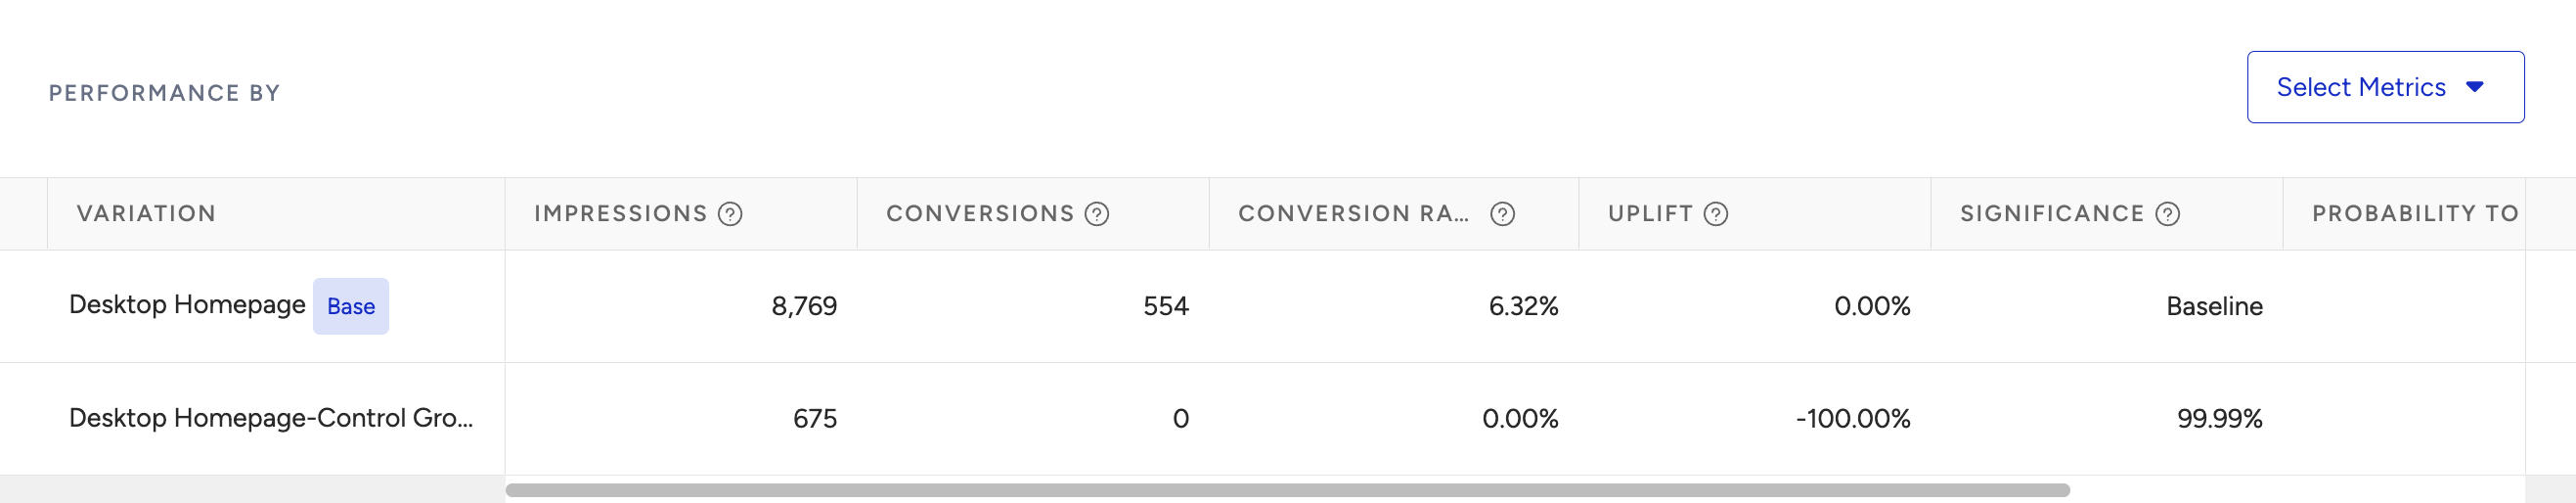
Impression: Number of unique visitors that became part of the variation.
Conversion: Number of successful primary goal conversions.
Conversion Rate: Number of conversions divided by the number of delivered campaigns.
Uplift: Increase in the conversion rate of variation compared to the control group.
Significance: Expressed as a percentage, it indicates whether a campaign or personalization is effective in prompting an action, based on the impressions or uplift.
Probability to Win: Refer to Probability to Win.
Incremental Revenue: Extra revenue from personalization campaigns versus the control group.
InStory doesn’t track story-level analytics in terms of incremental revenue, but it does track revenue at the campaign level.
Incremental Conversion: Extra conversions from personalization campaigns versus the control group.
Revenue: The value of purchases made from your variant.
Average Order Value (AOV): The revenue ratio to the total number of purchases.
AOV Uplift: Percentage of the Average Order Value difference between the variant and the control group.
For further information, refer to Metric definitions.
Story Analytics
Story analytics is only available for Multi Story and Single Story campaigns. It does not apply to Thumbnail and Recommendation Story campaigns.
You can analyze how your users engage with each of your stories.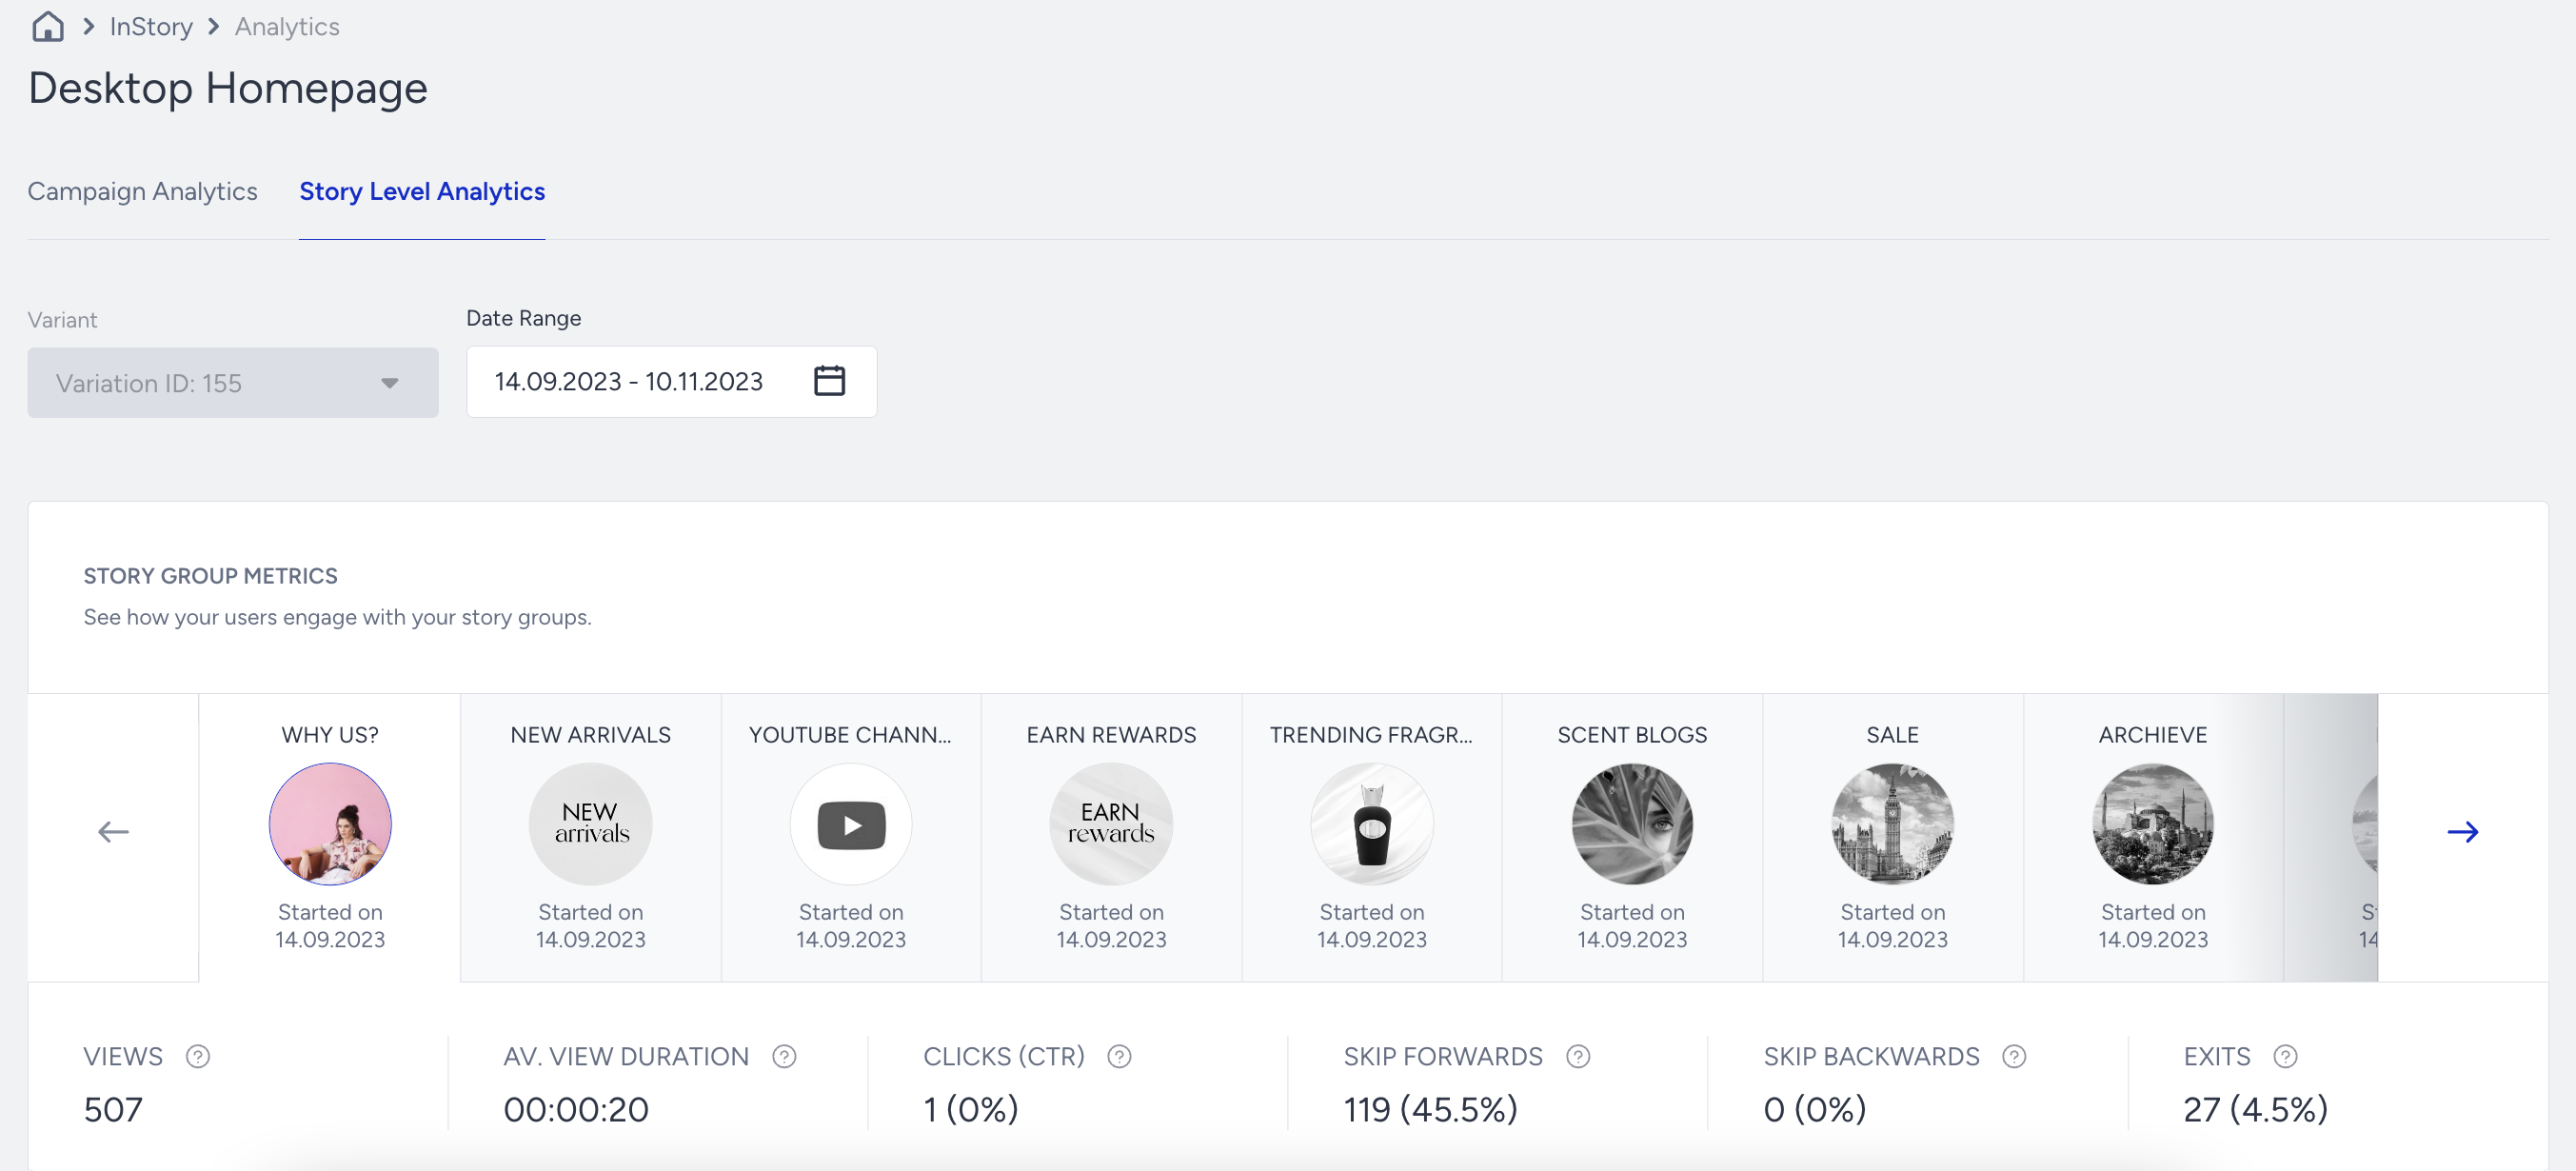
Under Story Level Analytics:
View: Total number of times your story was viewed by your users
Average View Duration: Average amount of time that your users viewed your story
Clicks (CTR): Number of times your users interacted with your story. Click Through Rate (CTR) is the percentage of times that your users interacted with your story to the number of views.
Skip Forwards (Rate): Number of times that your users tapped and passed to the next story. The rate is the percentage of times your users tapped and moved on to the next story, divided by the total number of views.
Skip Backwards (Rate): Number of times your users swiped and passed to the previous story. The rate is the percentage of times your users tapped and passed the previous story, divided by the number of views.
Exits: Number of times your users quit viewing your story.
Why can Campaign Clicks be higher than Story Clicks?
Campaign Clicks and Story Clicks measure different user actions. Campaign Clicks can increase when a user opens the InStory flow from the story thumbnail, while Story Clicks count interactions inside an individual story, such as clicking a CTA button.
Because of this, the two metrics do not need to match. For example, a user may open the InStory campaign from the thumbnail bar and then leave without clicking anything inside a story. In that case, Campaign Clicks increase, while Story Clicks do not.
Story Analytics is story-specific, so it reflects only interactions recorded for the selected story. Actions that only move the user between stories are tracked separately from story click-through interactions.
Advanced Story Metrics
Based on the time range you selected, you can view your story's metric timeline and compare it with other stories.
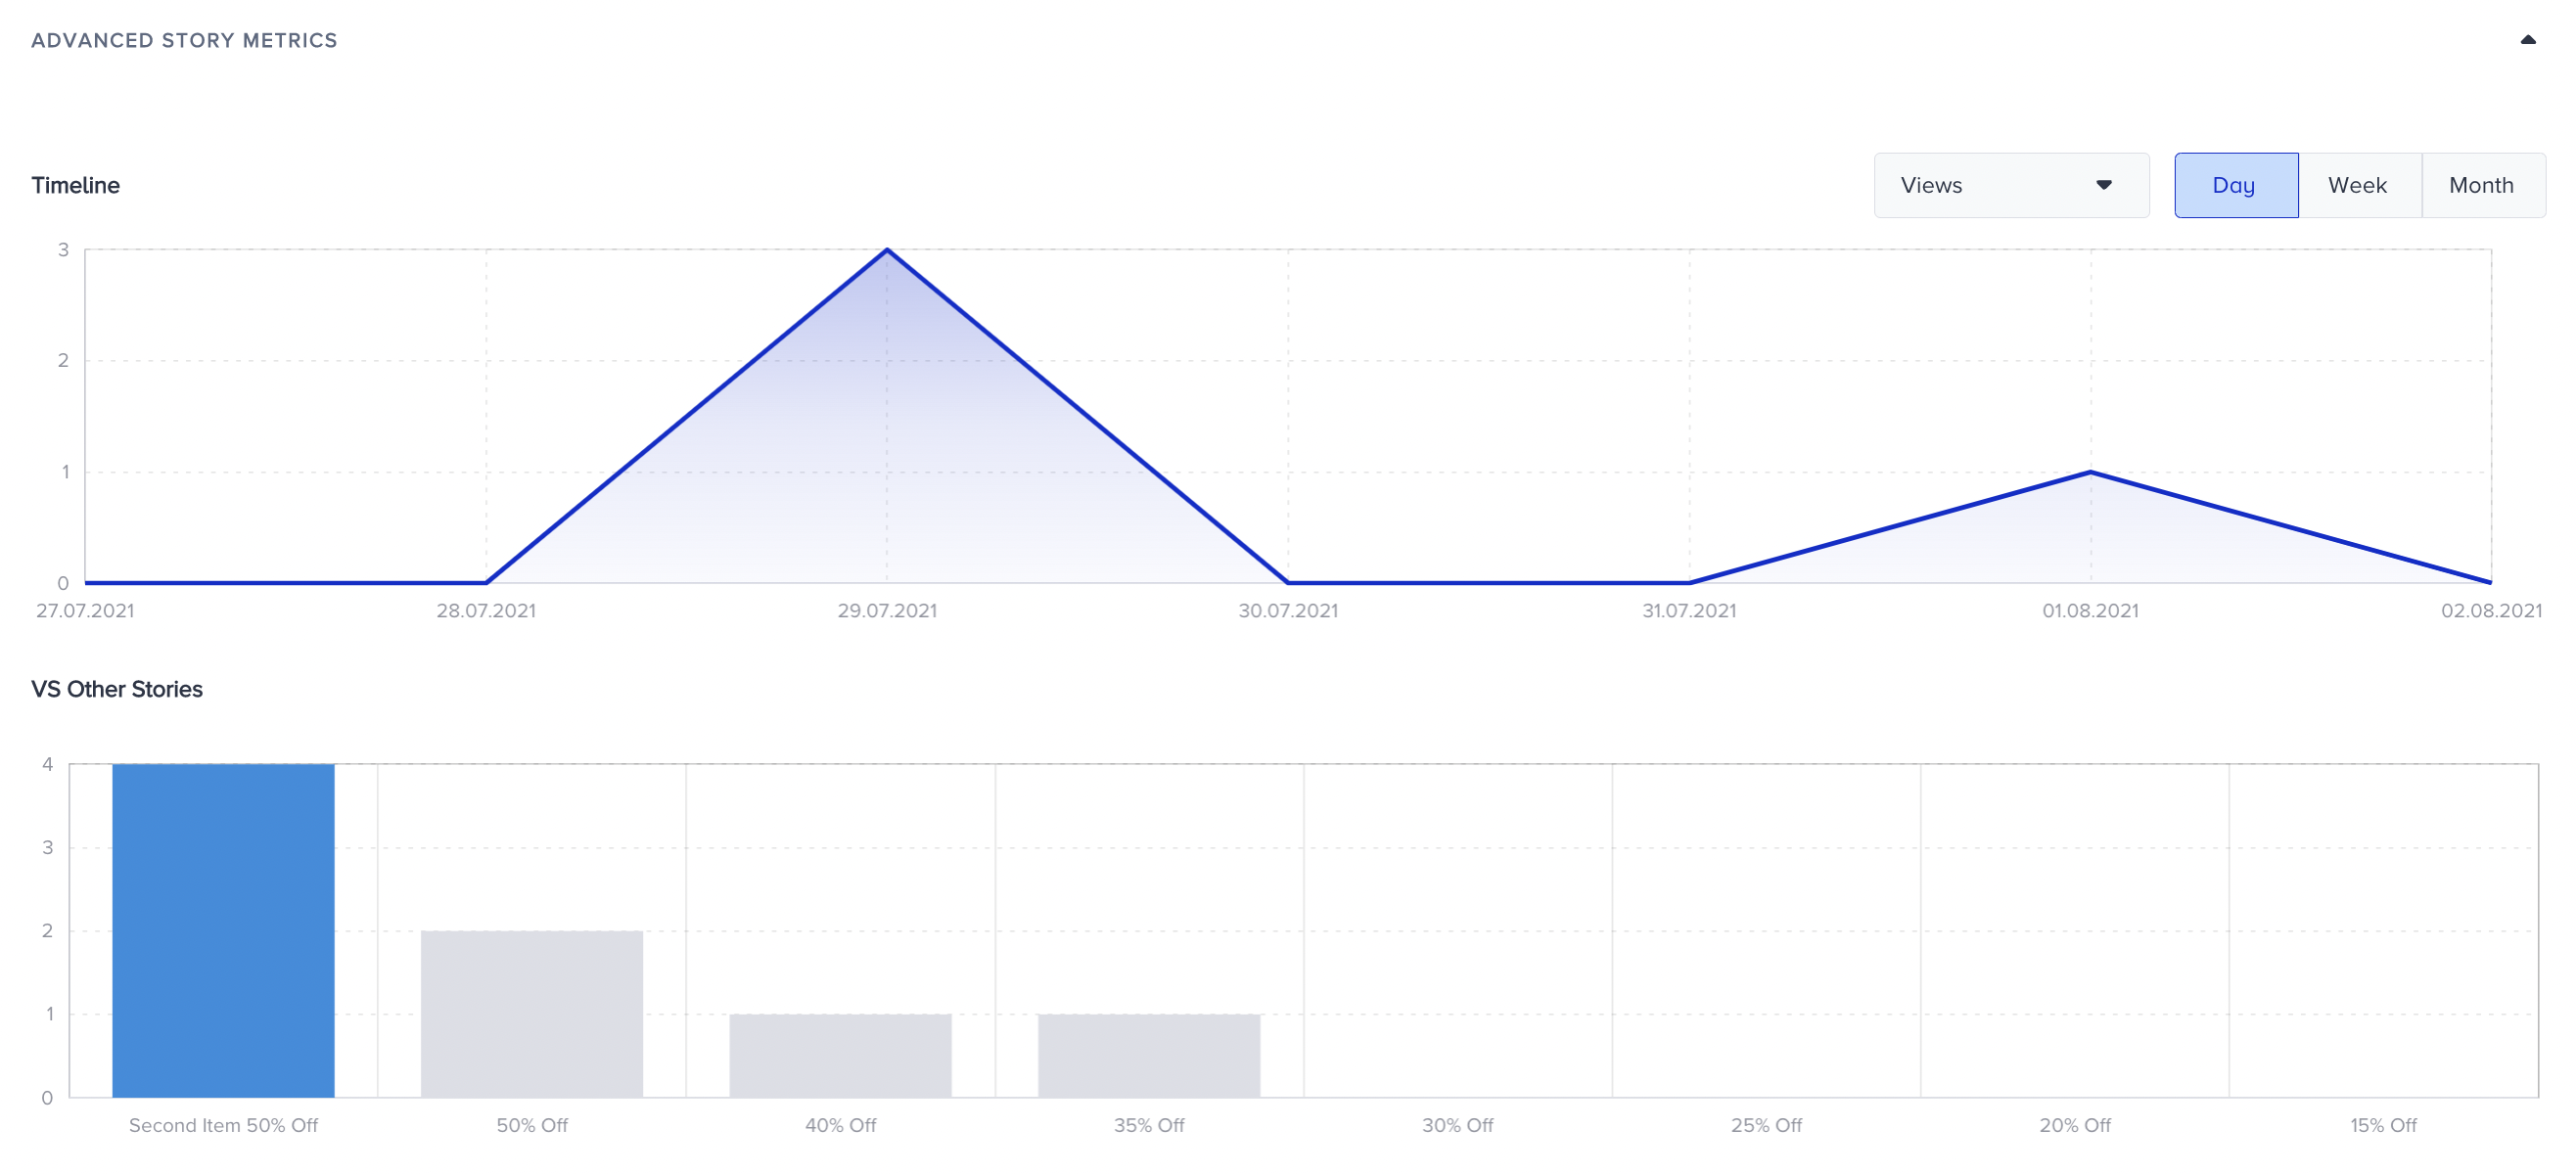
You can also see the results under Advanced Story Metrics if you have elements on your stories.
For the rest of your analytics details, refer to Web Templates Analytics.