The probability to win is the likelihood of a variant to best the other variant(s) in the test. This percentage is calculated by using Bayesian significance, based on the collected data so far. Unlike regular significance, which needs a certain amount of data collection, the Bayesian Significance method analytically generates data to provide relevant results, especially in low-sample campaigns.
We strongly recommend that you duplicate your campaign to make changes to its traffic allocation, goals, segments, or rules to not create any discrepancy in the analytics.
You can see which variant in your campaign is more likely to succeed on both the Executive Summary Dashboard and campaign analytics.
Executive Summary Dashboard
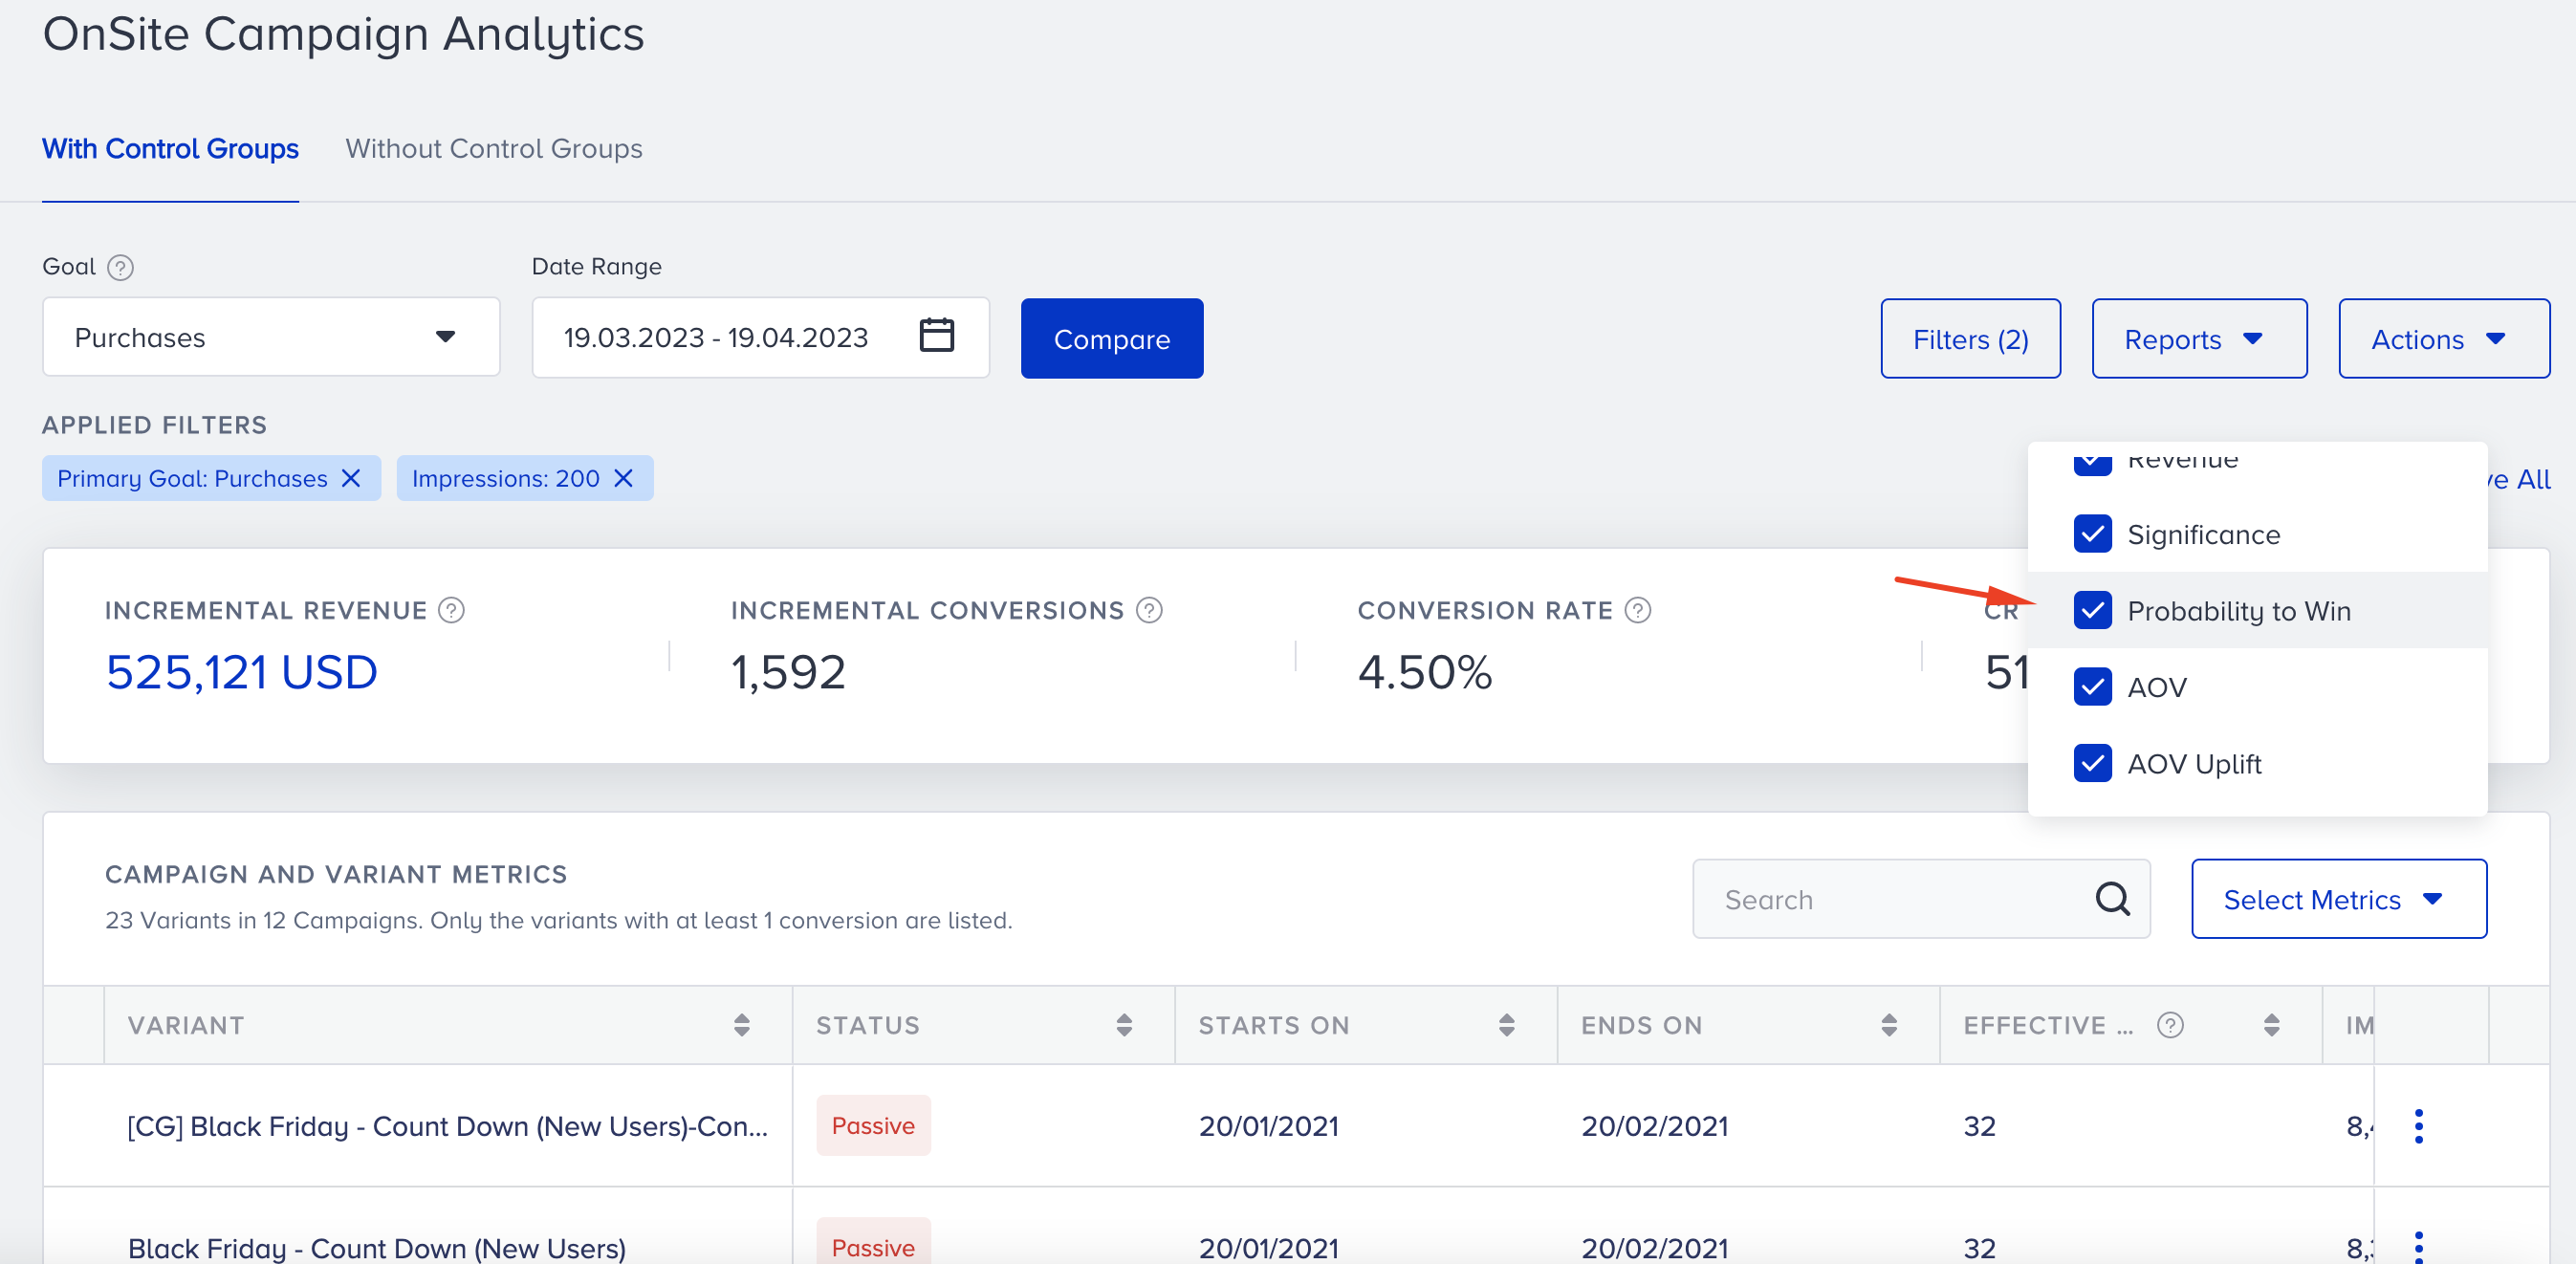
The Probability to Win is one of the metrics that you can track on your dashboard.
1. Go to your Campaign Analytics > Personalizations with Control Group.
2. Probability to Win is auto-selected in the metrics. Select/deselect it.
3. Scroll to the right to see the respective column if it is not visible.
4. Sort your campaigns based on Probability to Win, if needed.
Campaign Analytics
You can see the probability to win of your variants on the campaign-level statistics as well.
1. Go to the statistics page of your campaign using the menu on the executive summary dashboard or campaign listing page.
Menu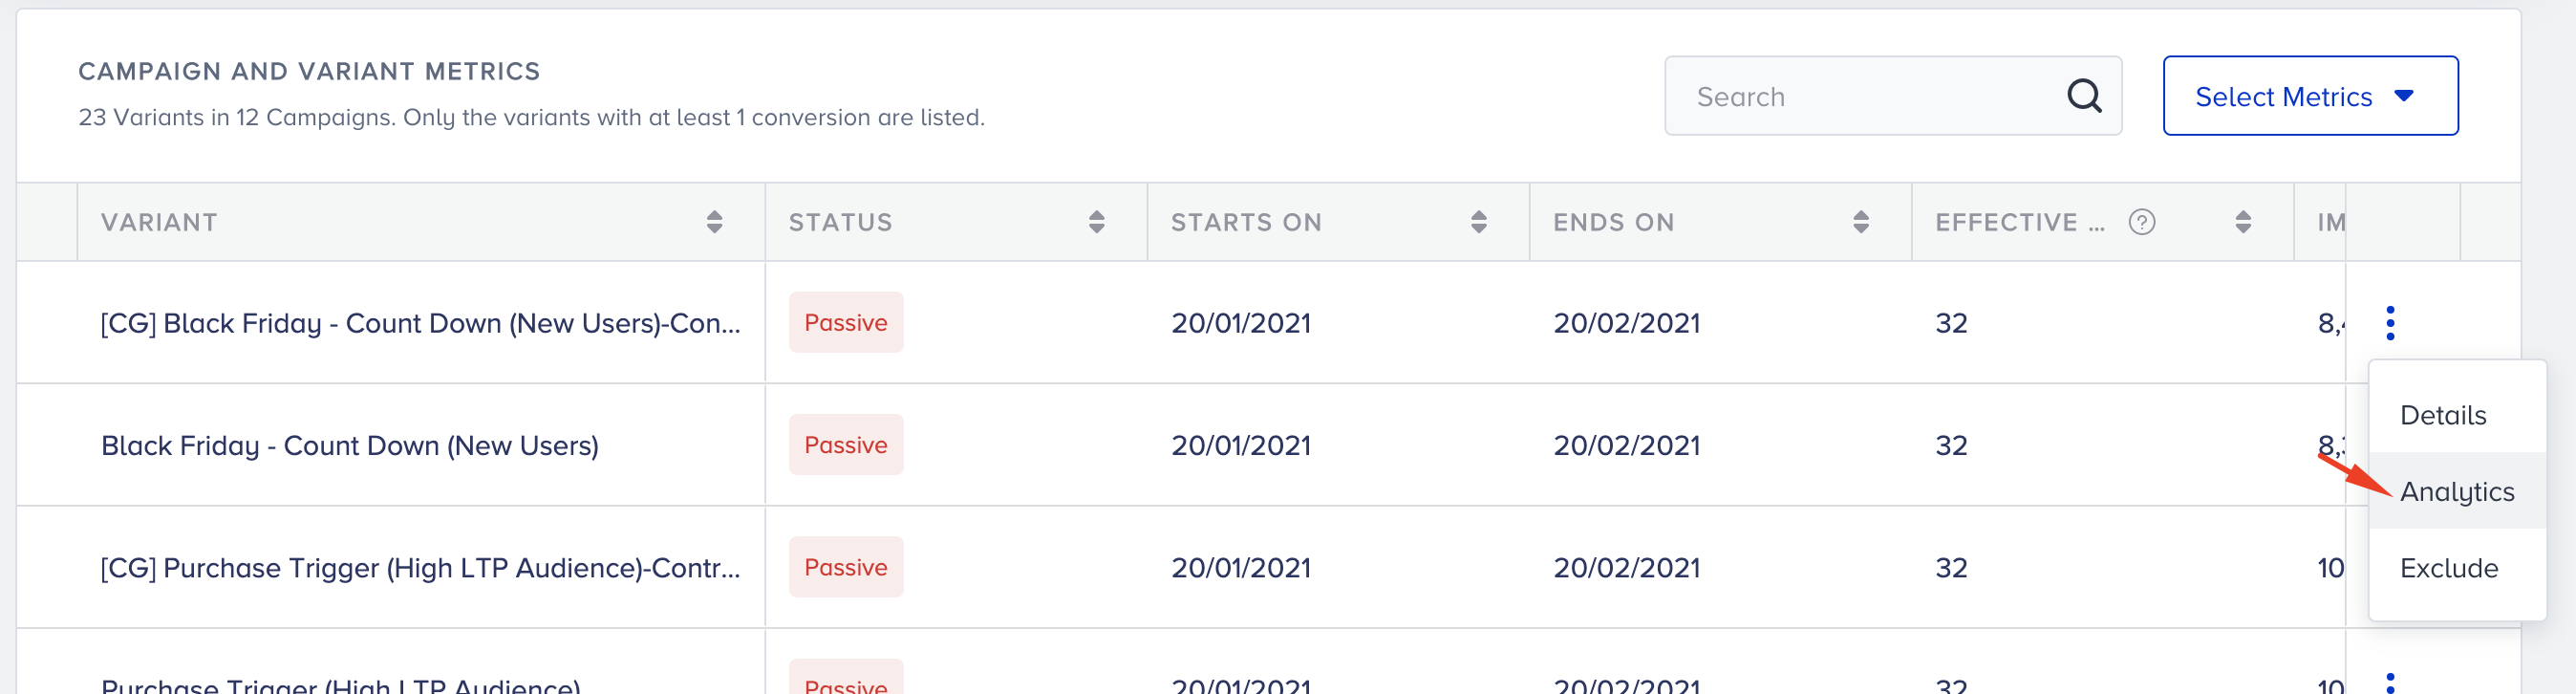
Listing page
2. Select or deselect the probability to win metric.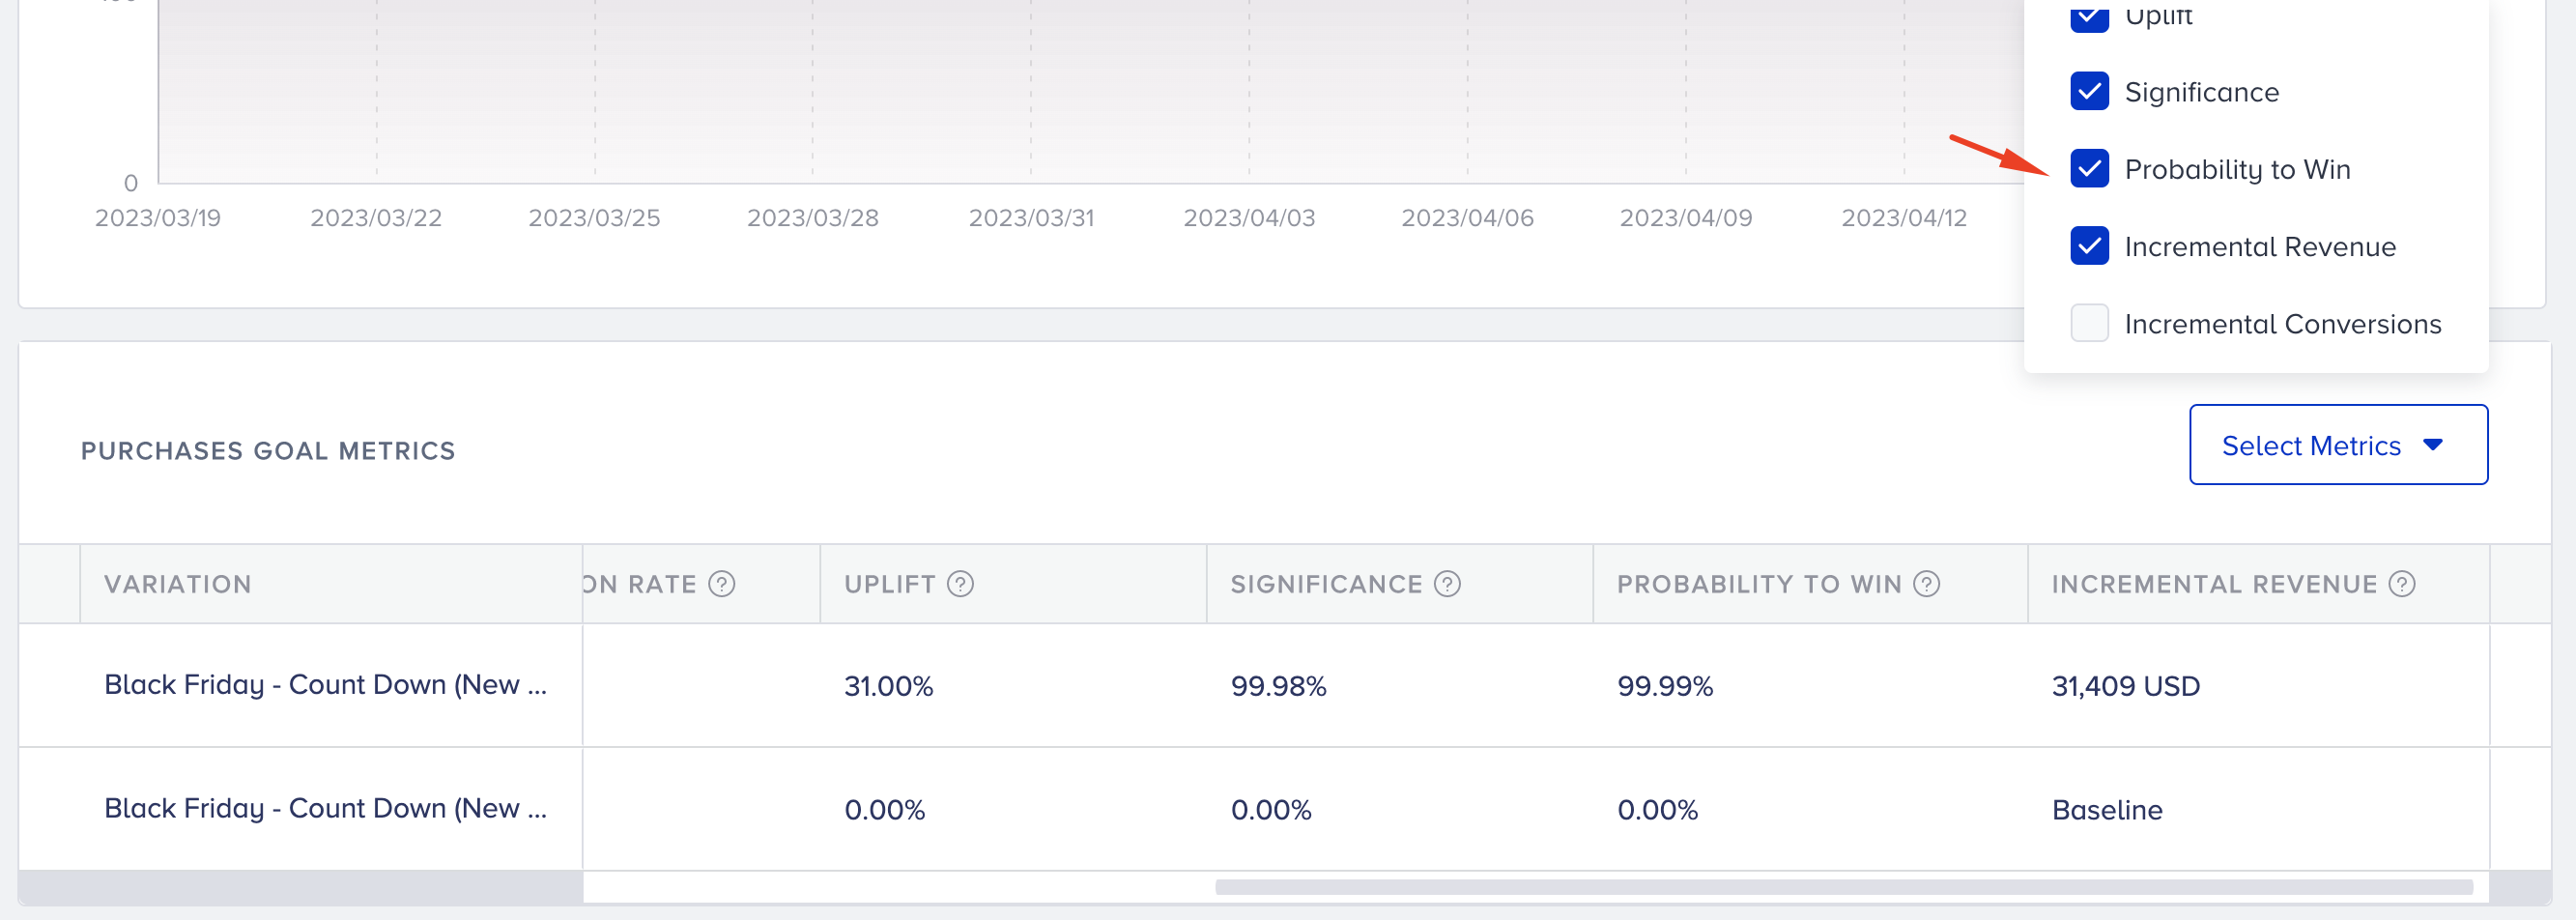
3. You can see the variant with the highest probability to win.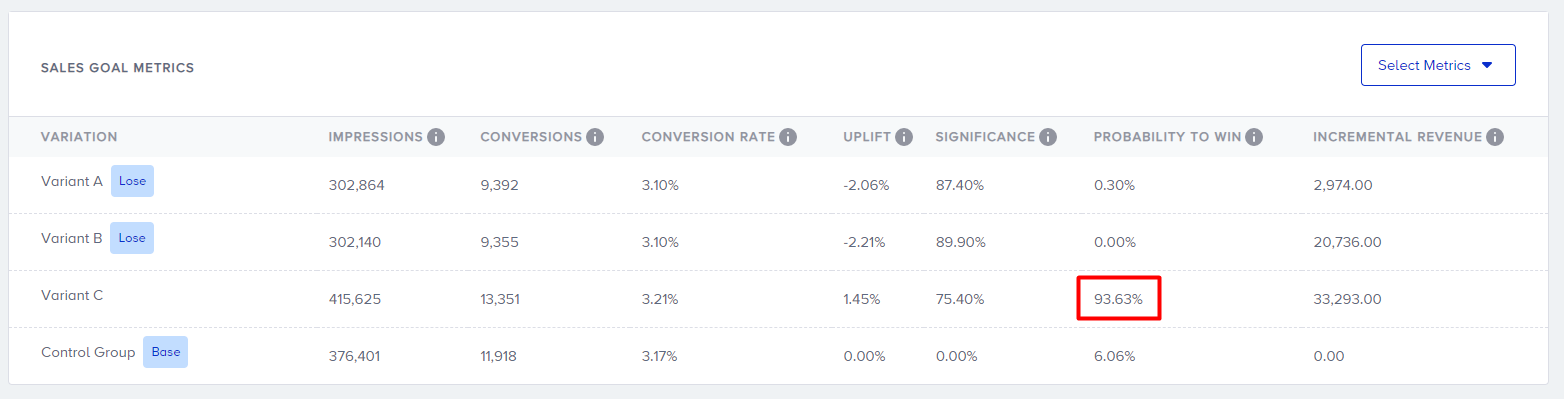
You can watch this short and fun video to get a better understanding of the probability to win: