The Campaign-Level App Push Analytics page provides real-time insights about your app push campaign and helps you better understand your campaign strategy.
You can narrow down the campaign filters on this page to see more related data.
This guide explains the following:
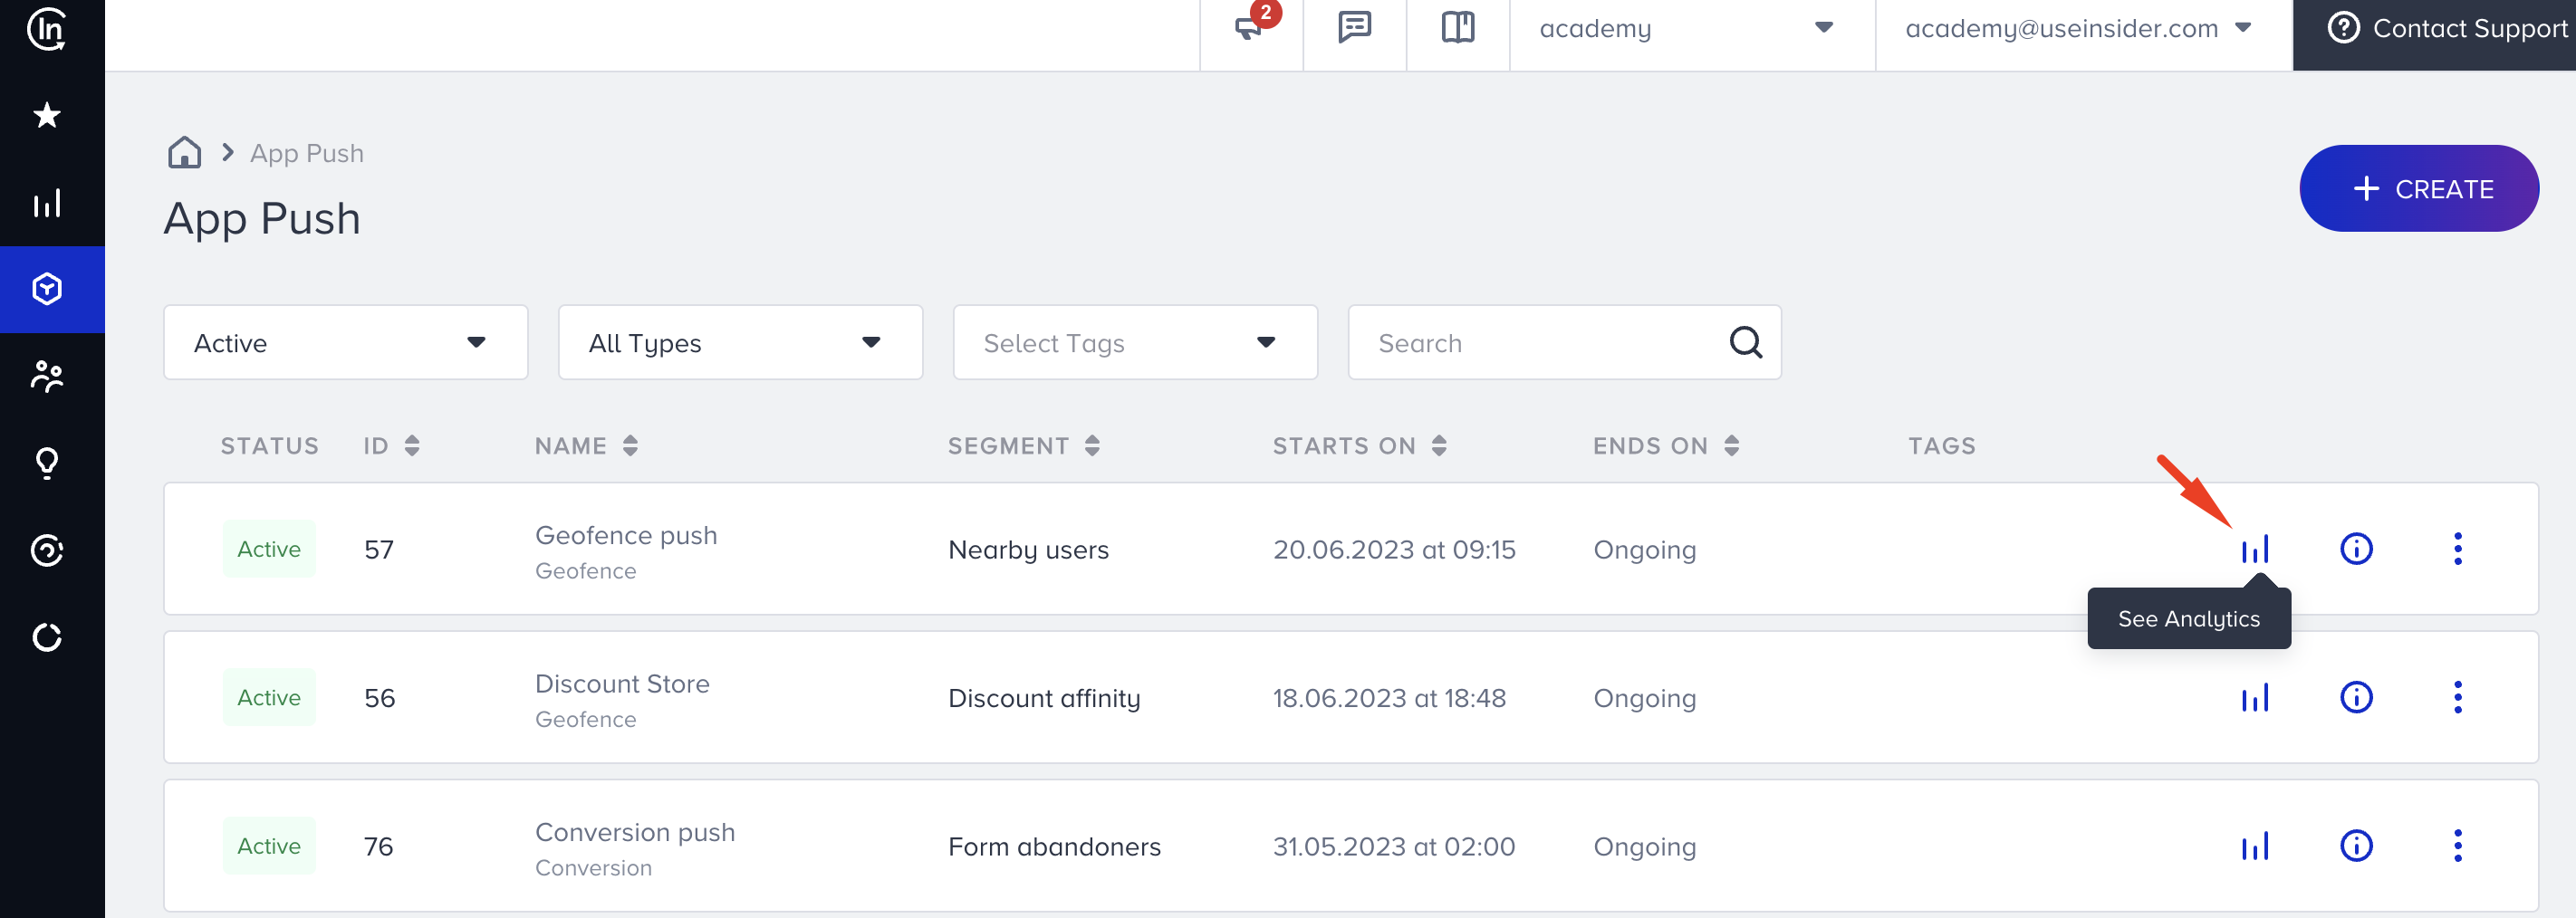
To see your analytics, click the See Analytics button against the campaign you want to see details about.
The analytics dashboard consists of four sections: Pre-filters, Summary Metrics, Pie Chart & Graphs, and Variant List.
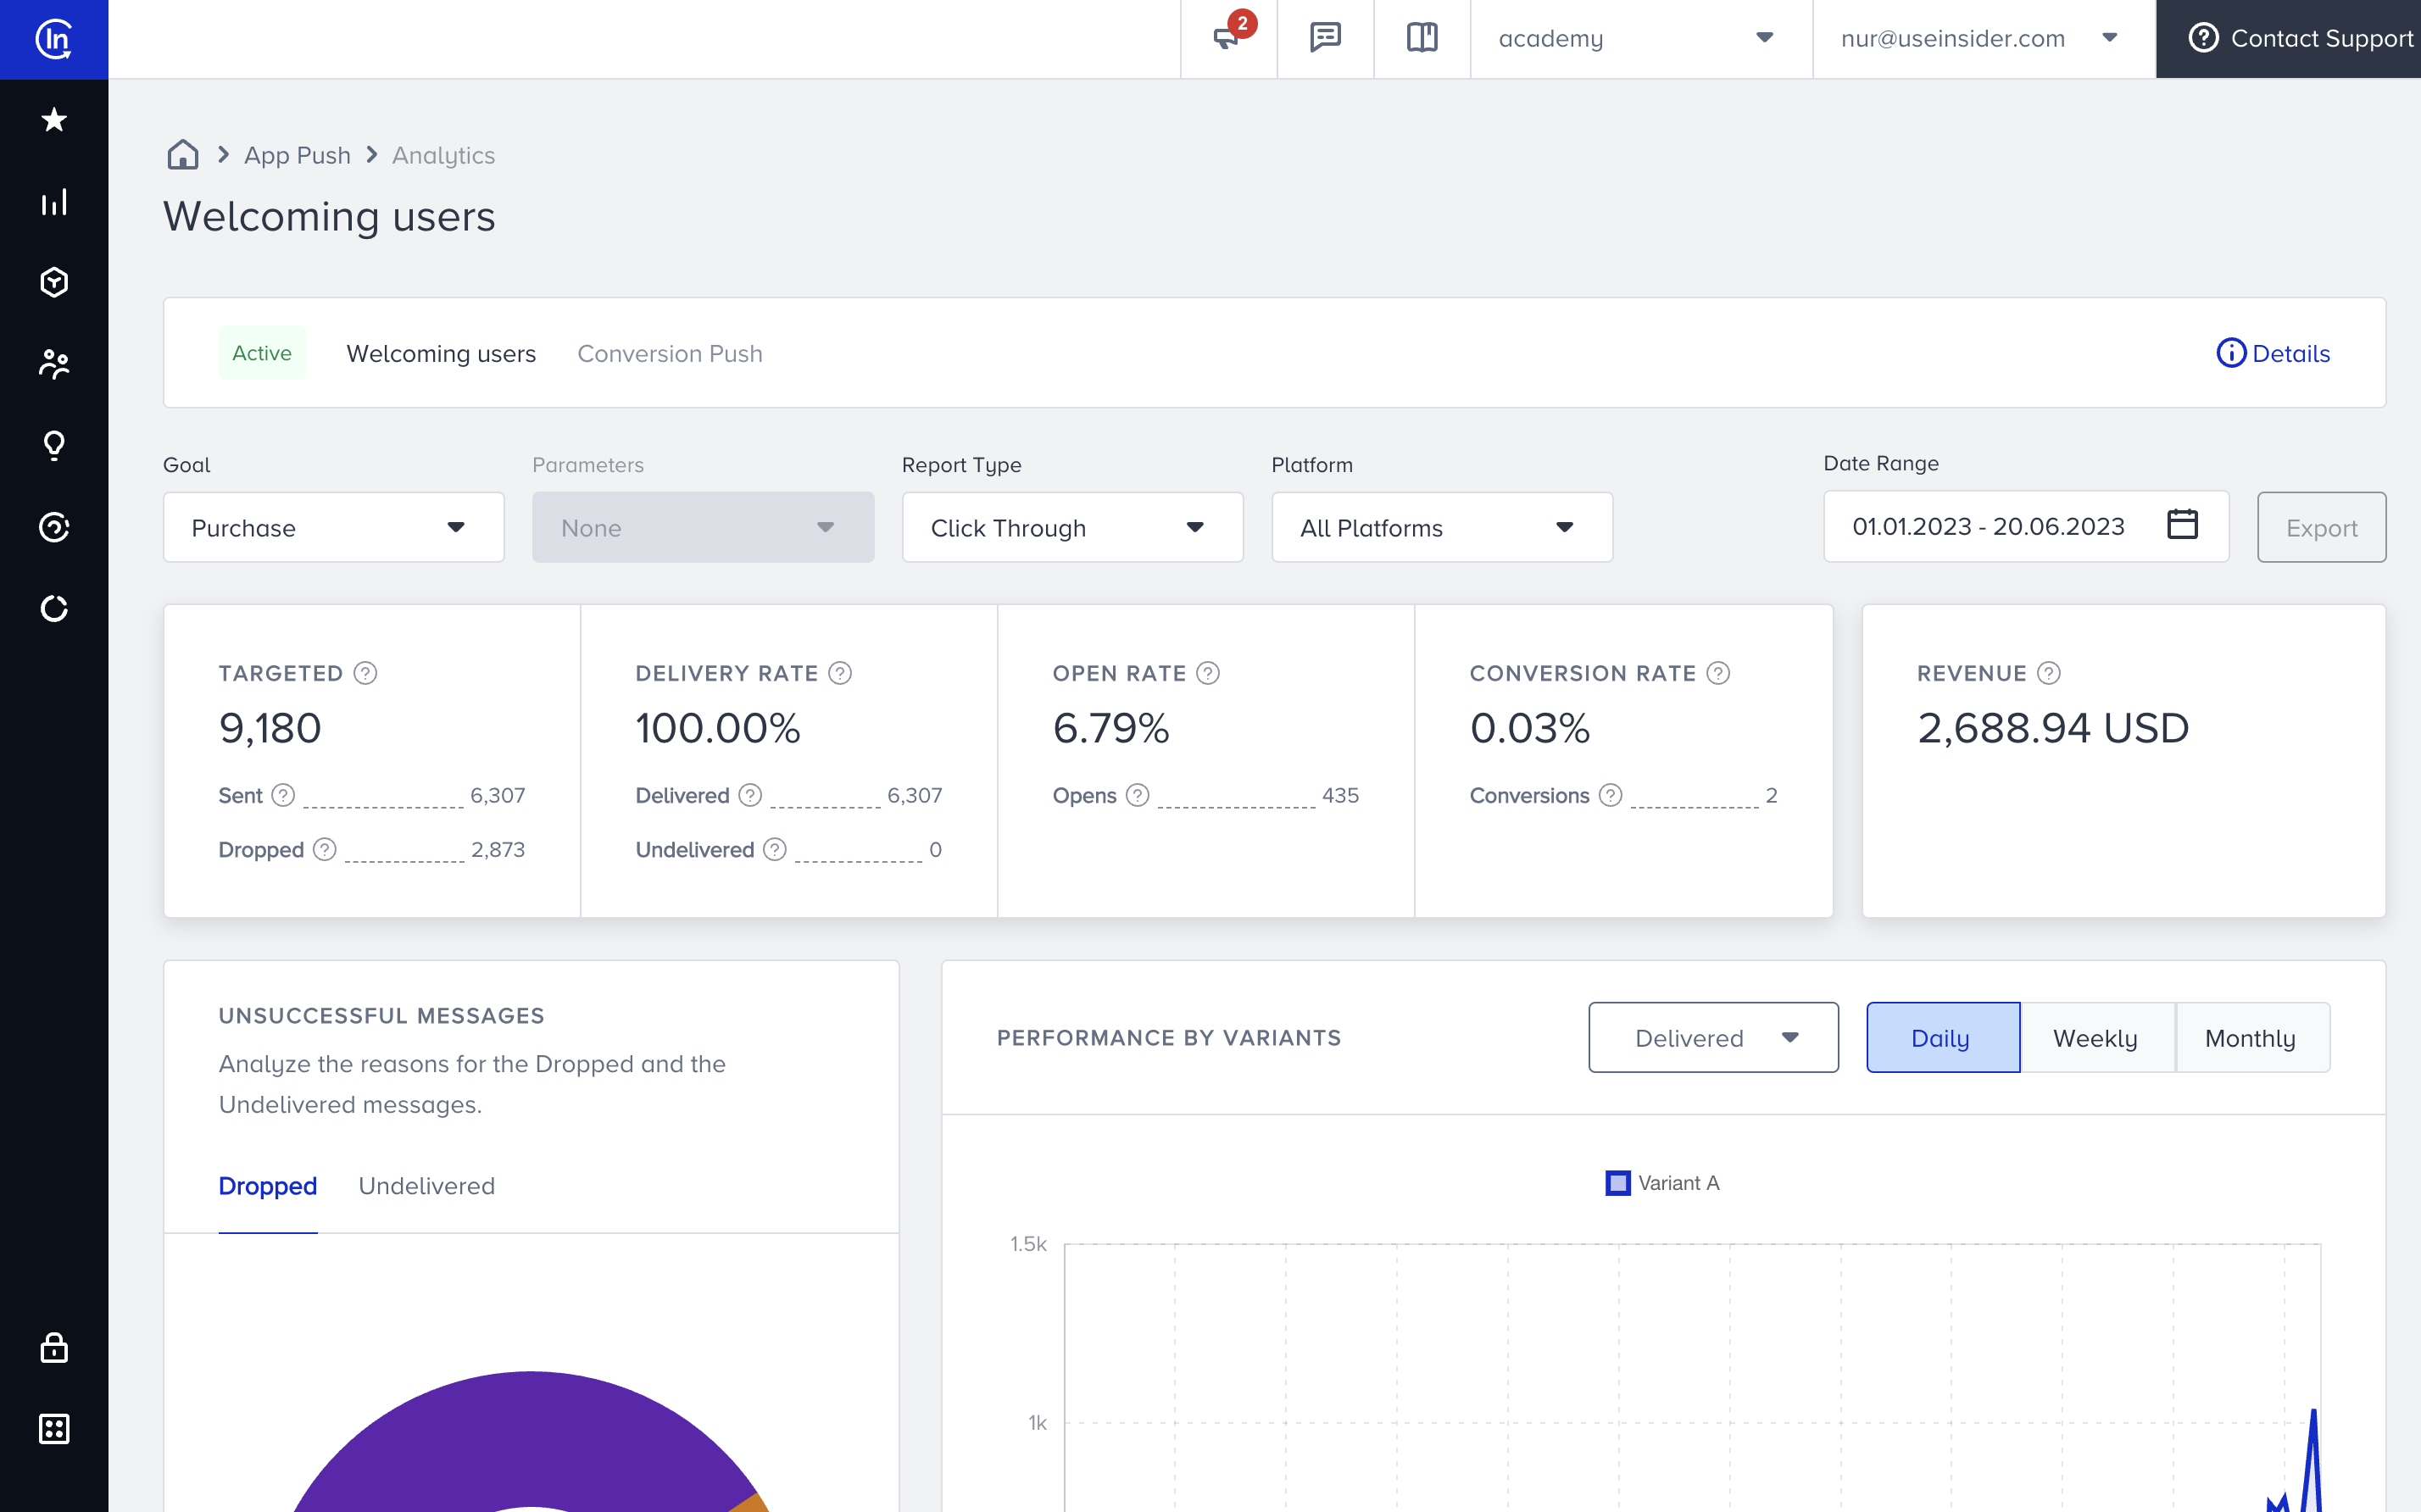
Pre-filters
You can apply Goal, Report Type, Platform, and Date Range pre-filters to your data to see the related insights. Each filter has a default selected option. You can change these preferences to view the respective data.
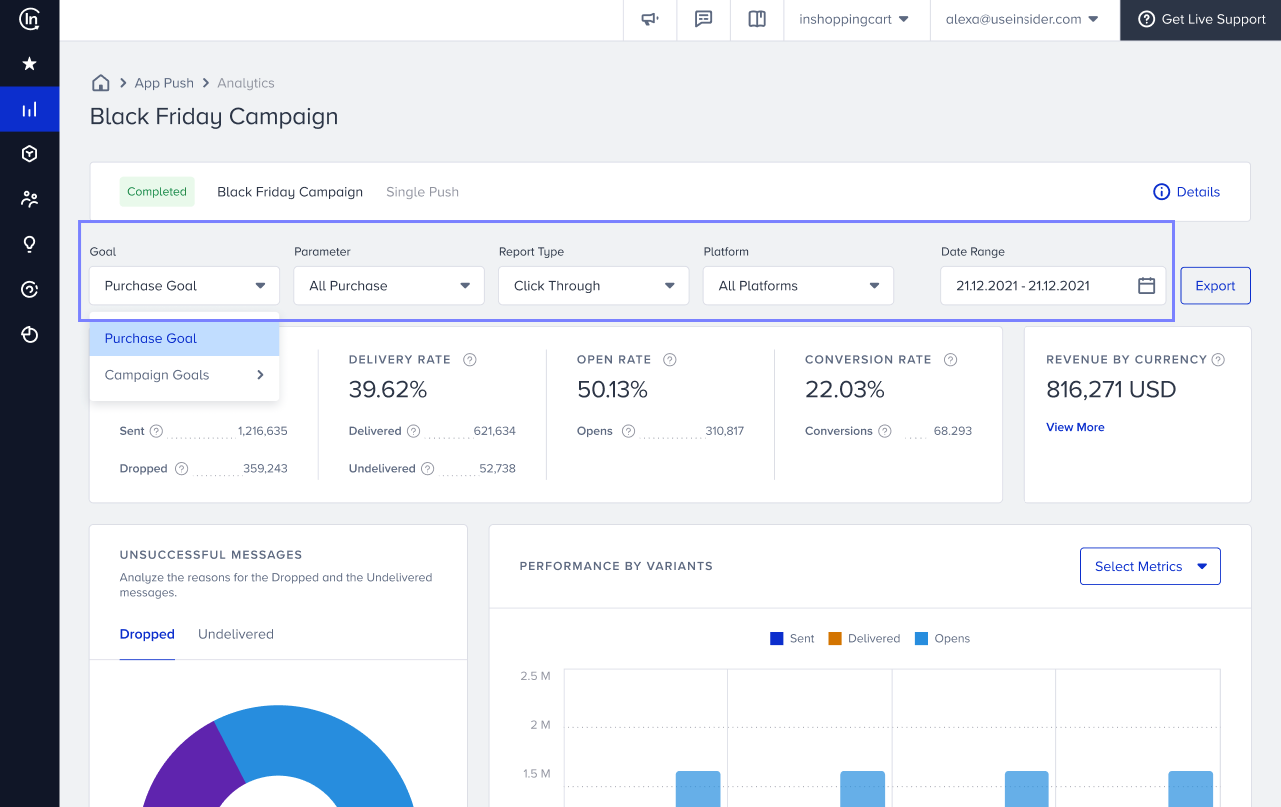
Goal
This option allows you to calculate your conversions via the selected event. Only the defined campaign goal metrics for the respective campaign are listed in this dropdown. Conversions and Conversion Rate are calculated based on the selected event.
Platform
You can see three platform options: All Platforms, iOS, and Android. The results are sorted by device platform type.
Date Range
You can select specific date ranges to view your data. When you choose a different time range, if there is any metric data for the respective campaign, it is displayed on the page and contributes to the metrics overall.
The date picker is unavailable in the Single, Carousel, Slider, and Discovery pushes. The data displayed on the dashboard is between the campaign's start date and 30 days.
Summary Metrics
The summary metrics are above the graphs. These are the most important metrics for your app push campaigns and help you get an overall idea of them.
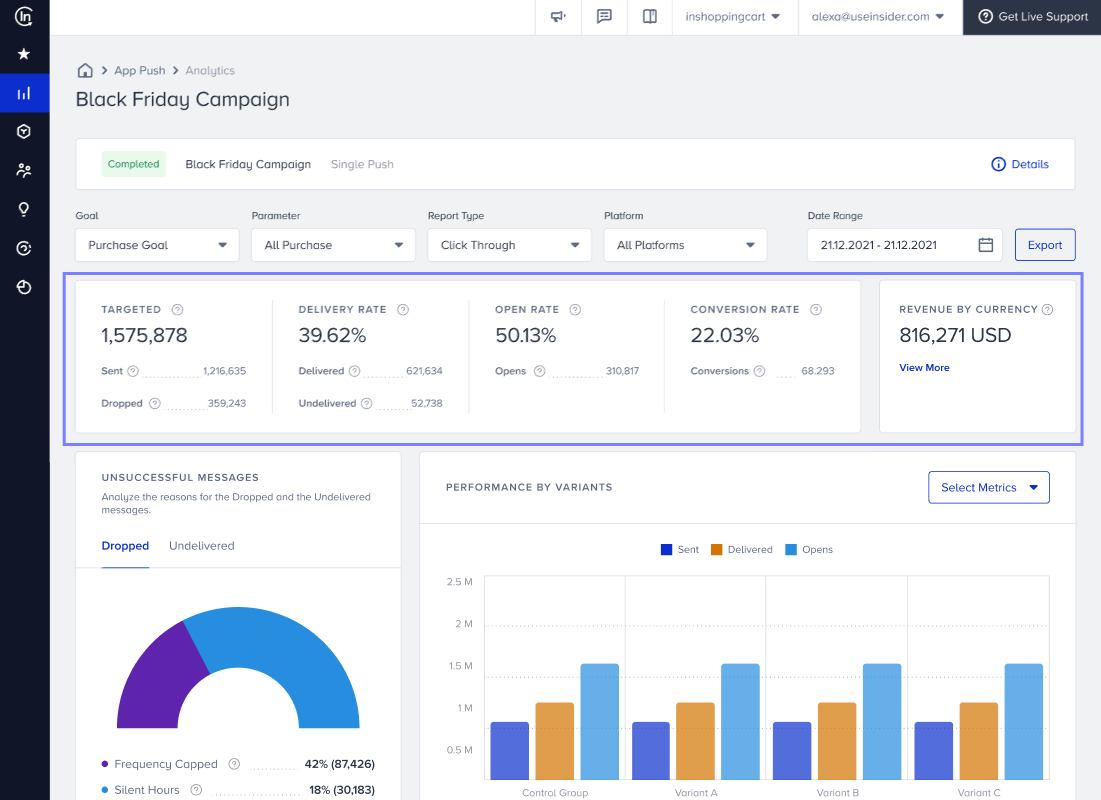
Summary metrics are Targeted, Delivery Rate, Open Rate, Conversion Rate, and Revenue.
- Targeted: The number of recipients in your target audience generated based on the segmentation of your campaigns. Targeted is the sum of Sent and Dropped.
- Sent: The number of app push messages successfully transferred to the service provider to be addressed to the recipients. Sent is the sum of Delivered and Undelivered messages.
- Dropped: The number of app push messages that were not transferred to the service provider to be addressed to the recipients.
- Delivery Rate: The percentage of the Delivered to the Sent app push messages. Delivery Rate is Delivered/Sent.
- Delivered: The number of app push messages successfully transferred to the recipients.
- Undelivered: The number of app push messages that were not addressed to the recipients by the service provider.
- Open Rate: The percentage of Opens to the Delivered app push messages. Open Rate is Opens/Delivered.
- Opens: The number of app push messages opened by the recipients.
- Conversion Rate: The percentage of Conversions to the Delivered app push messages. Conversion Rate is Conversions/Delivered.
- Conversions: The number of successful goal accomplishments.
- Revenue: The value of purchases made via your app push message.
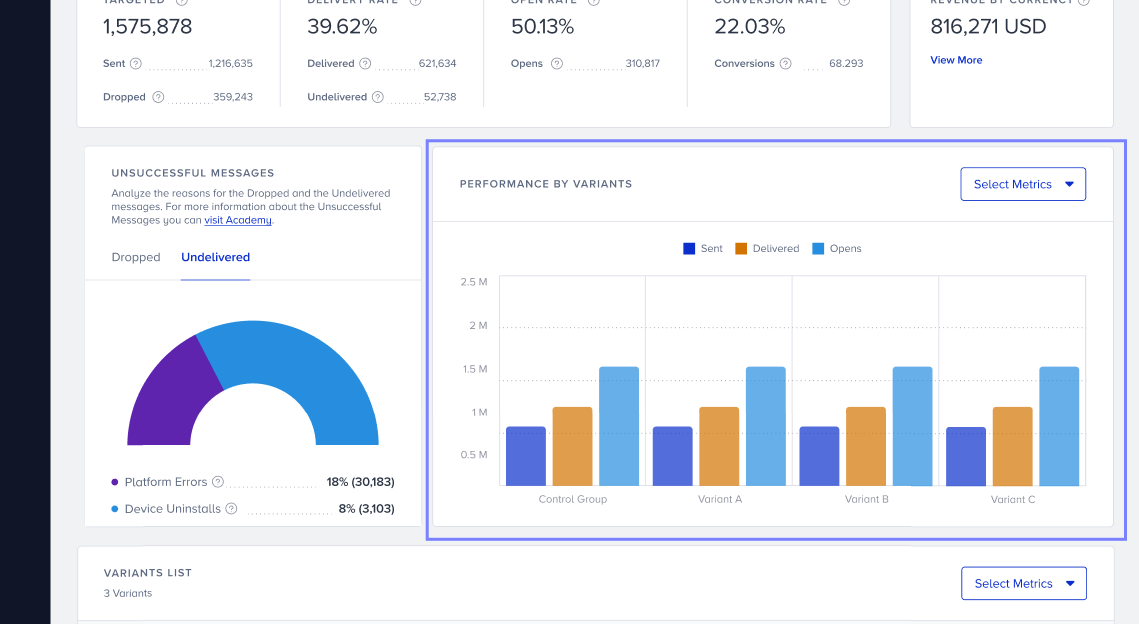
Unsuccessful Messages
The pie chart view provides insight into push notifications that were not successfully delivered to users. It shows how many messages failed and why, allowing customers to better understand delivery issues and take action using segmentation.
Unsuccessful messages are grouped into two categories:
- Dropped
- Undelivered
Each category contains detailed breakdowns and generates real-time events that reflect the true delivery status of every push.
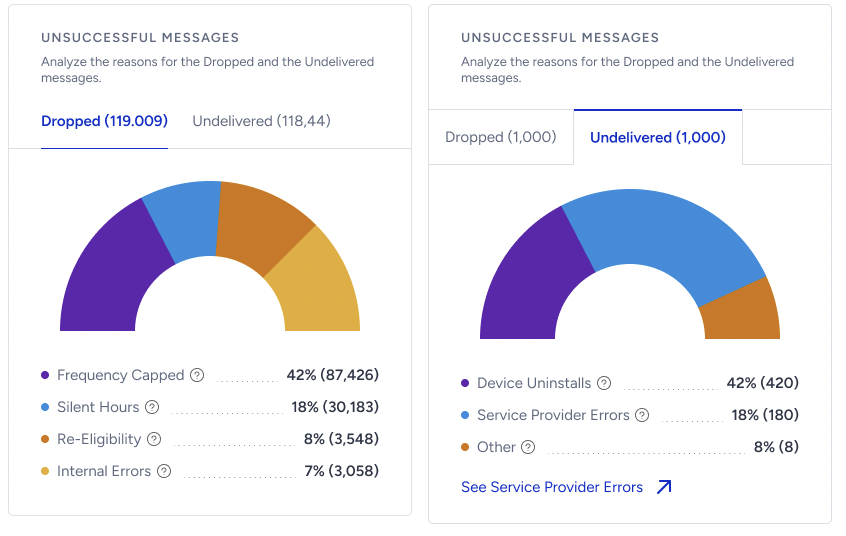
Dropped
A push is marked as Dropped when it is blocked by campaign or channel rules before it is sent to the device.
Dropped messages can occur due to:
- Silent Hours: The percentage (and the number) of dropped messages due to the Silent Hours settings.
- Re-Eligibility: The percentage (and the number) of dropped messages due to the Re-Eligibility settings.
- Frequency Capped: The percentage (and the number) of dropped messages due to the Channel Frequency Capping settings.
- Internal Errors: The percentage (and the number of) dropped messages due to various internal system errors.
Each of these appears as a separate item in the Dropped tab and is also recorded in push events.
Undelivered
A push is marked as Undelivered when it is sent to a device but fails to arrive.
Undelivered messages can occur due to:
- Device Uninstalls: The percentage (and the number) of undelivered messages due to the recipients who uninstalled your app from their devices.
- Other: The percentage (and the number) of undelivered messages due to unknown system or client issues.
- Service Provider Errors: The percentage (and the number) of dropped messages unexpectedly rejected by Google, Apple, and Huawei servers.
The Service Provider Errors modal provides detailed visibility into technical delivery failures, including error type, operating system, and push service provider.
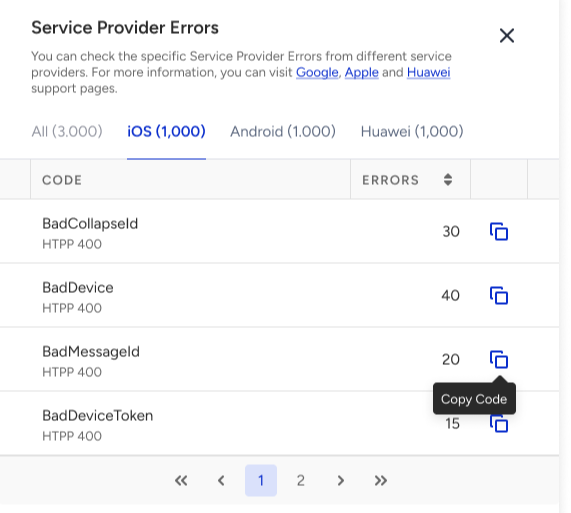
This allows customers to identify issues such as provider outages, operating system-specific failures, or misconfigured credentials.
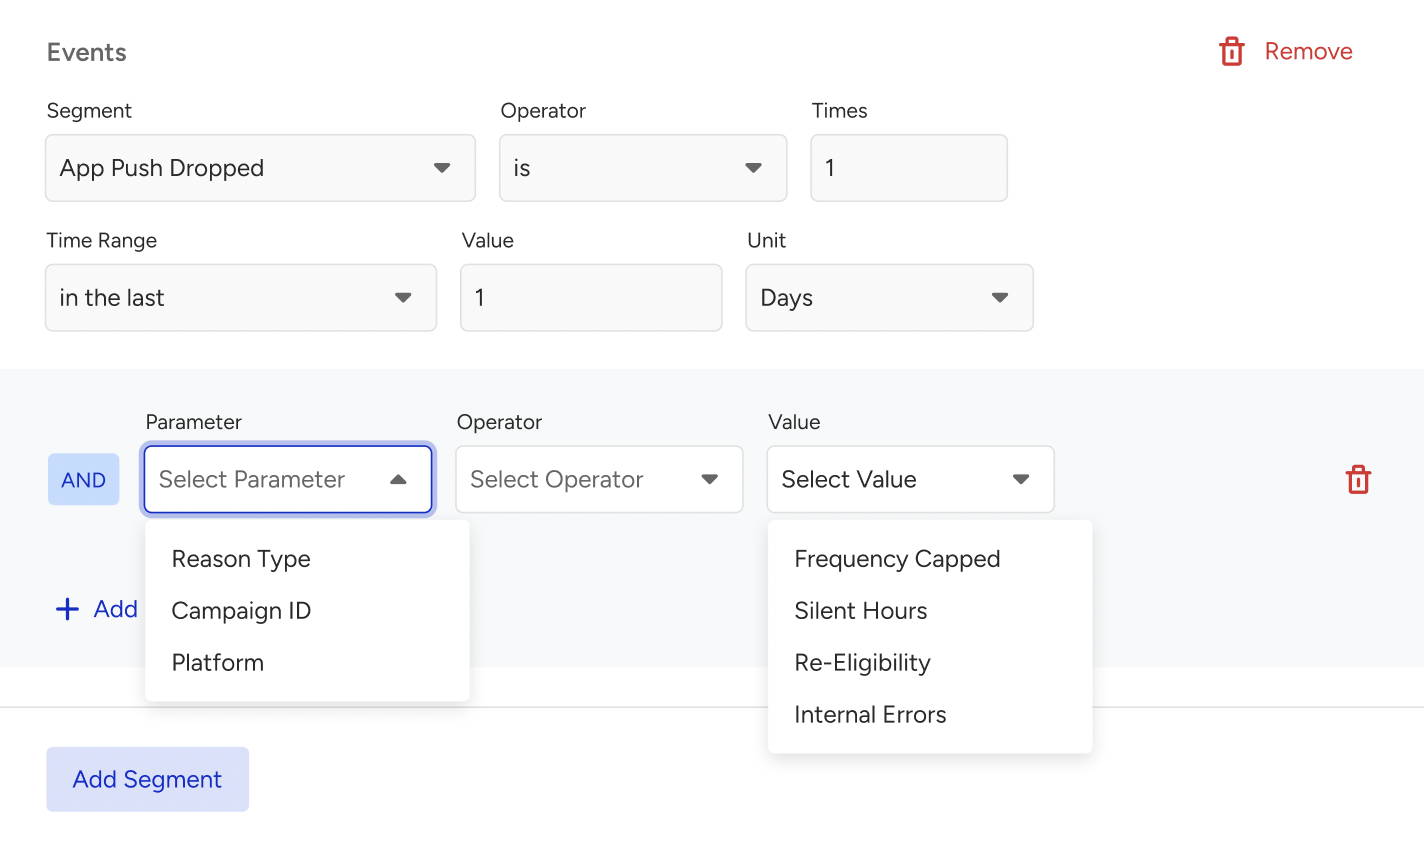
Every push generates one of the following real-time events based on its actual outcome: Delivered, Dropped, or Undelivered. For Dropped and Undelivered pushes, the event includes an issue type parameter (e.g., Silent Hours, Uninstall, or Provider Error).
These events are logged to the user profile, and you can build audiences based on these delivery outcomes and failure types. Such segmentation enables precise retargeting, suppression, and troubleshooting flows in real time. For example, you can segment:
- Users whose pushes were dropped due to frequency capping
- Users whose pushes failed due to provider errors
- Users whose devices are no longer reachable
Any device uninstalls between two ghost pushes will show on the campaign-level analytics. Refer to App Uninstall Analytics for further information on uninstalls.
Performance by Variants
You can view your campaign's Sent, Delivered, and Opens metrics based on the selected date range. This graph helps you see these metrics with a variant breakdown.
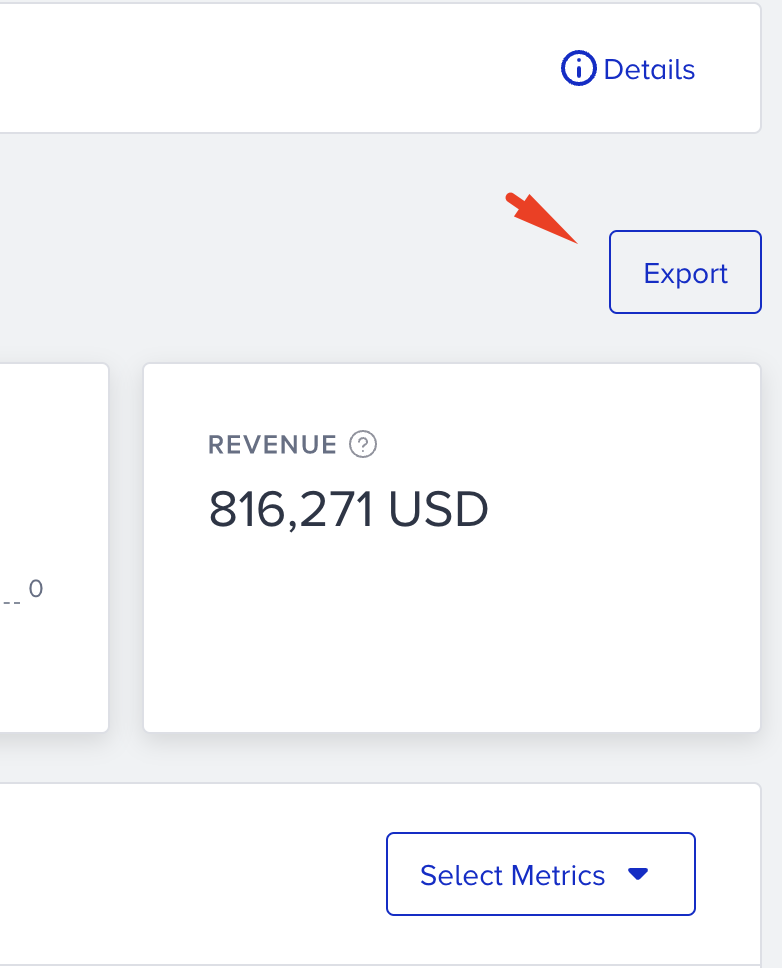
Variant List
The Variant List displays all details belonging to the respective campaign with a breakdown of variants. This table also includes the selected pre-filters, goals, and date range.
You can select the metrics you want to see via the Select Metrics option in the top right corner.
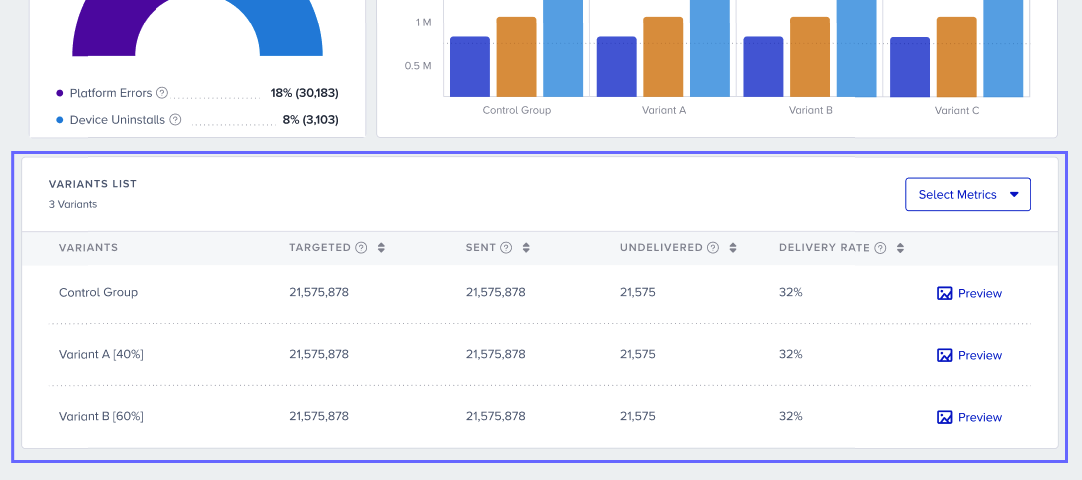
This table displays the following details and metrics:
- Variants: Variant names listed in this column. It can be a Control Group or a Variant.
- Targeted: The number of recipients in your target audience generated based on the segmentation of your campaign.
- Sent: The number of App Push messages successfully transferred to the service provider to be addressed to the recipients.
- Dropped: The number of App Push messages that were not transferred to the service provider to be addressed to the recipients.
- Re-eligibility: The percentage (and the number) of Dropped messages due to the Re-Eligibility settings.
- Silent Hours: The percentage (and the number) of the Dropped messages due to the Silent Hours settings.
- Delivery Rate: The percentage of the Delivered to the Sent App Push messages.
- Delivered: The number of App Push messages successfully transferred to the recipients.
- Undelivered: The number of App Push messages that were not addressed to the recipients by the service provider.
- Delivery Issues: The percentage (and the number) of Undelivered messages due to various errors on recipients’ devices.
- Device Uninstalls: The percentage (and the number) of Undelivered messages due to the recipients who uninstalled your app from their devices.
- Open Rate: The percentage of the Opens to the Delivered App Push messages.
- Opens: The number of App Push messages opened by the recipients.
- Conversion Rate: The percentage of Conversions to the Delivered App Push messages.
- Conversions: The number of successful goal accomplishments.
- Uplift: The increase or decrease in the performance compared to the control group.
- Significance: Statistical significance shows if the user's change in behavior (conversion) results from the test or is due to chance. Statistically significant variations indicate that the A/B/n test was successful.
- Revenue: The value of purchases made via your App Push messages.
- Primary Goals: The goal selected as Primary Goal for the App Push campaign.
- Segment: The segment used for the App Push campaign.
- Rule: The rule used for the App Push campaign.
- Starts On: The date the campaign started.
- Ends On: The date the campaign ended.
- Tags: The tag(s) used for the App Push campaign.
Export
To export your analytics, click the Export button. The exported report will be sent to your email address.