The Overall Analytics page provides the total performance, key information, and value of your Insider campaigns across all products on a dedicated analytics page. This dashboard helps you get an overview of your marketing initiatives carried out within Insider and their impact. It eliminates the need to manually search through different analytics pages to gather an overall Insider report.
The dashboard contains metrics in three main categories:
It shows summary metrics for OnSite, Web Push, Architect, Email, SMS, WhatsApp, and Smart Recommender campaigns.
Overall Performance
This section displays the number of campaigns, total revenue, total conversions, total conversion rate, total conversion rate uplift, and total incremental revenue metrics for the selected date range.
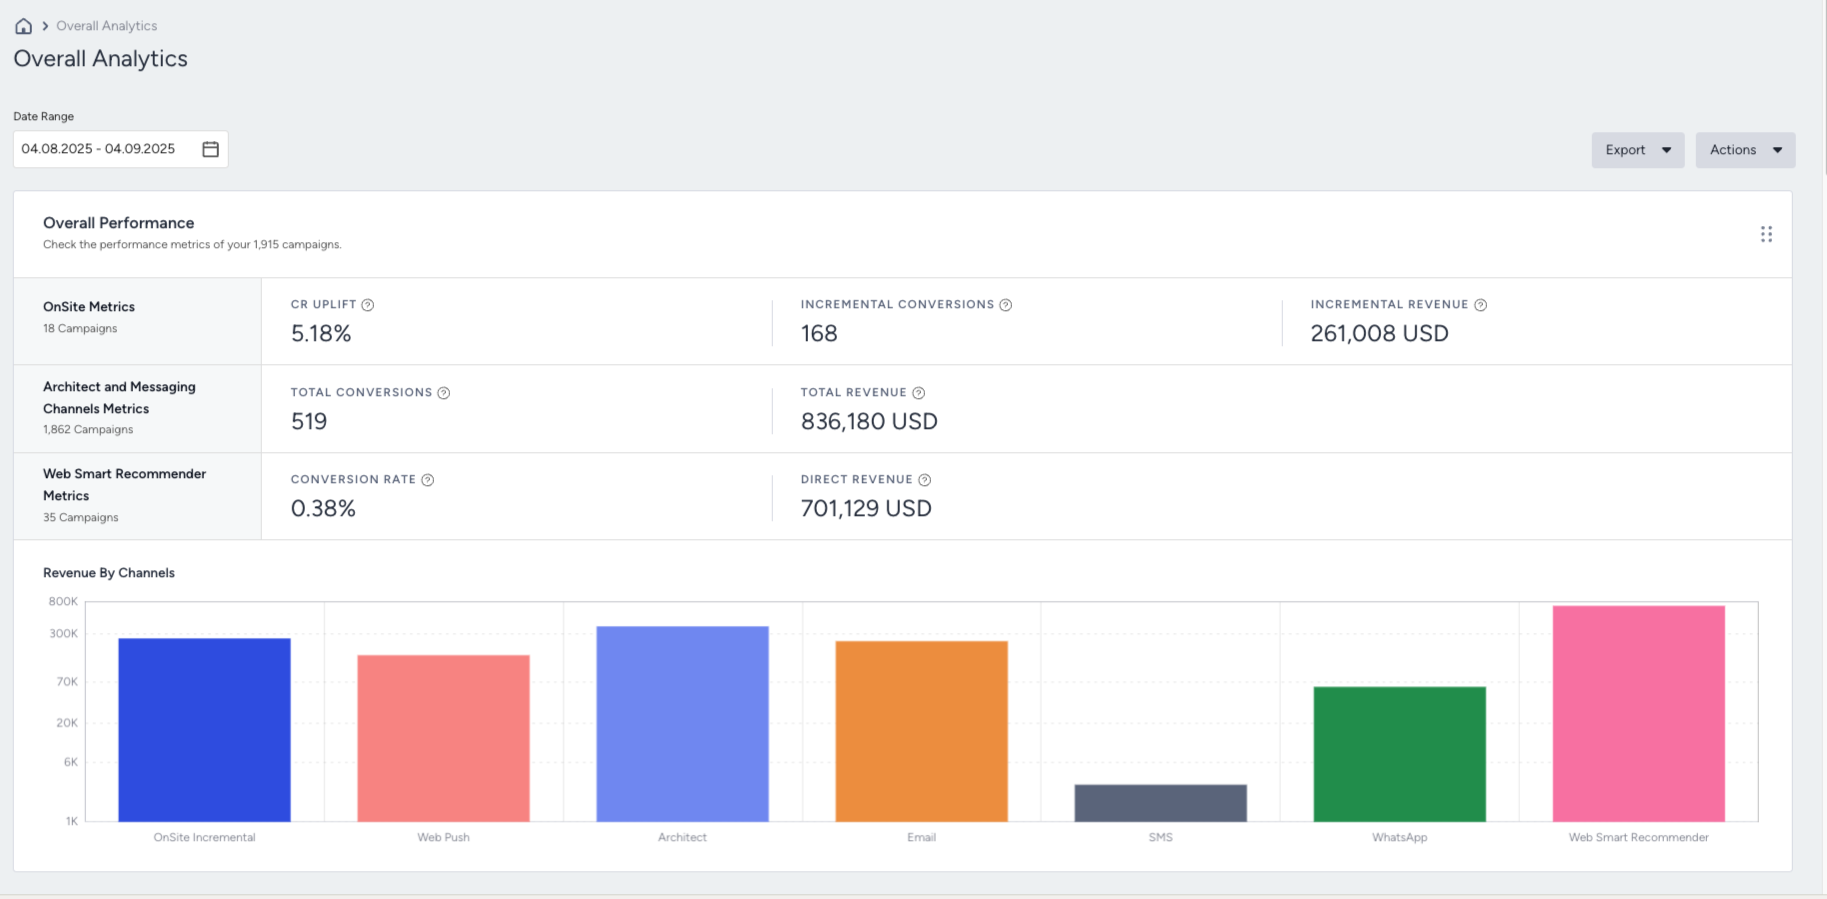
Revenue by Channels Bar Graph
This channel-based bar displays the total revenue generated by each channel in a single view and provides clear comparisons. An exponential growth chart is used for visualization as the revenue values might be different from each other.
Export
The exported report includes all the selected metrics on the dashboard with the exact breakdown on the panel. You can choose the sections and channels you want to export the related key metrics. The export option is available for single export only.
Actions
You can click the Save as Default button to save the metric, product, and filter selections to display the report based on the previously saved view. The date picker is not saved as a default.
You can select sections and channels to view on the dashboard.
Subscriber Metrics
This section displays the subscriber count for each messaging channel. It shows the value of the current day regardless of the selected date range.
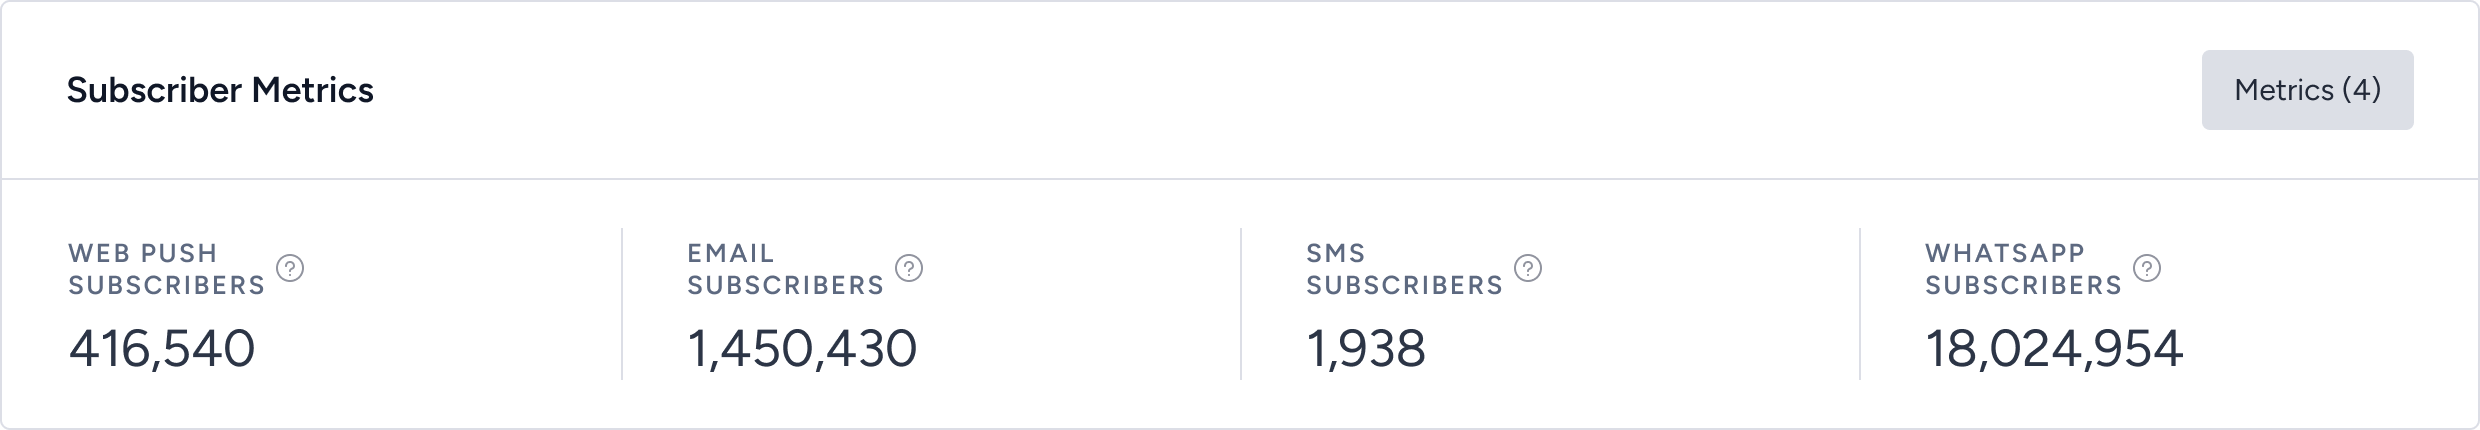
You can click the Metrics filter to select the products you want to see.
Product-Level Metrics
The report shows six default metrics for each product. You can add/remove metrics you want to view. You should add at least one and a maximum of six metrics to the dashboard. You can also save the metrics you select as the default.
You can also remove the default filters from product cards and apply any preferred filters. You can click the Save as Default button to save the filters you select as part of your default view.
An overall analytics button is located at the bottom of each card, directing you to the respective dashboard.
OnSite Product Card
Summary metrics of the OnSite campaigns are displayed for “With Control Group” and “Without Control Group” options.
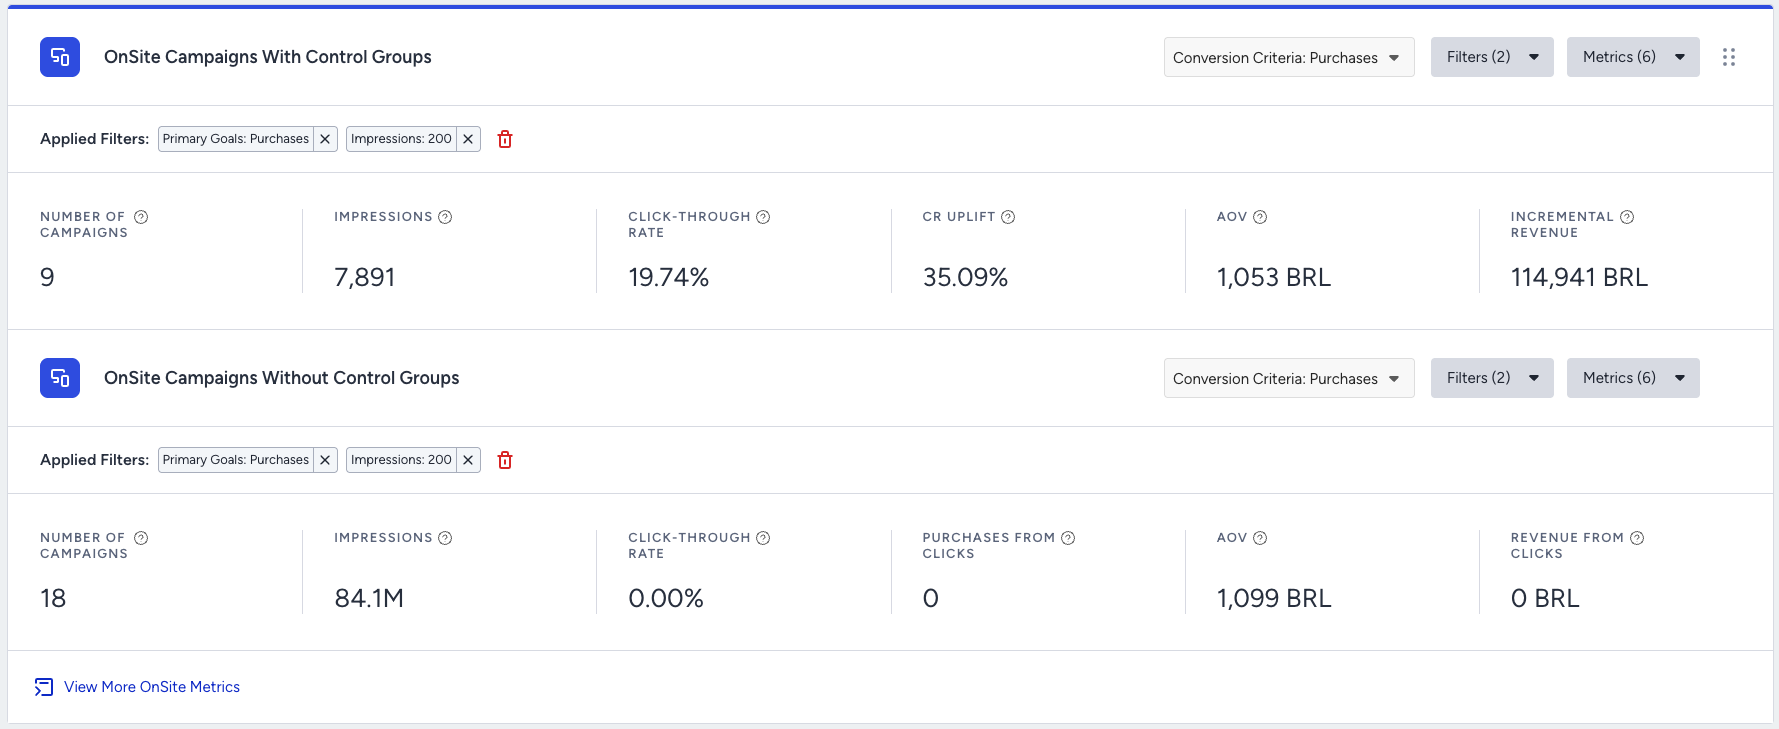
You can filter the metrics by conversion criteria and visit OnSite Analytics.
Web Push Product Card
Summary metrics of the Web Push campaigns are displayed on this card.
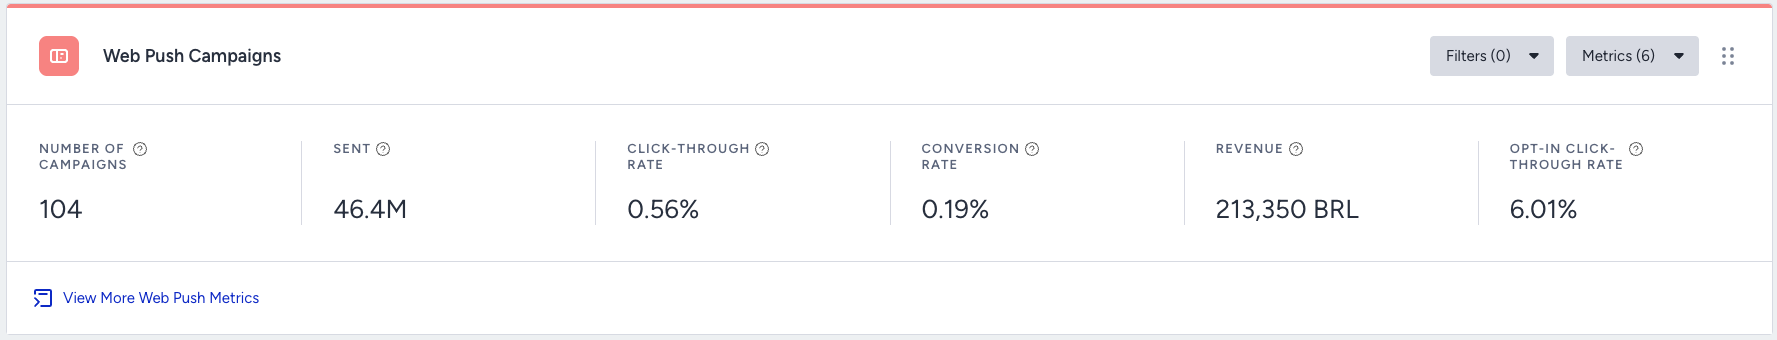
You can click the View More Web Push Metrics button to visit the overall analytics dashboard.
Email Product Card
Summary metrics of the Email campaigns are displayed on this card.
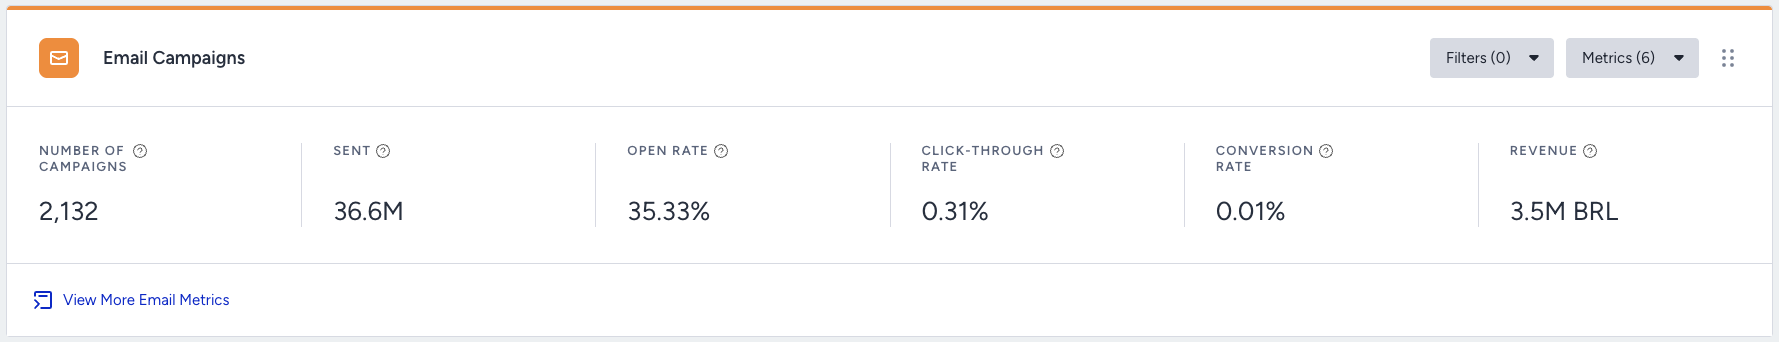
You can click the View More Email Metrics button to visit the overall analytics dashboard.
SMS Product Card
Summary metrics of the SMS campaigns are displayed on this card.
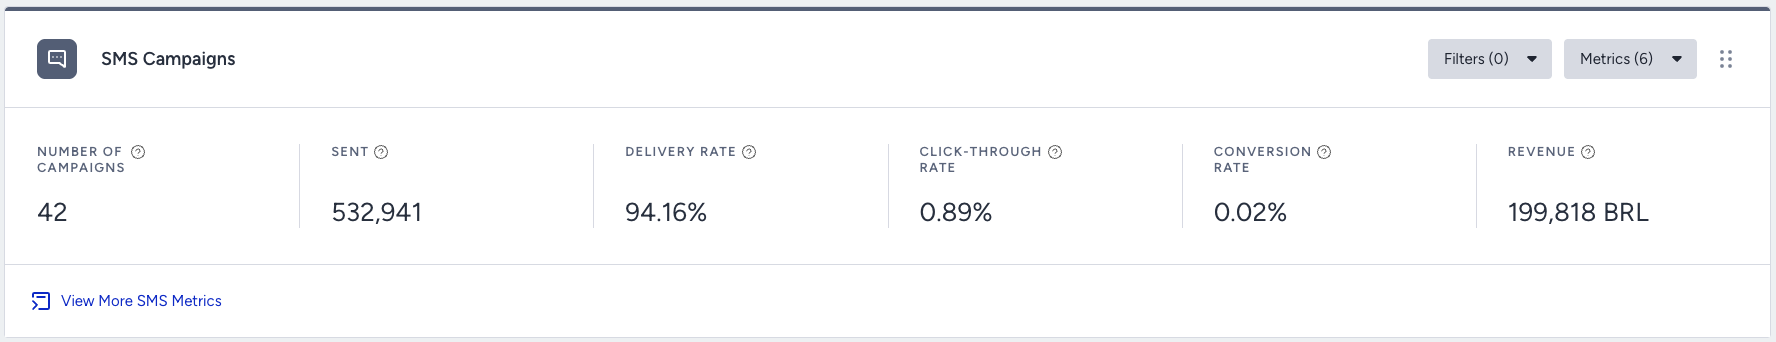
You can click the View More SMS Metrics button to visit the overall analytics dashboard.
WhatsApp Product Card
Summary metrics of the WhatsApp campaigns are displayed on this card.
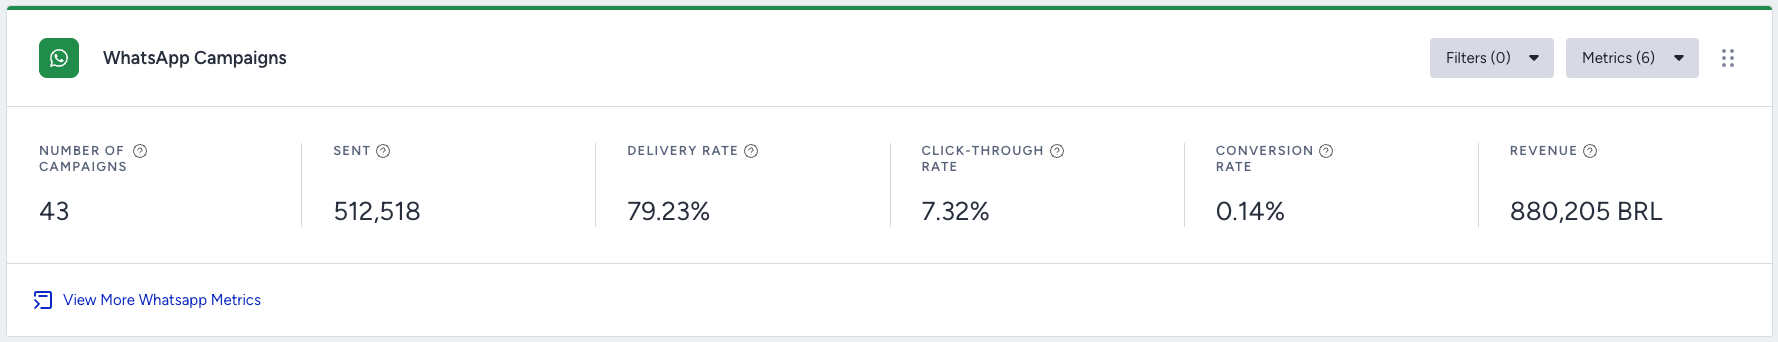
You can click the View More WhatsApp Metrics button to visit the WhatsApp Detailed Campaign Analytics.
Architect Product Card
Summary metrics of the Architect journeys are displayed on this card.
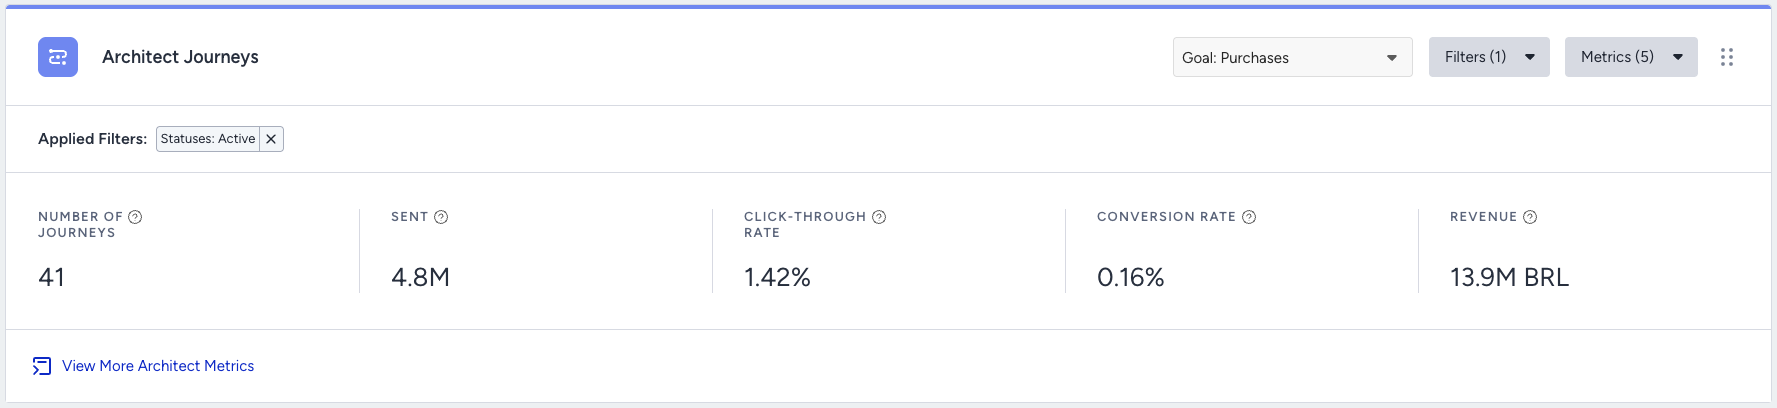
You can filter the metrics by the goal. You can click the View More Architect Metrics button to visit the overall analytics dashboard.
Smart Recommender Product Card
Summary metrics of Smart Recommender are displayed in this card.
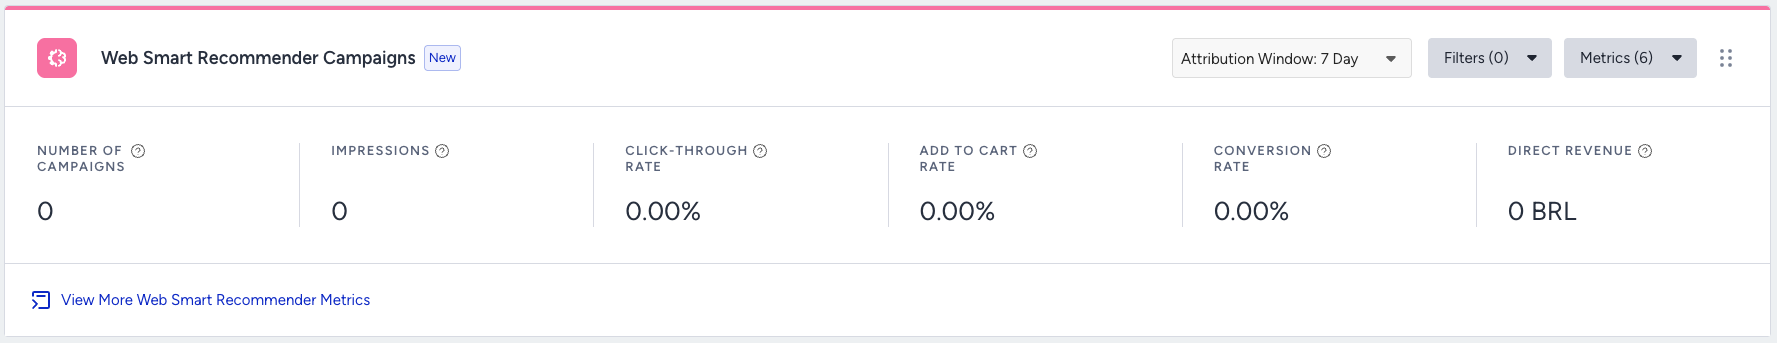
Metrics can be displayed by adjusting the attribution window period. You can click the View More Web Smart Recommender Metrics button to learn more about Smart Recommender Analytics.