To better understand your campaigns, you can assess outcomes using the specific figures for each campaign. You can utilize Insider One's real-time analytics to monitor the performance and effectiveness of your campaigns, enabling you to make informed decisions for your next steps.
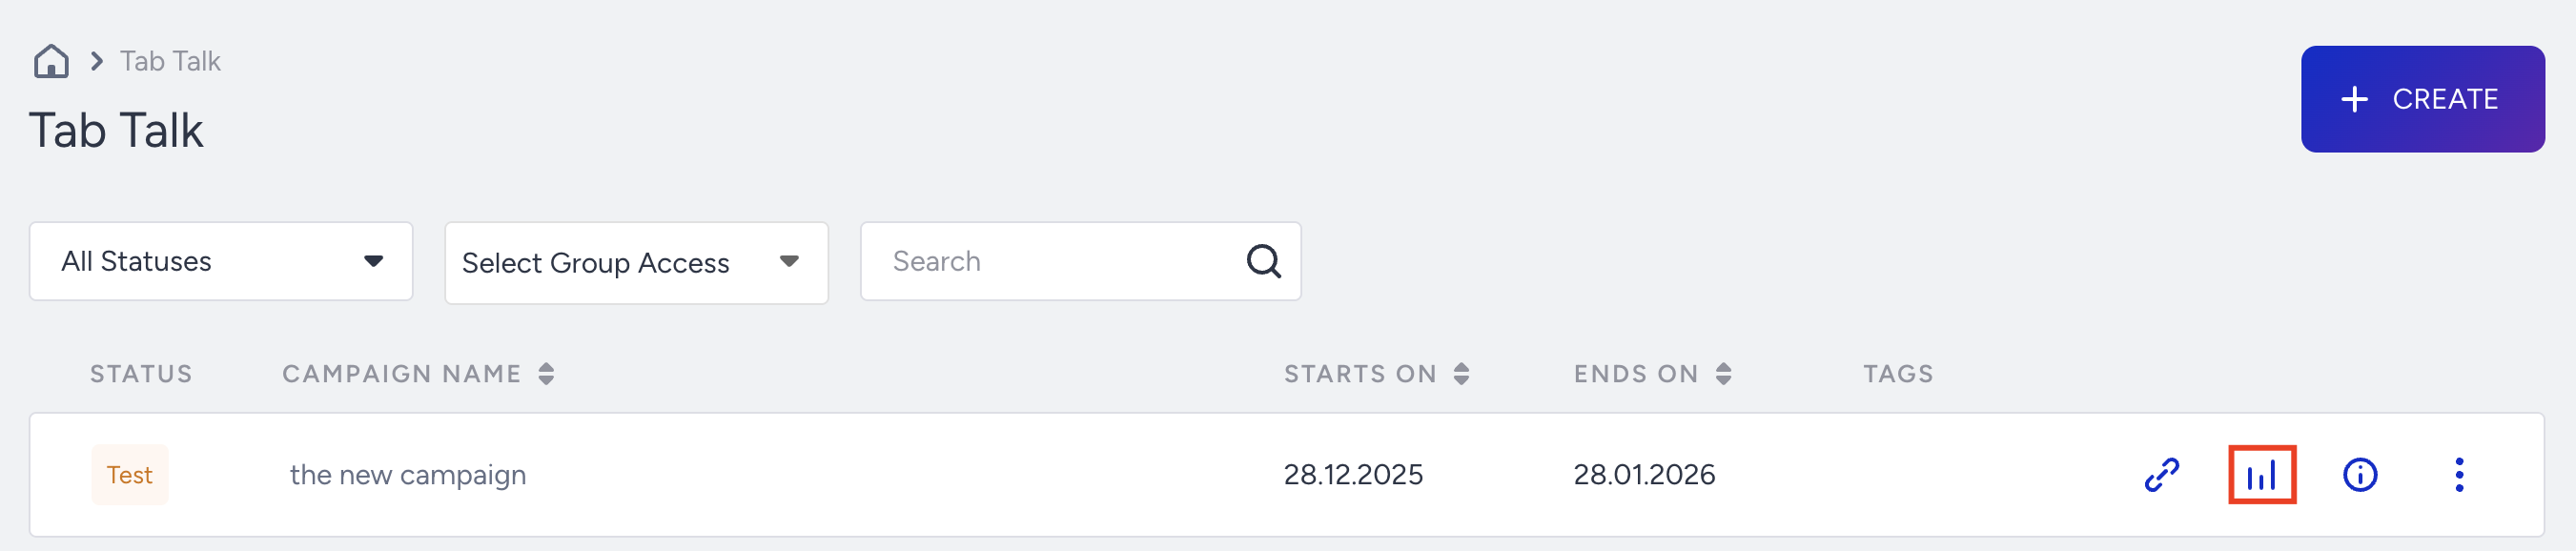
For a detailed look at a Tab Talk campaign's performance, click Analytics on the campaign you want to view on the Tab Talk campaign listing page.
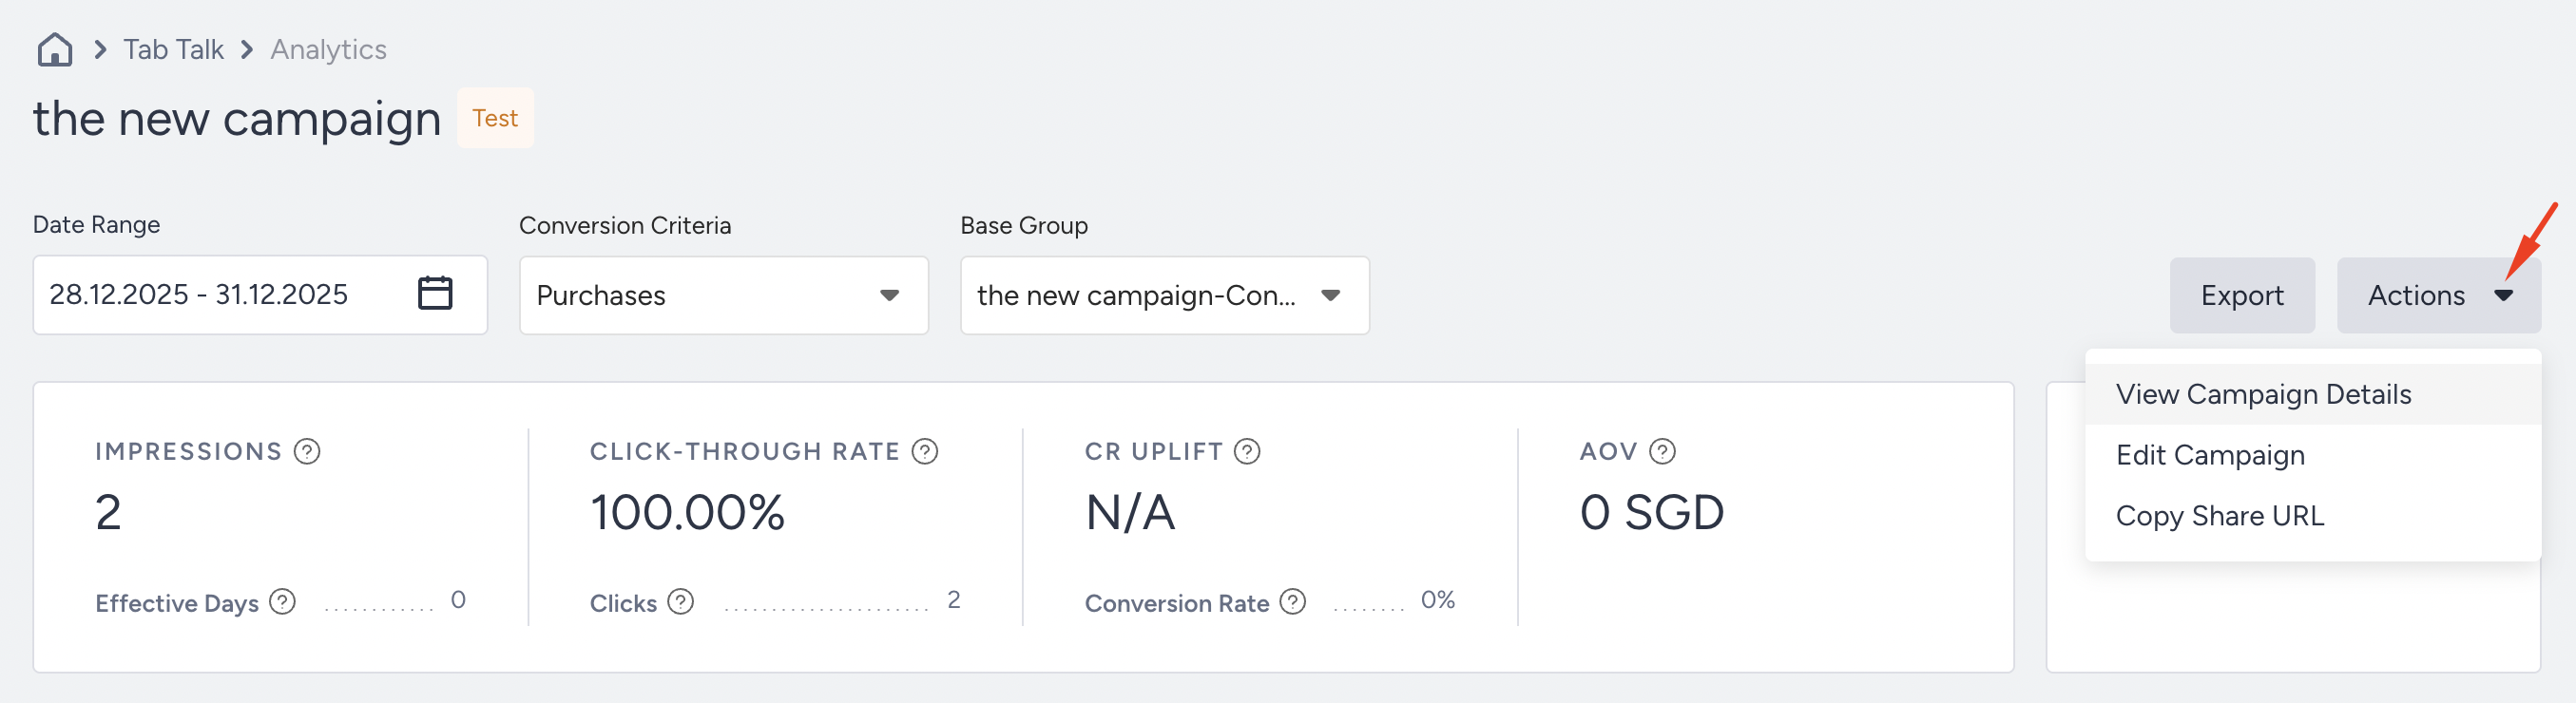
You can view the results based on the time range you select. To export the result, click the Export button, which will generate an Excel file or a URL link that you can share.
You can reach your campaign page, edit it, or view the details under the Actions menu.
Impression Funnel
You can change the Conversion Criteria, Baseline, and Date Range to see the performance.
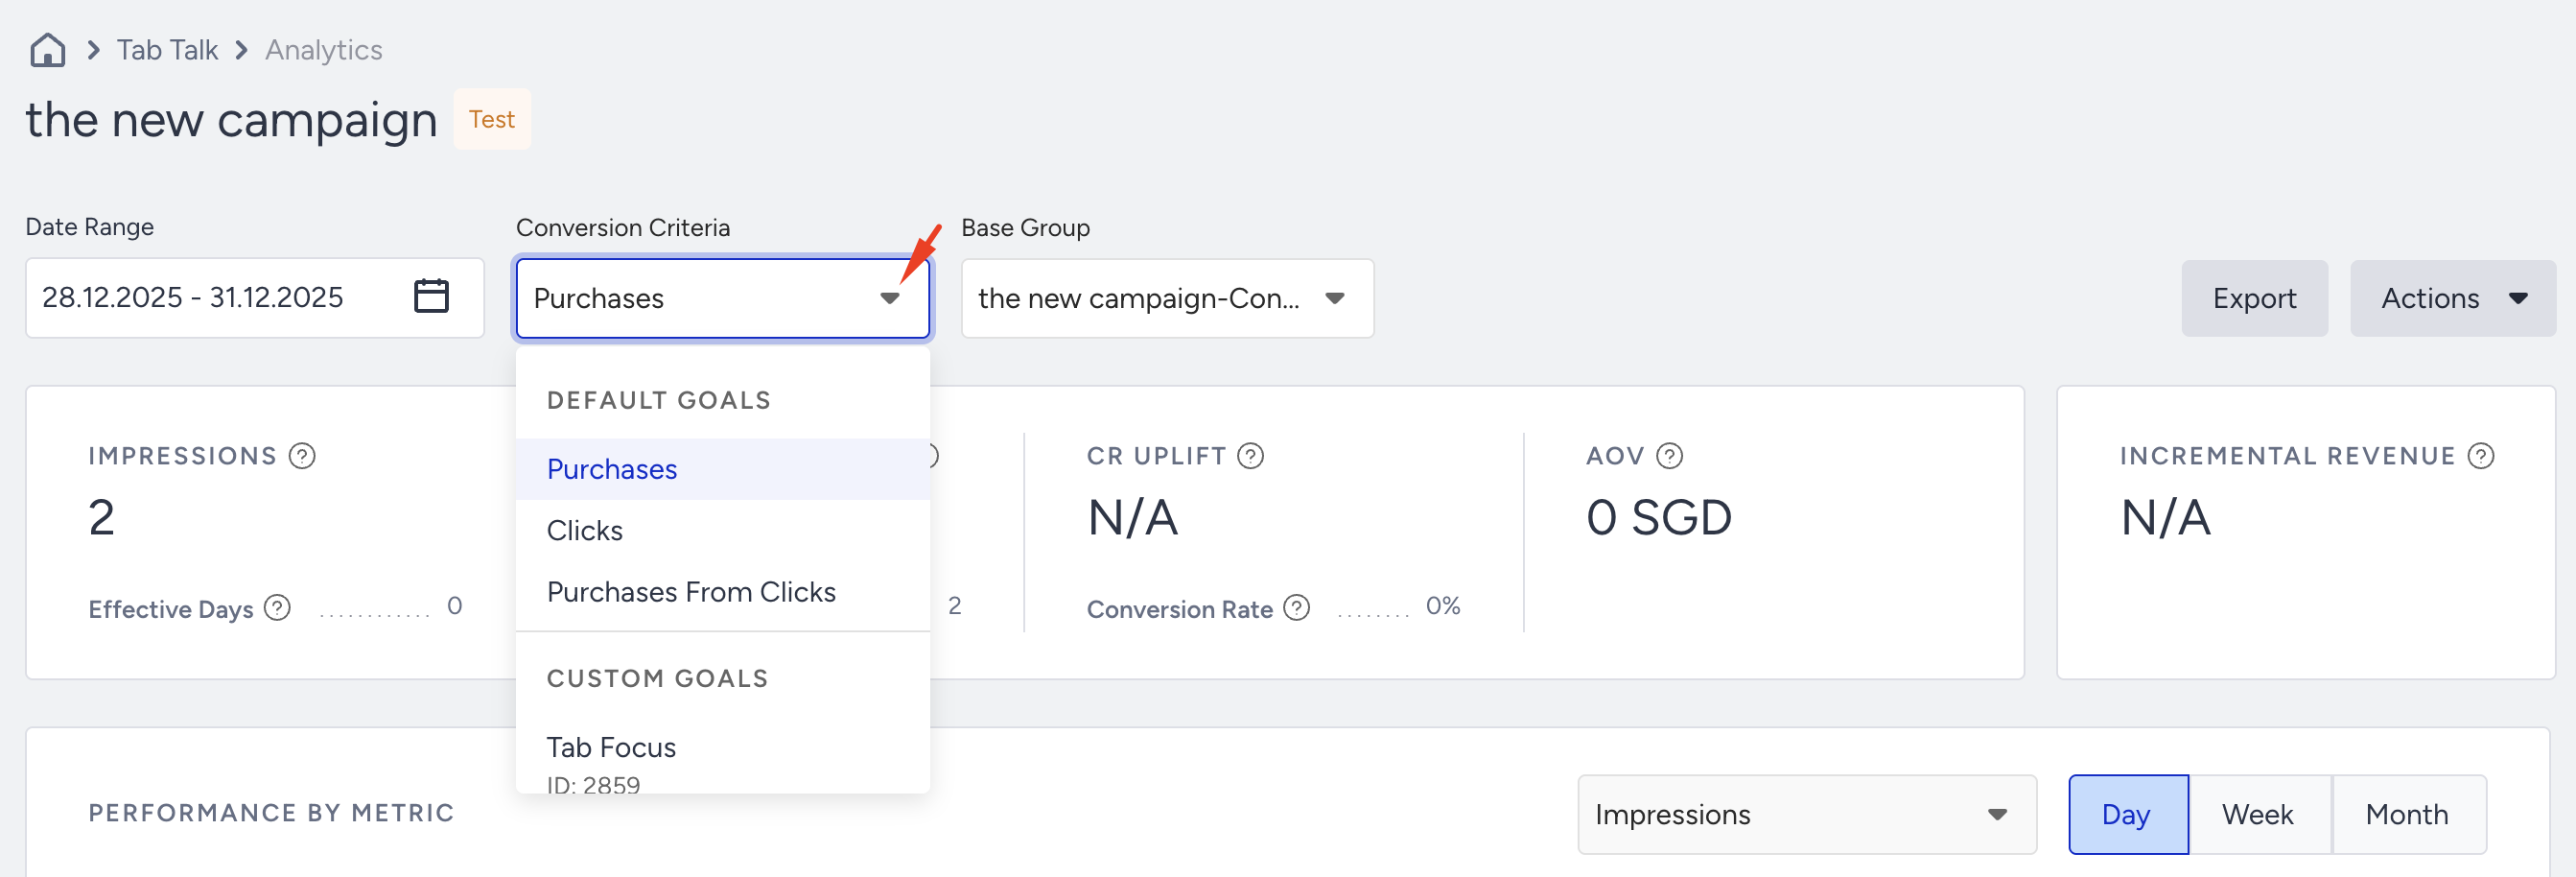
Impressions: The number of times that your users viewed your variant.
Effective Days: The number of days on which at least one variant had been viewed more than 10 times.
Conversion-through Rate: The percentage of clicks to the impressions.
Clicks: The total number of times that users clicked the links in your variants.
Conversion Rate Uplift: The percentage of the conversion rate difference between the variant and the control group.
Conversion Rate: The percentage of conversions to the impressions.
Average Order Value (AOV): The division of the revenue by the number of conversions.
Incremental Revenue: The revenue difference between the variant and the control group.
Metrics
You can analyze metrics based on impressions, conversions, and conversion rates on a daily, weekly, or monthly basis.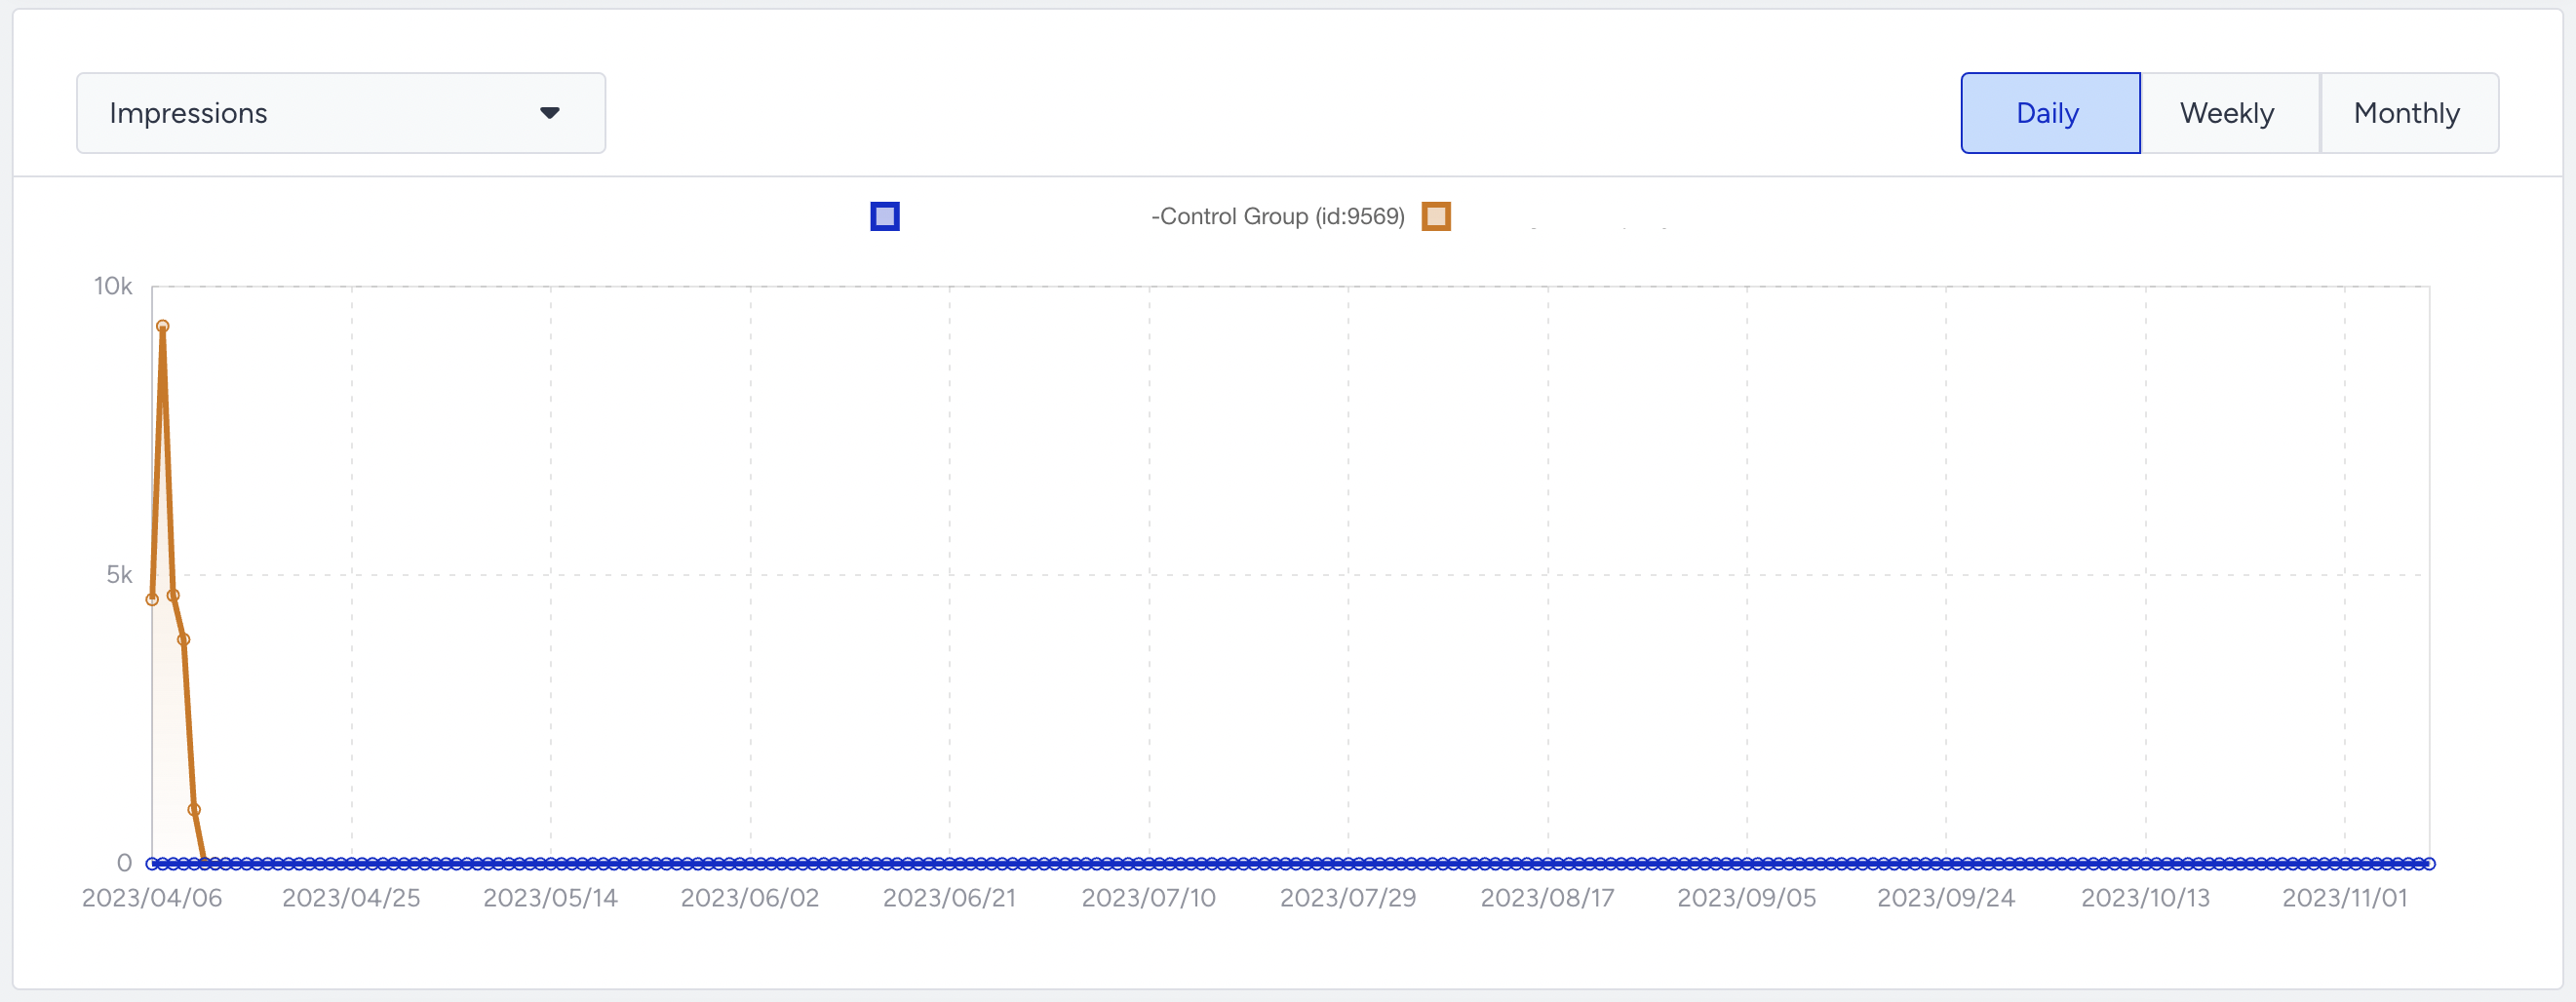
Purchases Goal Metrics
You can select and compare the Purchase goals metrics of your variations.
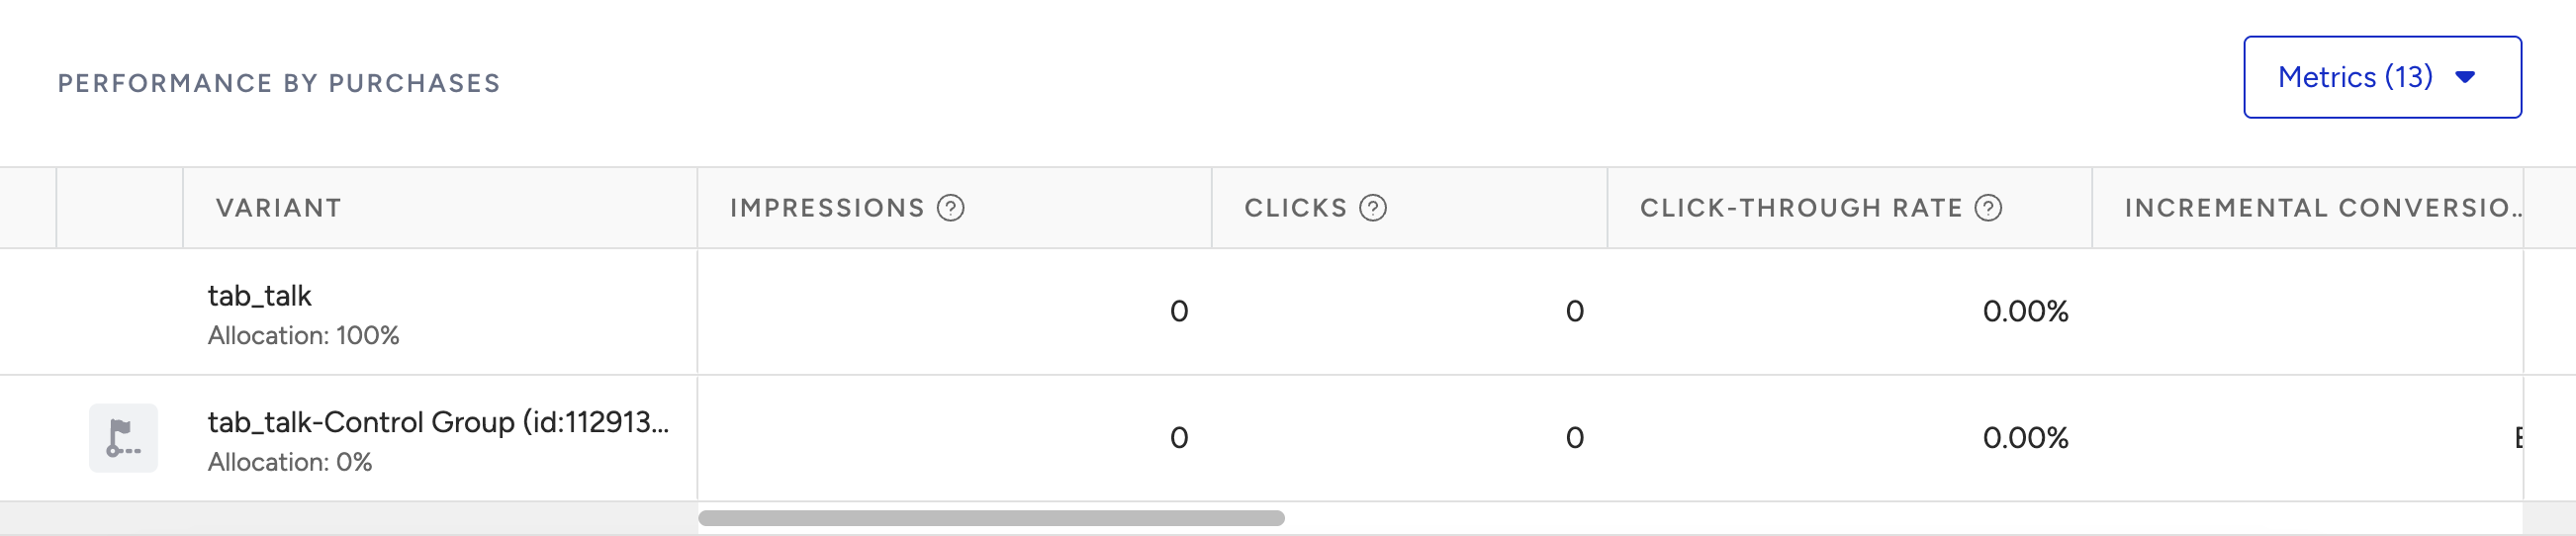
Impression: Number of unique visitors that became part of the variation.
Conversion: Number of successful primary goal conversions.
Conversion Rate: Number of conversions divided by the number of delivered campaigns.
Uplift: An increase in the conversion rate of variation compared to the control group.
Significance: Expressed as a percentage, it indicates whether a campaign or personalization is effective at prompting action, based on impressions or uplift.
Probability to Win: Refer to Probability to Win.
Incremental Revenue: Extra revenue from personalization campaigns versus the control group.
Incremental Conversion: Extra conversions from personalization campaigns versus the control group.
Revenue: The value of purchases made from your variant.
Average Order Value (AOV): The revenue ratio to the total number of purchases.
AOV Uplift: Percentage of the Average Order Value difference between the variant and the control group.
For further information, refer to Metric Definitions.