You can view your Web Push campaign analytics and evaluate their performance.
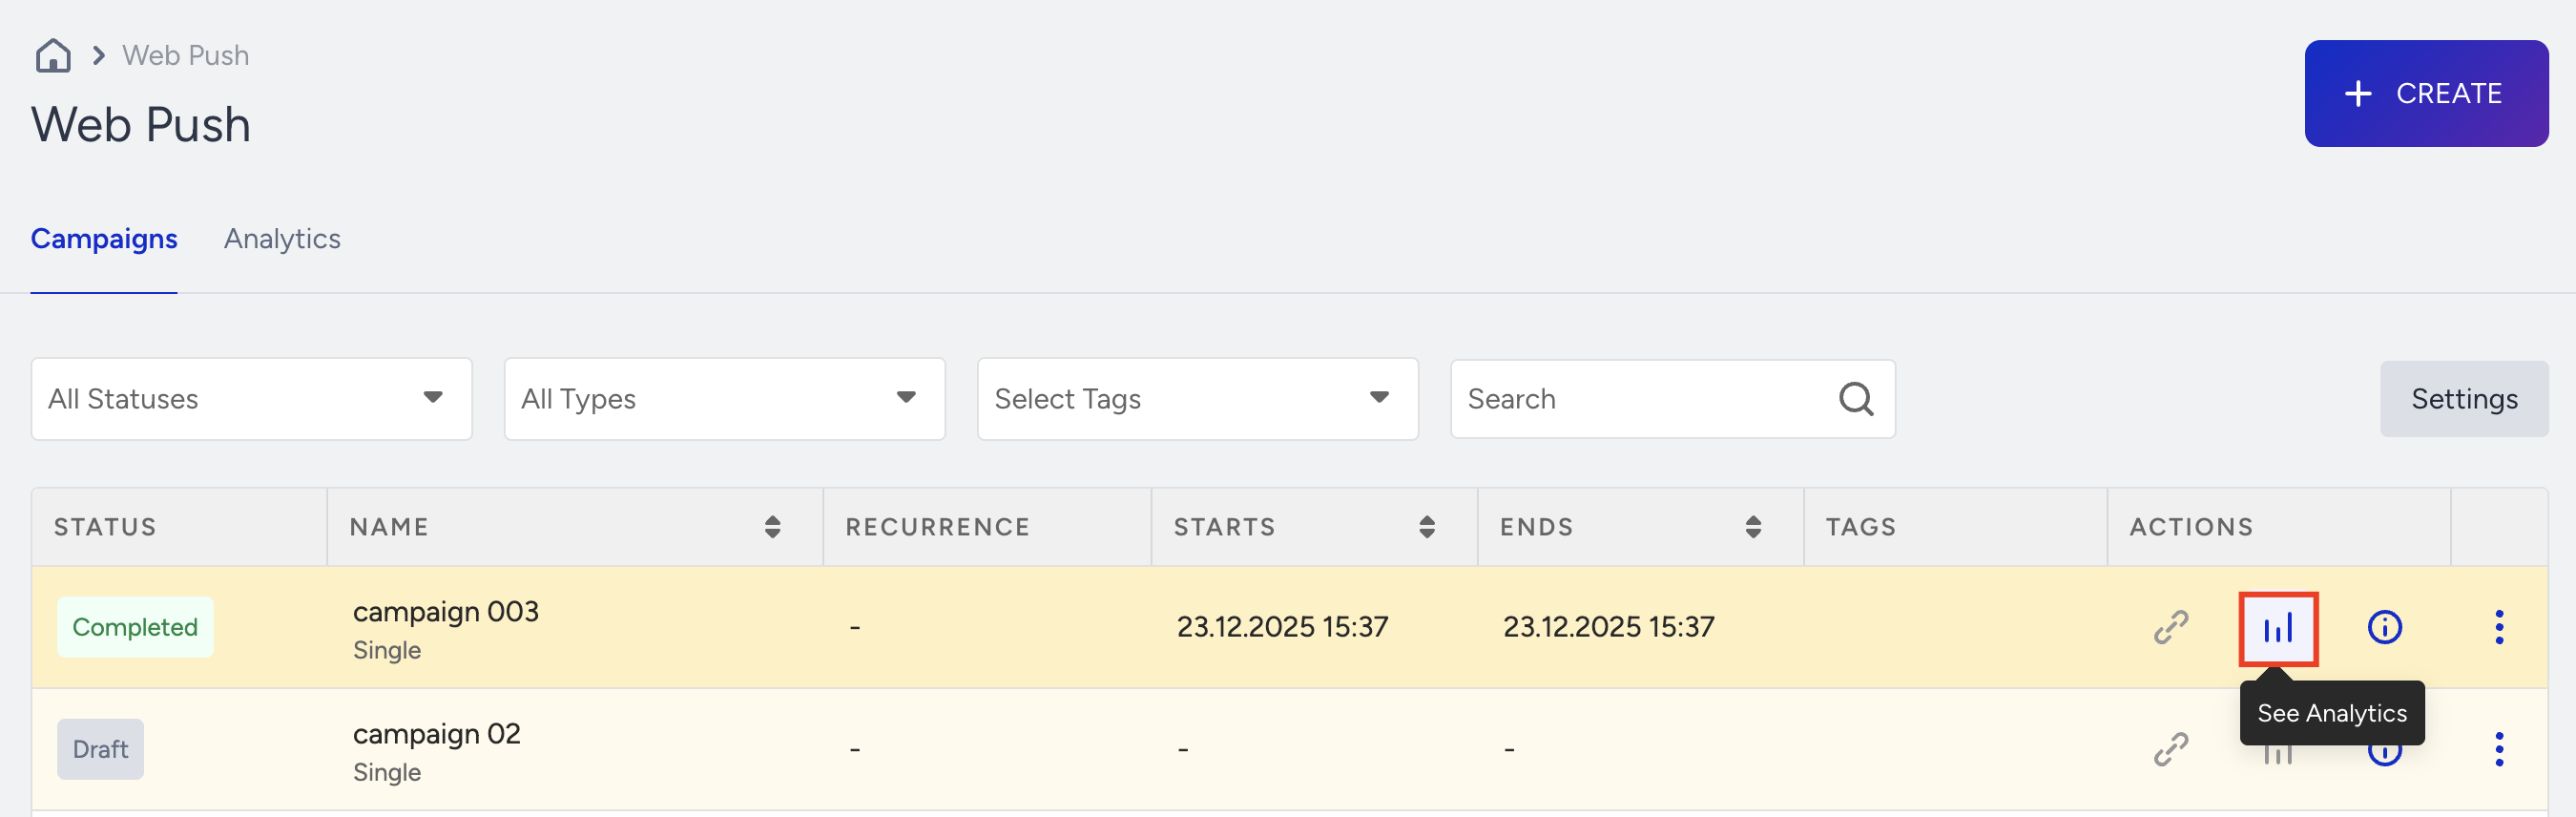
Click the Analytics button next to each Web Push campaign on the listing page to access campaign-level Web Push analytics.
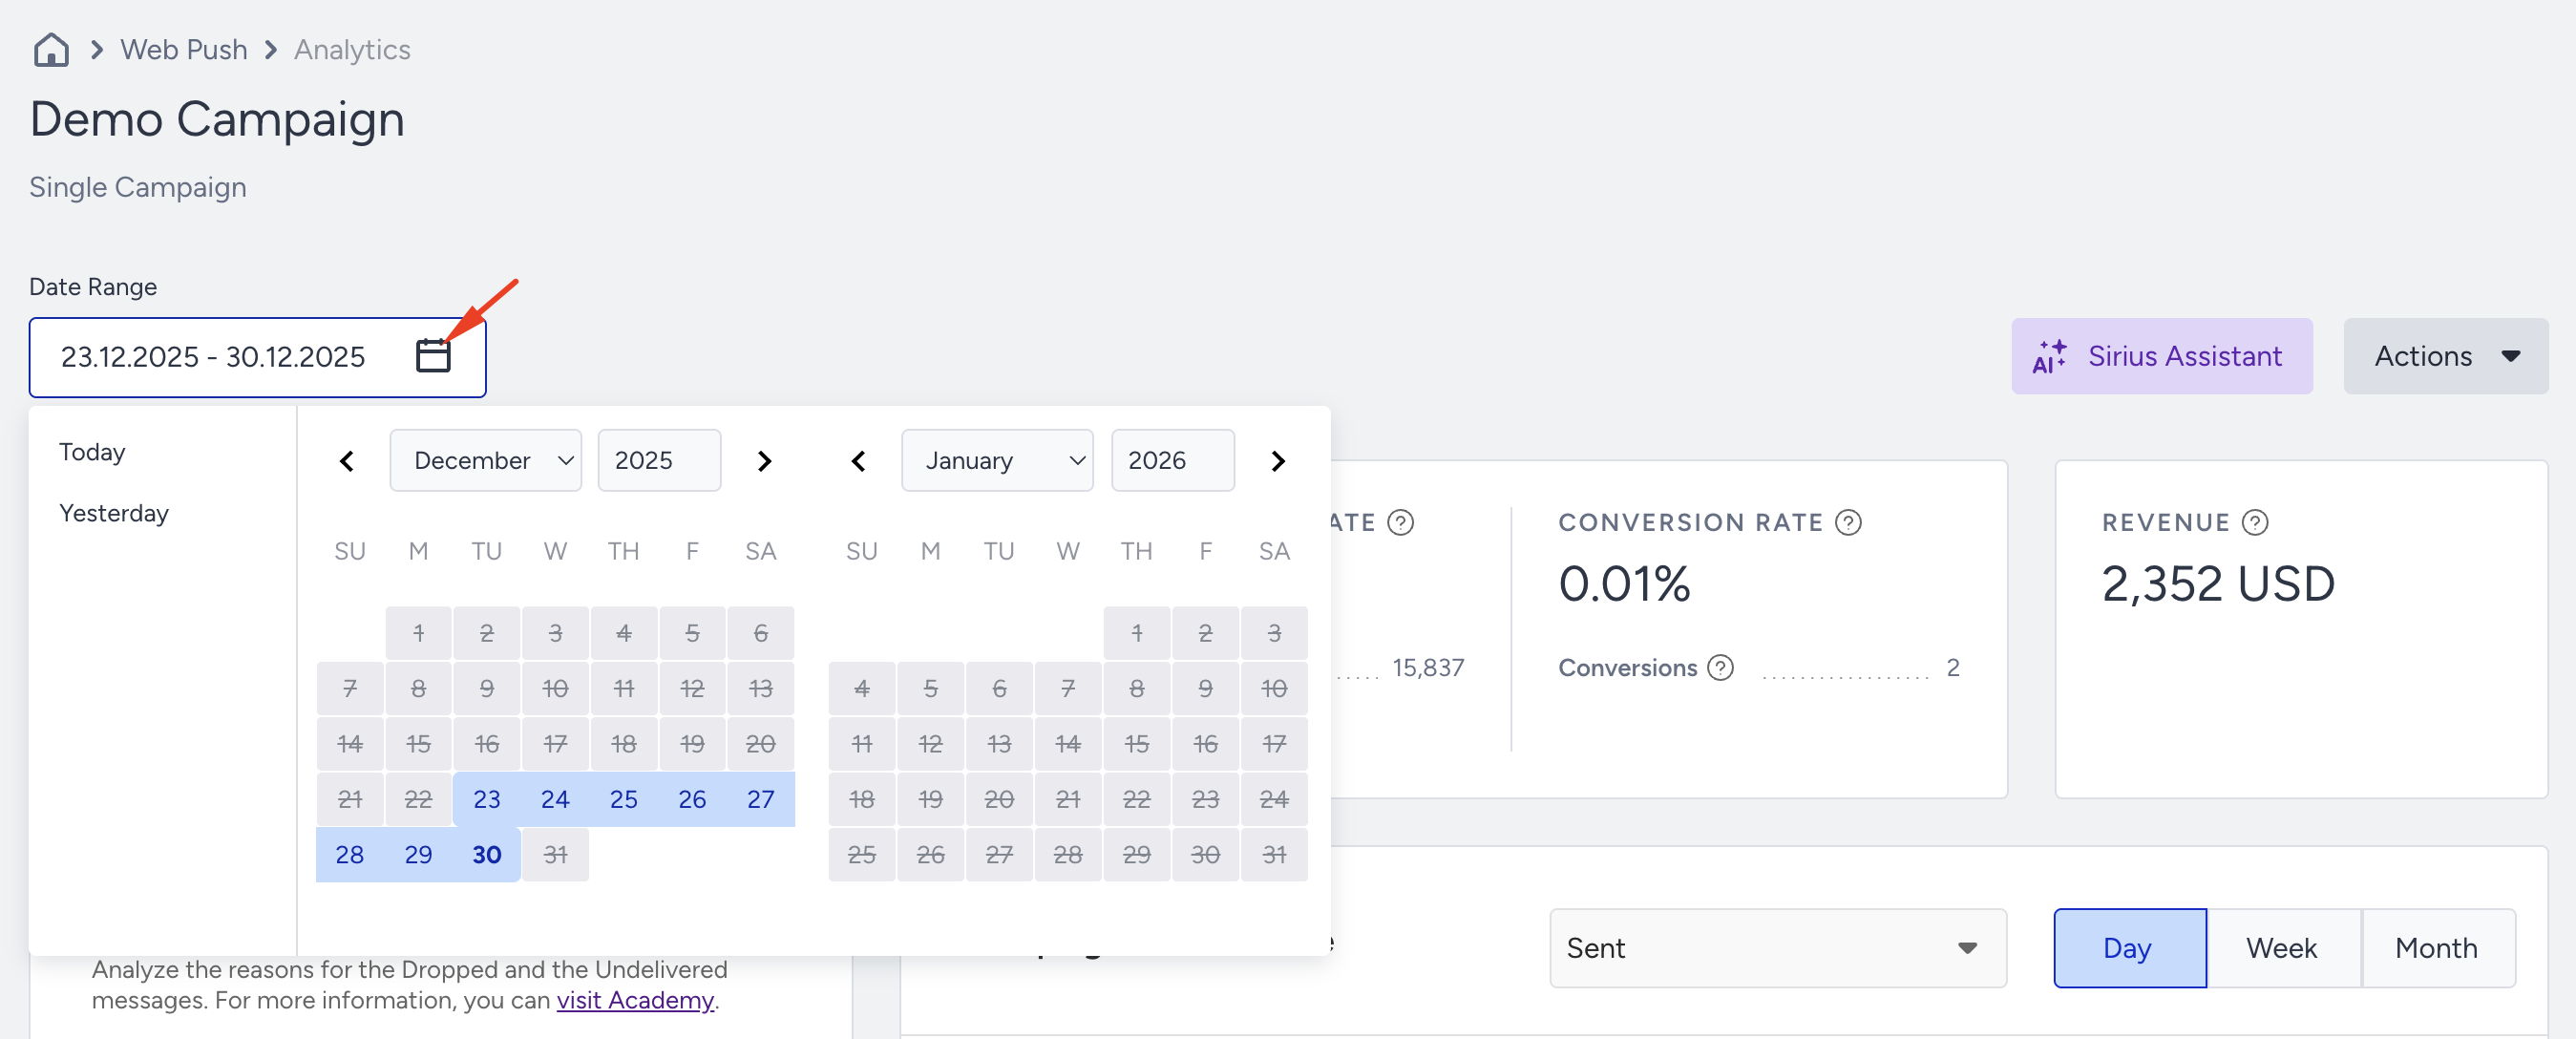
You can filter the performance metrics for your Web Push campaign by selecting a time range using the date picker in the top-right corner of the page.
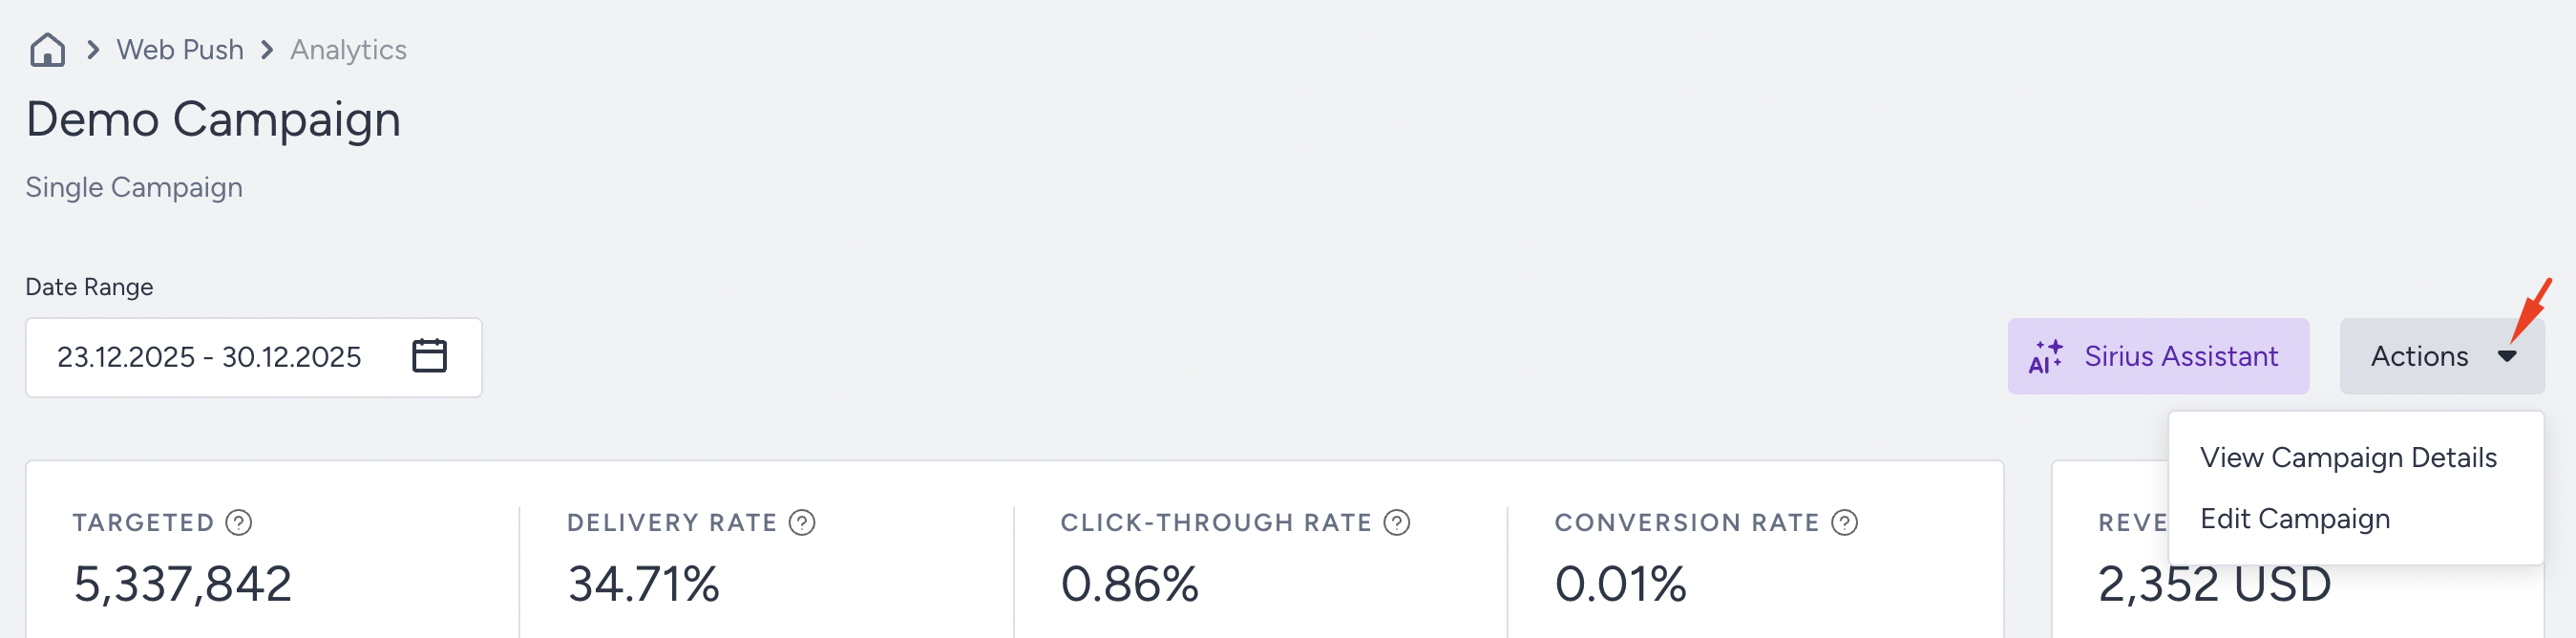
Under the Actions menu, you can access and edit your Web Push campaign, provided its status is set to draft, completed, or test. You can also see its overall details.
Key Metrics
Narrowing down your results with the date picker, you can see the following metrics for your Web Push campaign: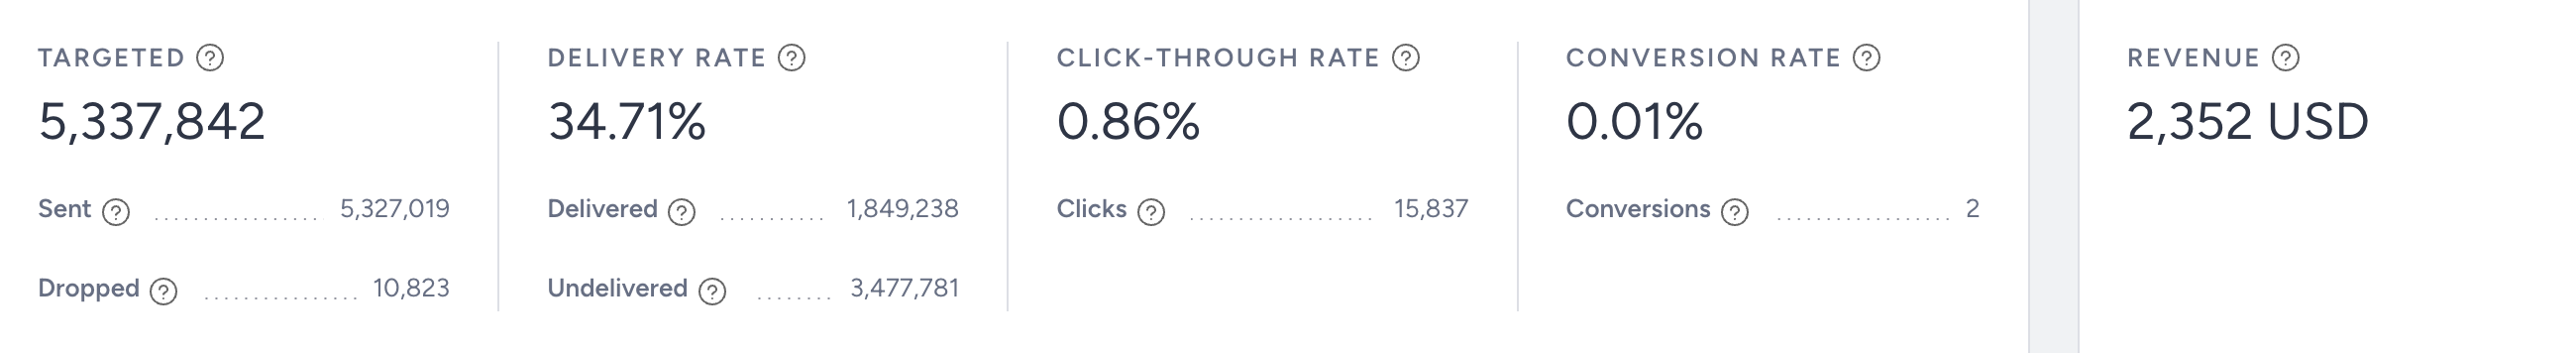
Targeted: The number of recipients in your target audience generated based on the segmentation of your campaign. This is the audience count you see before launching your web push campaigns.
Sent: The total number of Web Push messages addressed to the recipients.
Dropped: Even though you initially target a certain number of users when you launch your campaign, some of these user tokens are not really targeted in your campaign funnel. The count of eliminated tokens is displayed as “Dropped”.
Delivery Rate: The percentage of the Delivered to the Sent Web Push messages. In other words, it is the percentage of users who have seen your message of those who had the chance to see it.
Delivered: The number of Web Push messages successfully transferred to the recipients. In other words, these are the users who have received your message.
Undelivered: The number of Web Push messages that weren’t addressed to the recipients by the service provider.
Users are notified as soon as a product is back in stock or its price drops if the rules and segments have been matched. As a result, you may notice a higher number of delivered push notifications in your campaign analytics compared to the previous periods.
Click-through Rate: The percentage of Clicks to the Delivered Web Push messages.
Clicks: The total number of times the recipients clicked on your Web Push message.
Conversion Rate: The percentage of Conversions to the clicked push messages.
Conversions: The number of transactions completed after clicking the push message within the conversion attribution window.
Revenue: The value of purchases made via your Web Push messages, within the conversion attribution duration.
Campaign Performance
You can view the Web Push campaign performance based on metrics you select from the dropdown: daily, weekly, or monthly.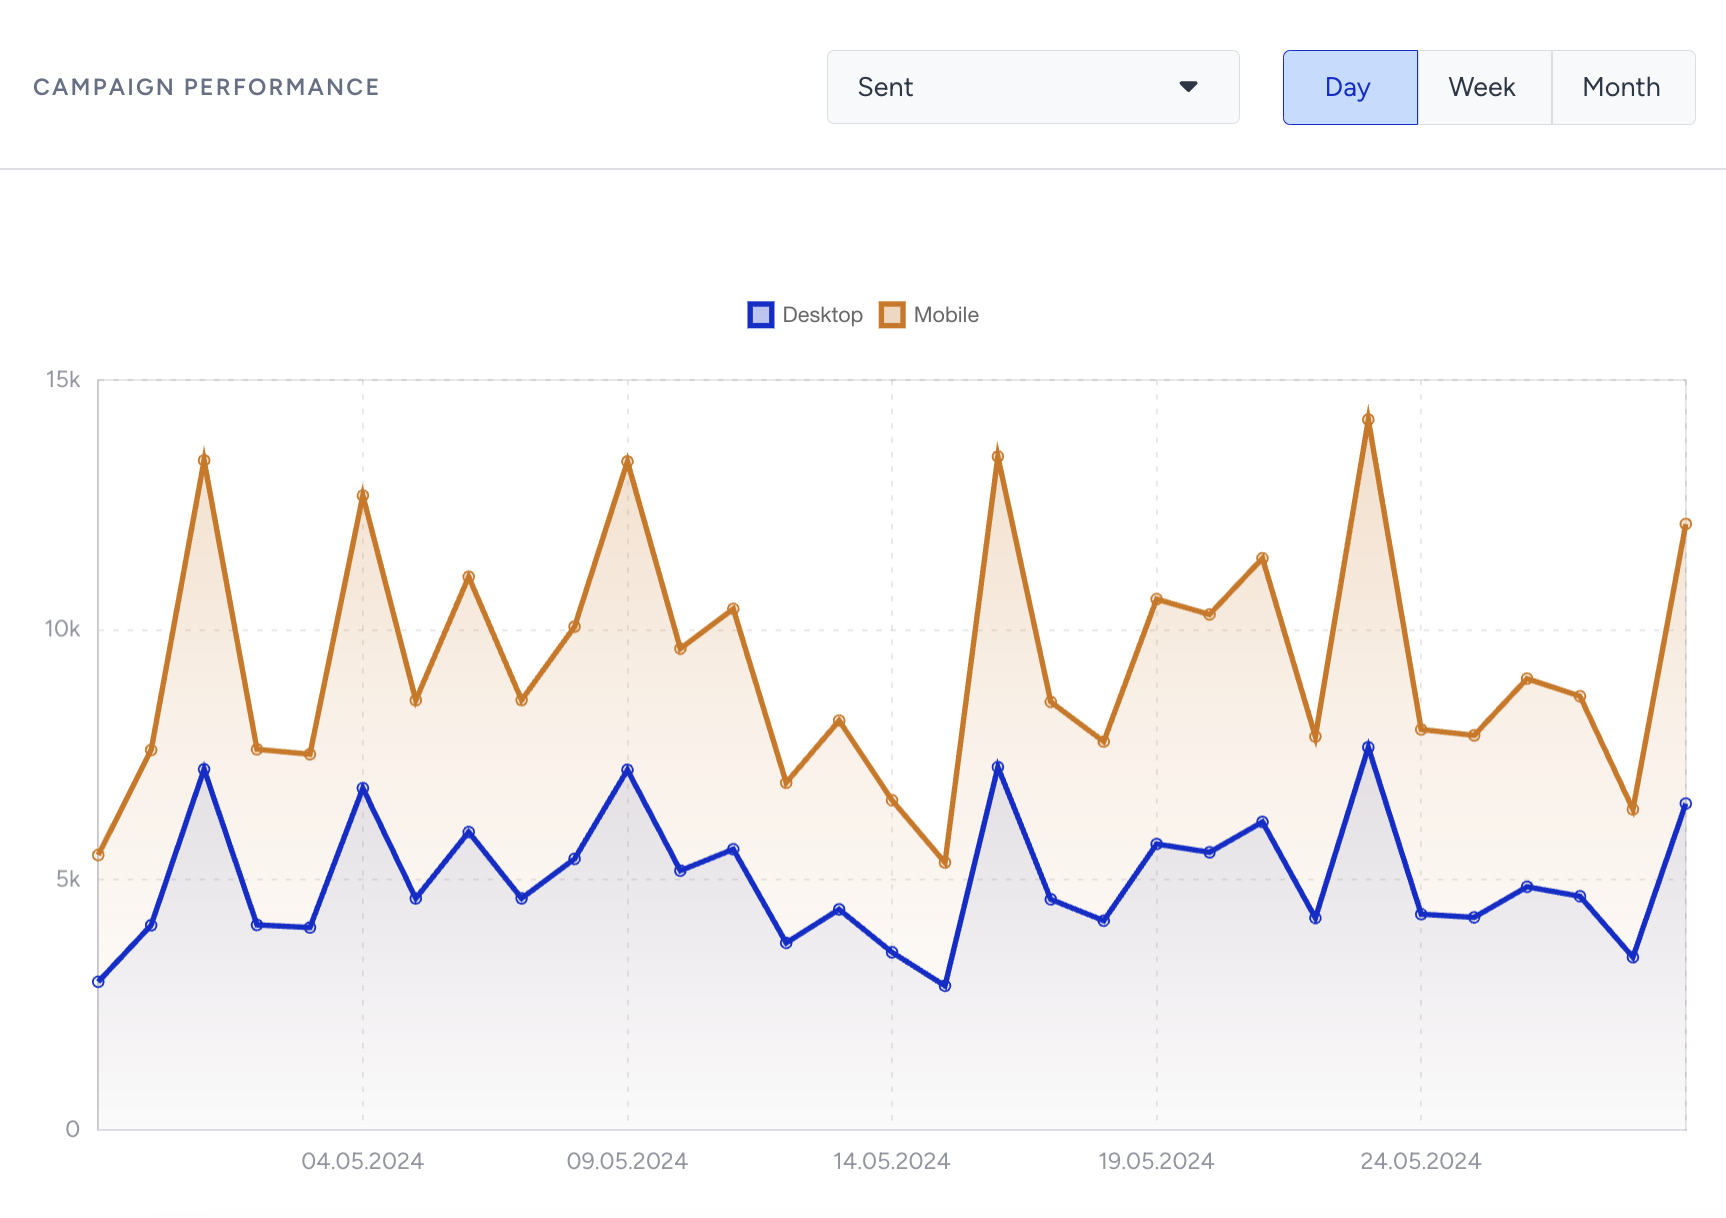
Unsuccessful Messages
You can analyze the reasons for the dropped and undelivered Web Push notifications.
Dropped
Under Dropped messages, you can analyze why some user tokens were not targeted in your campaign.
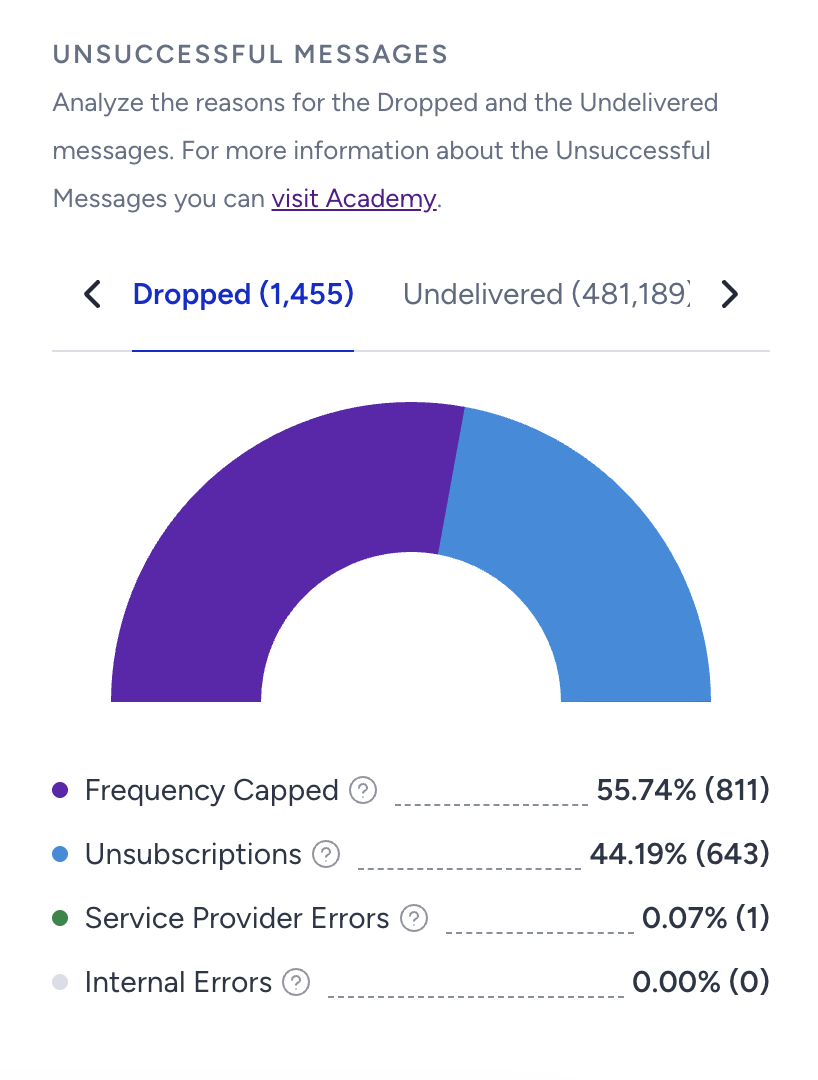
Frequency Capped: The number of Dropped messages due to the Channel and Campaign Frequency Capping settings.
Silent Hours: The number of Dropped messages due to the Silent Hours settings.
Unsubscriptions: The number of Dropped messages due to user opt-outs.
Service Provider Errors: The number of Dropped messages due to transmission issues to the Firebase Cloud Messaging servers.
Internal Errors: The number of Dropped messages due to various internal system issues.
Undelivered
Under Undelivered messages, you can analyze why some of the Web Push messages weren’t addressed to the recipients in your campaign.
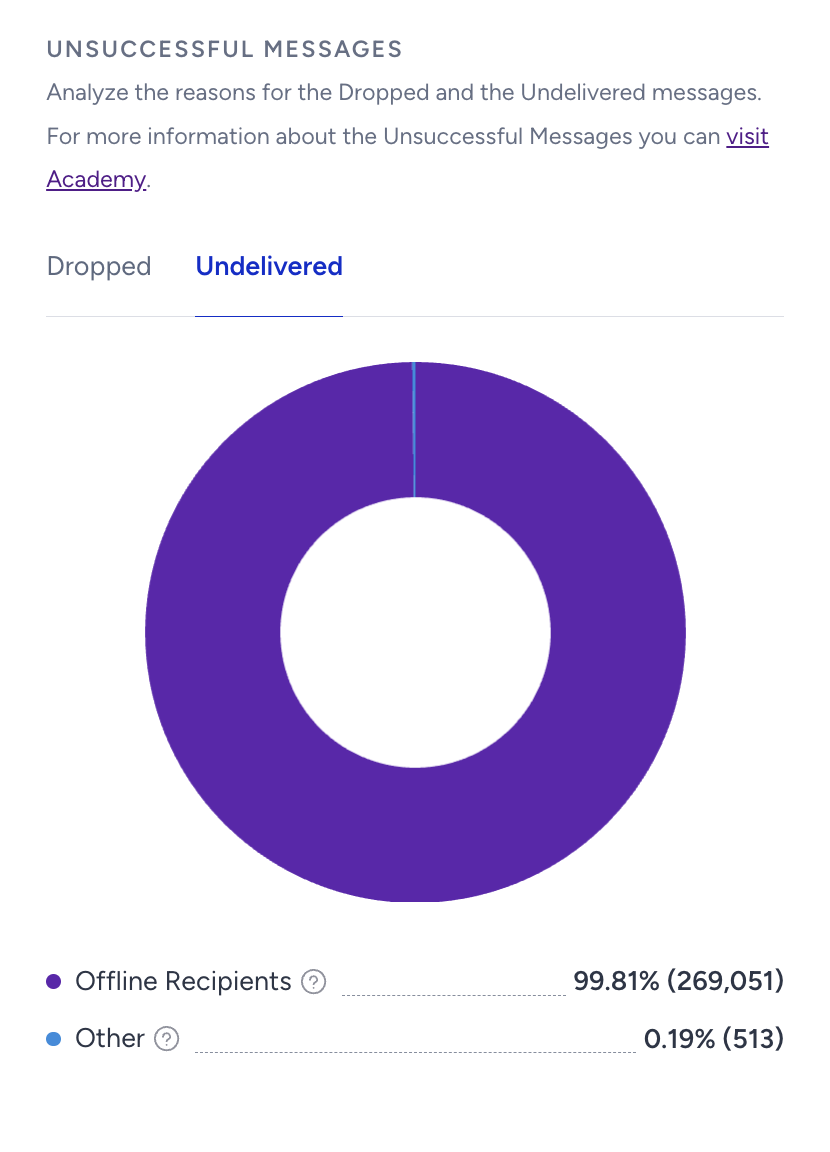
Offline Recipients: The number of Undelivered messages due to the recipients who weren't online within the campaign's Time to Live duration.
Other: The number of recipients we have failed to deliver information to due to unknown causes that might be system-related.
Device Metrics
You can view the distribution of metrics for your Web Push campaign, separated by mobile and desktop.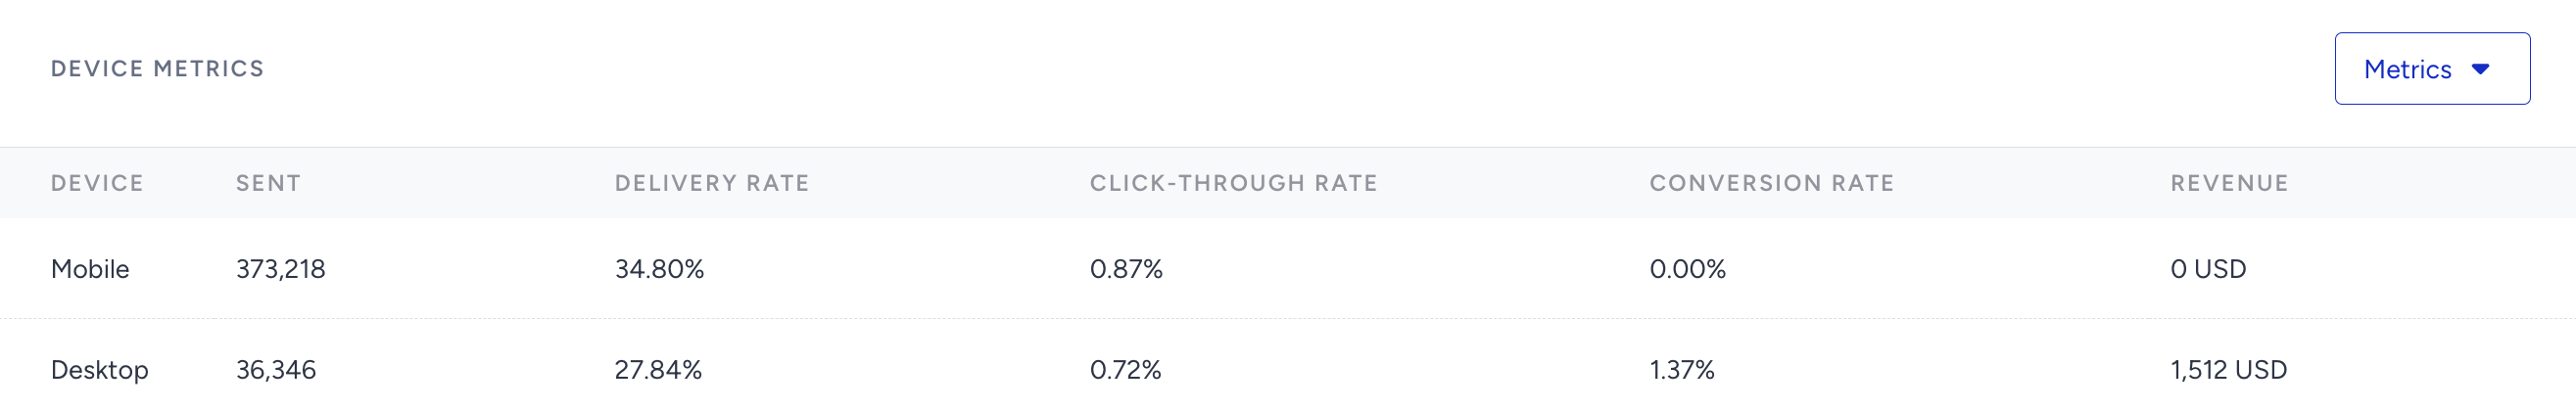
Click Metrics
You can see the click metrics of your main element and buttons in your Web Push campaign.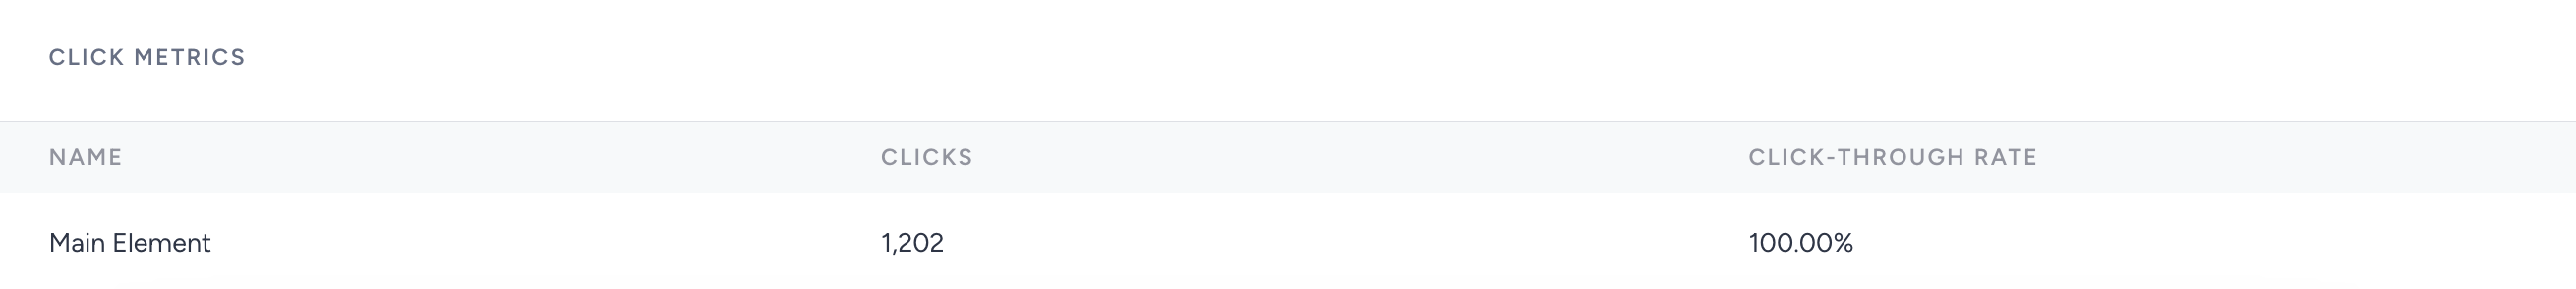
Clicks: The total number of Web Push messages clicked by the recipients.
Click-through Rate: The percentage of Clicks to the Delivered Web Push messages.