When you are at the WhatsApp element on the canvas, you can click the Go to WhatsApp Analytics button on the element to see the analytics of this channel.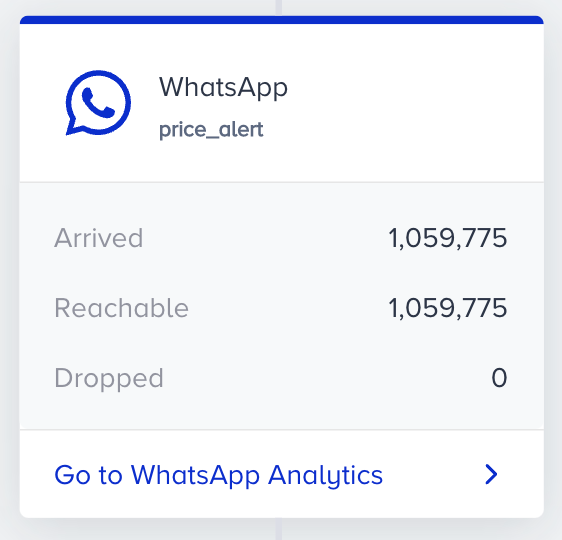
You can evaluate your WhatsApp channel statistics separately for promotional messages and conversational messages. Each provides different metrics based on the message type.
Promotional Message Analytics
To filter the channel performance metrics, you can:
- Select a goal to evaluate your WhatsApp conversion and conversion rate metrics using the dropdown in the top left corner of the page.
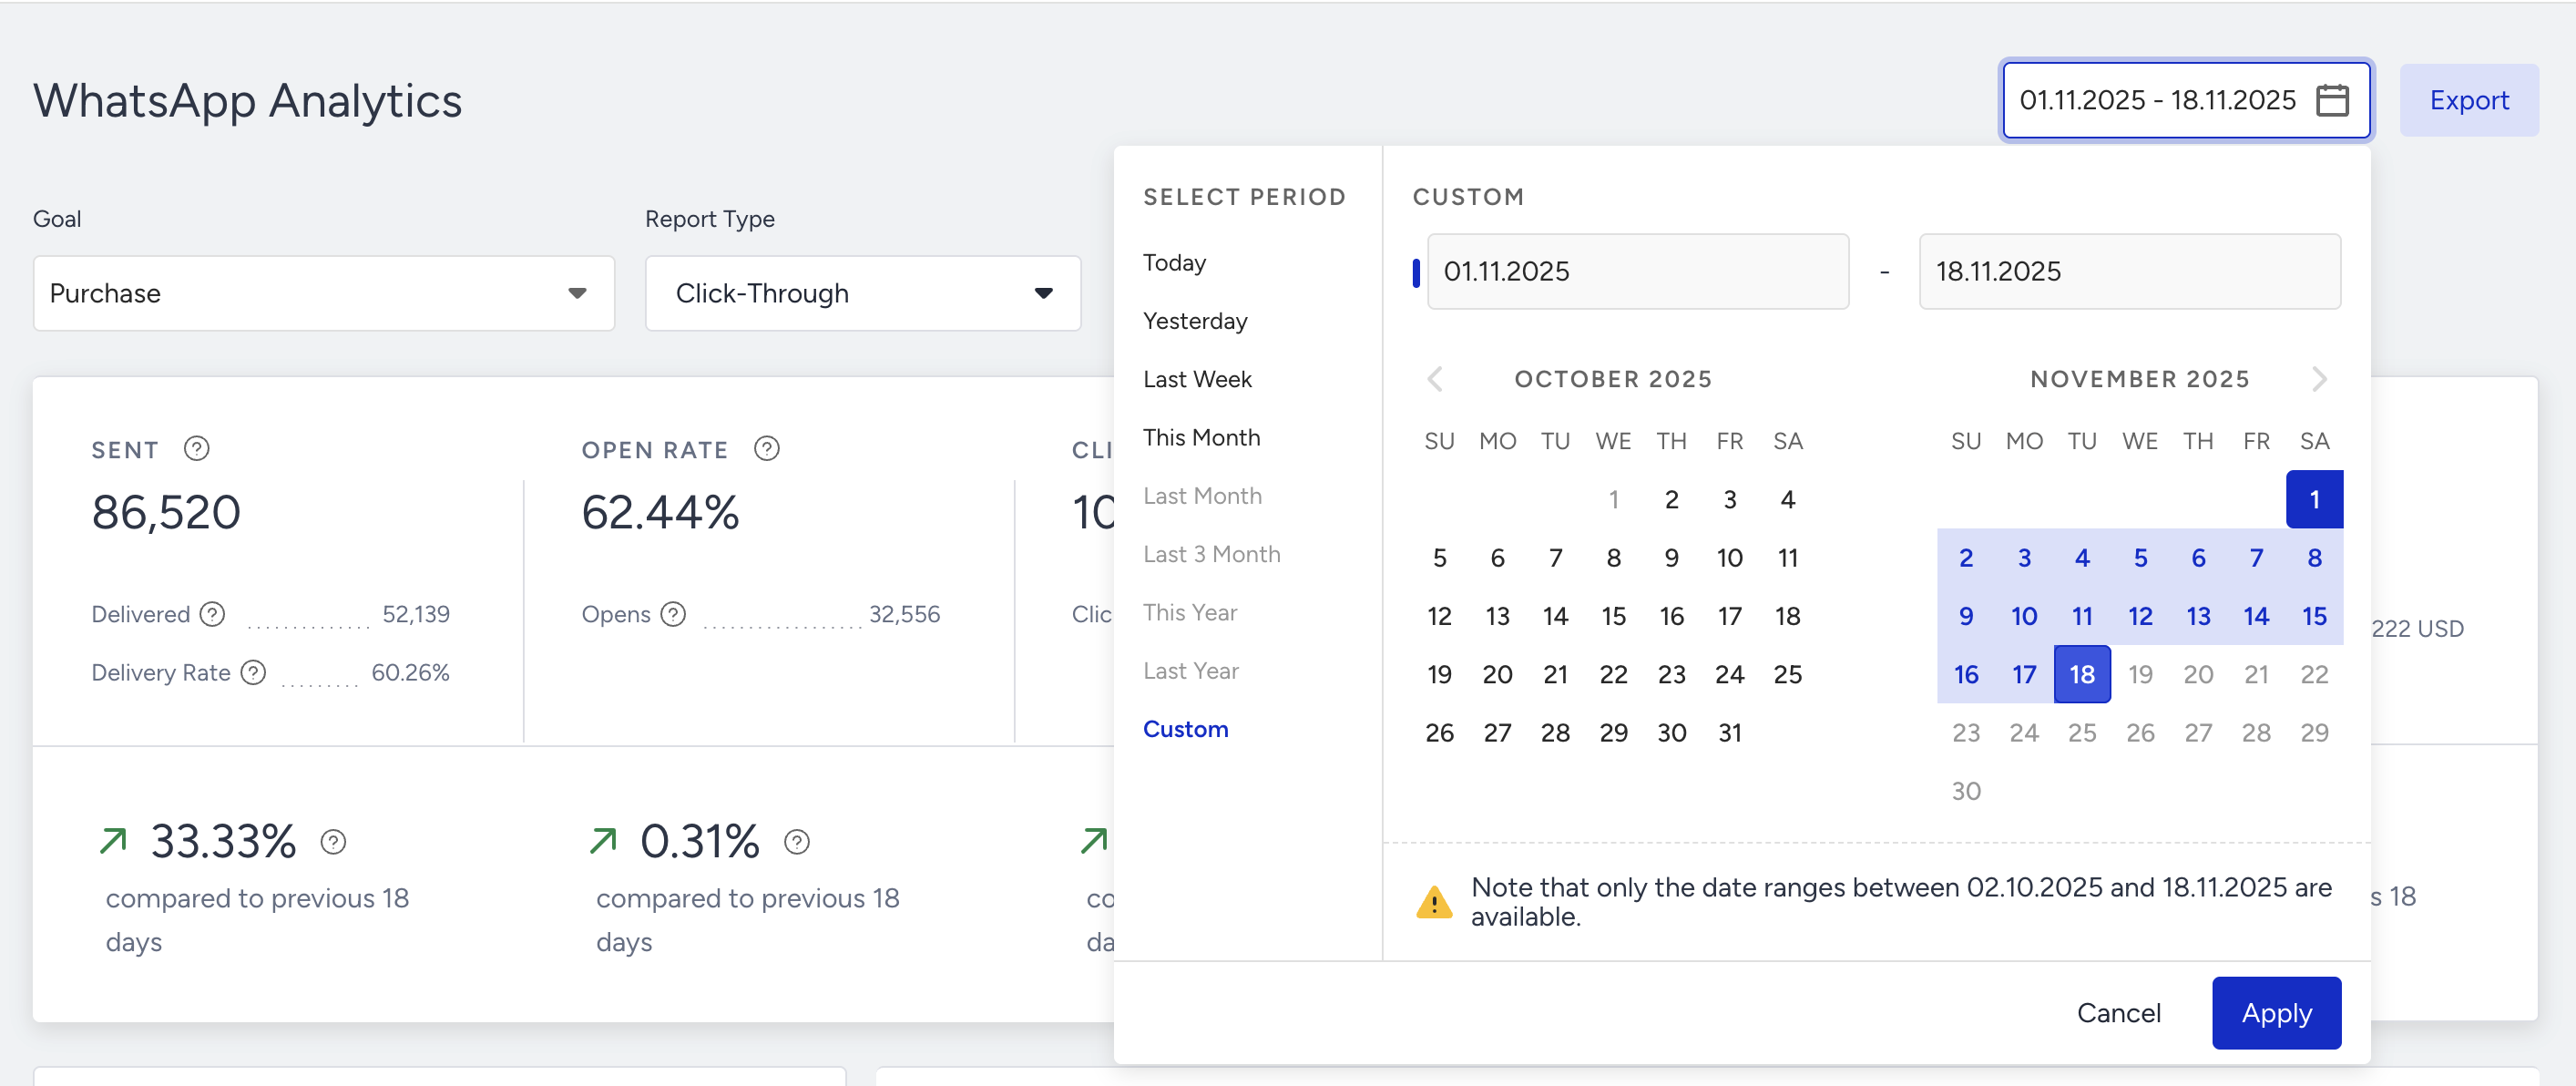
- Select a time range using the date picker in the top right corner of the page.
To export your report to Excel, click the Export button.
You can also use the Architect Channel Analytics API to export your results.
Channel metrics
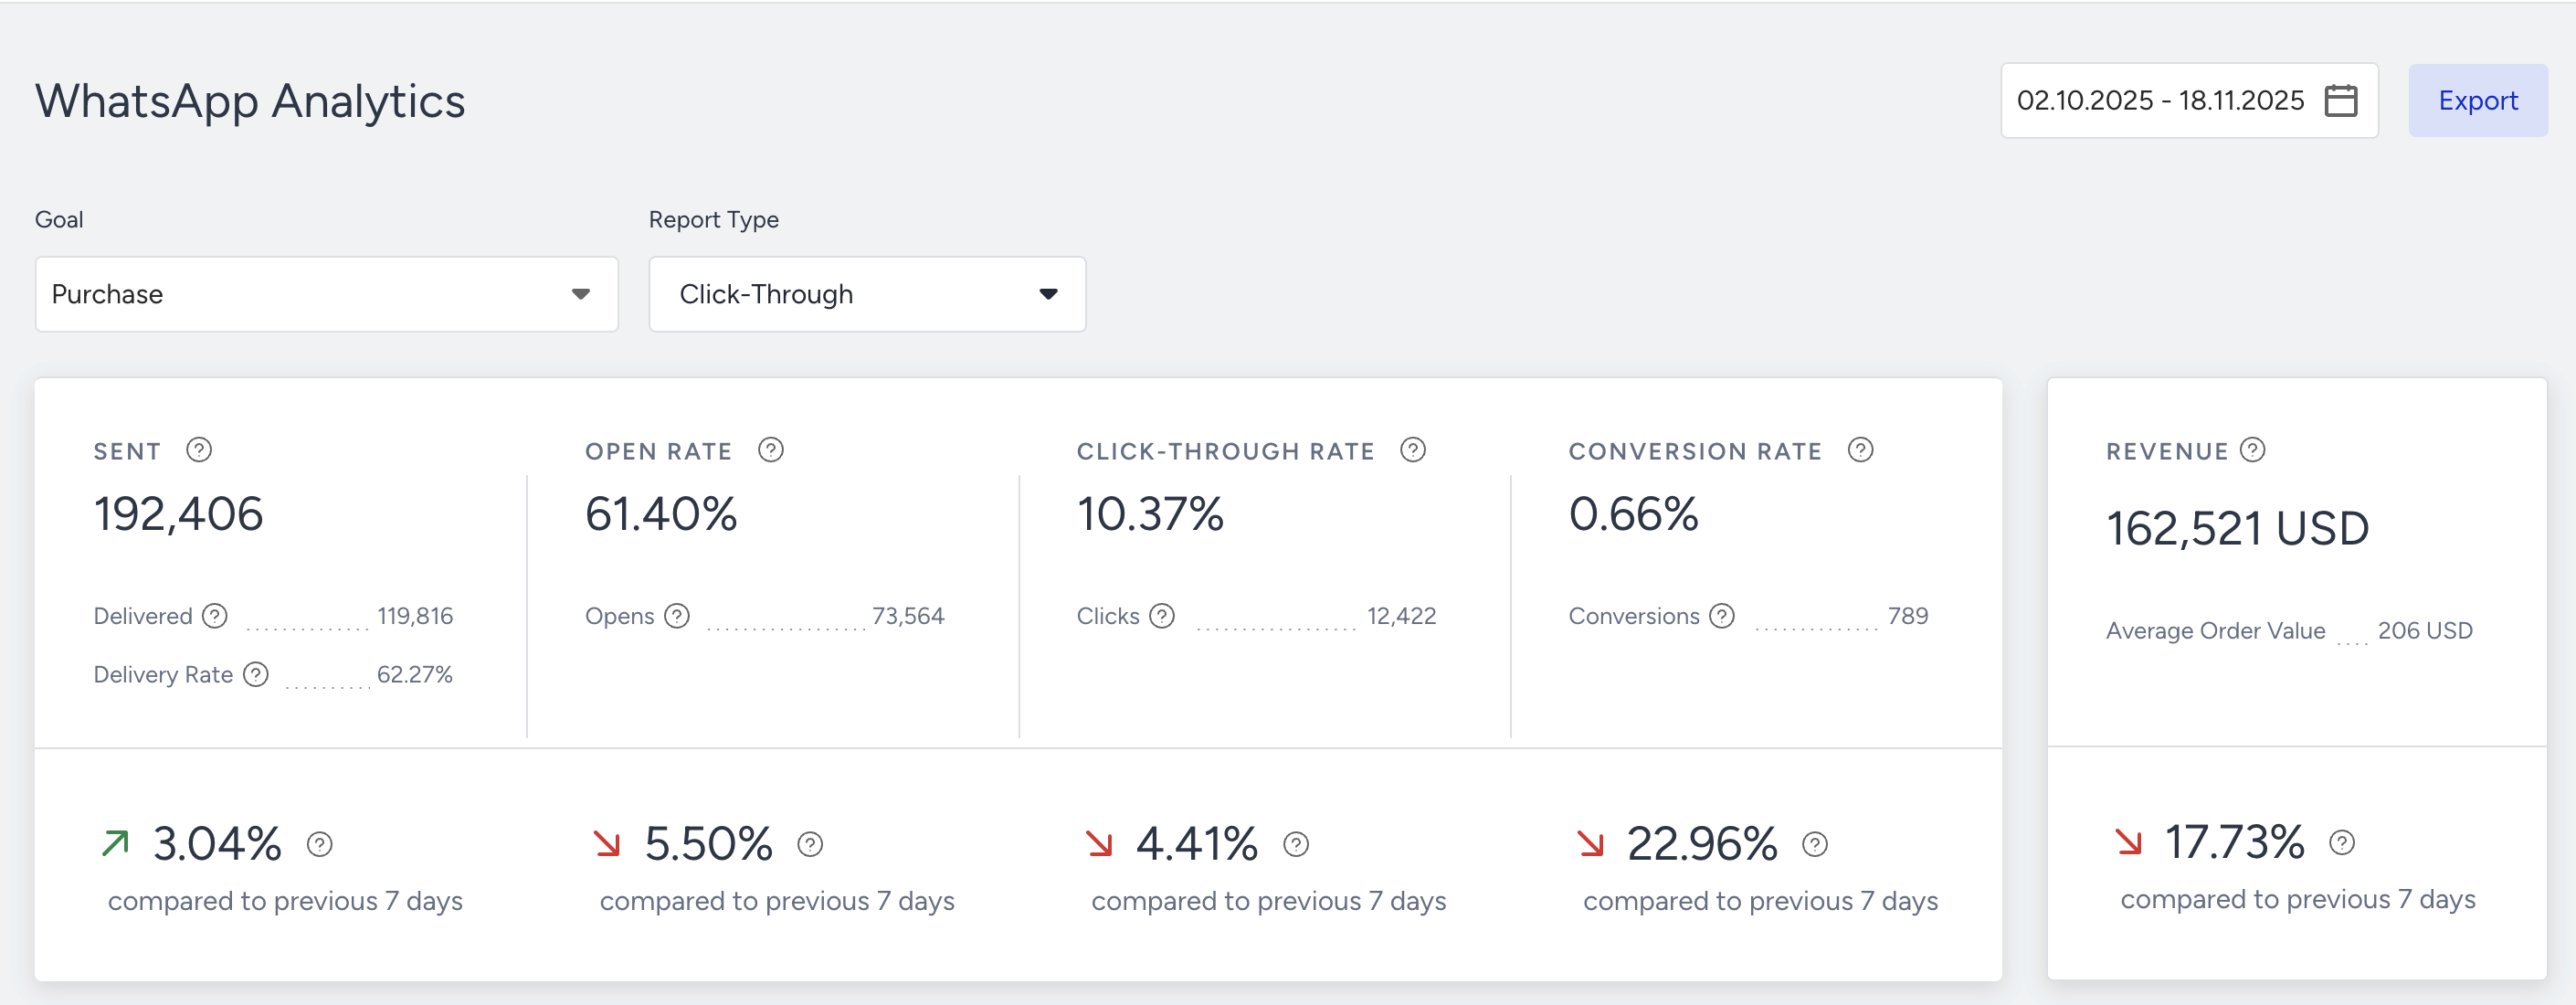
Narrowing down your results, you can see the following metrics:
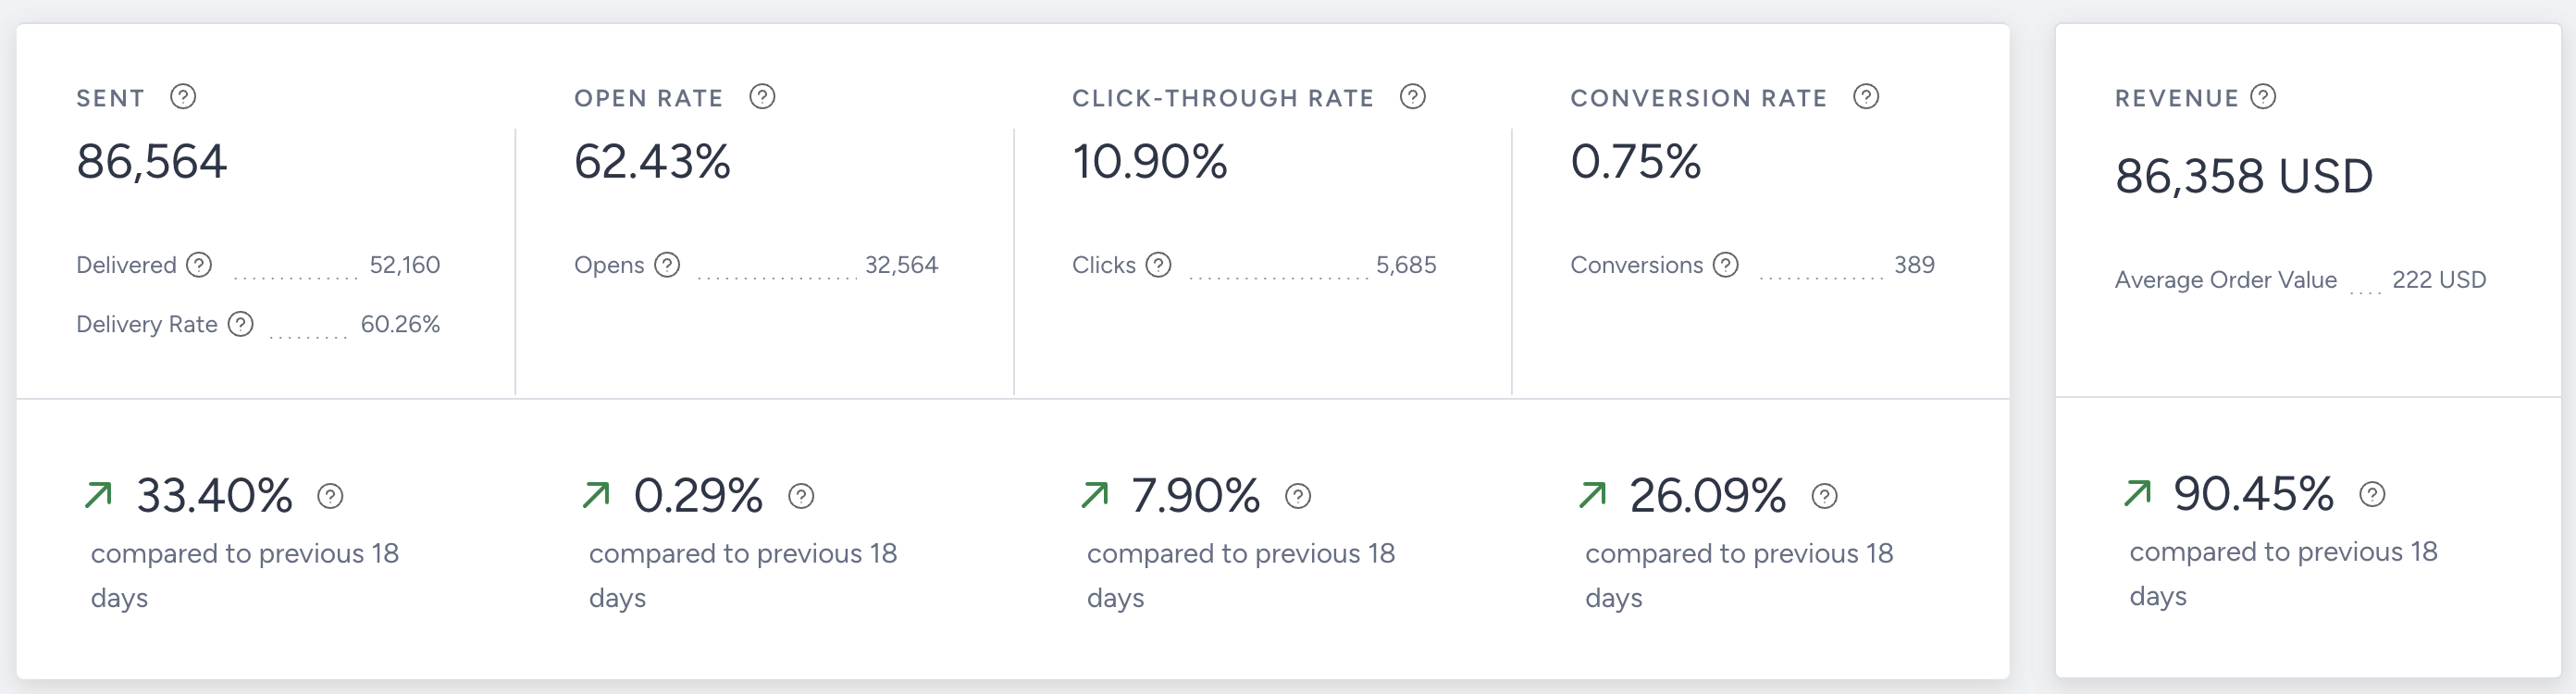
You can view incremental or decremental changes in sent, open rate, click-through rate, conversion rate, and revenue based on the selected date range. For example, when you select last month, it compares the last month to the previous month. When you select 7 days in the date picker, it compares the selected 7 days with the previous 7 days.
- Sent: The number of messages addressed to the users via WhatsApp.
- Opens: The number of Delivered messages opened by the recipients who have the Read Receipts enabled.
- Open Rate: The percentage of the Opens to the Delivered messages.
- Click-Through Rate:
The percentage of times that the users clicked the messages to the delivered messages via WhatsApp.
- Clicks: The number of times that the users clicked on the URL in the message.
- Conversion Rate:
The percentage of successful goal accomplishments to the delivered messages via WhatsApp. Conversion rate changes according to the Conversion Goal selection in the dropdown.
- Conversions: The number of successful goal accomplishments via WhatsApp. Conversion changes according to the Conversion Goal selection in the dropdown.
- Revenue:
The total value of the purchases made via WhatsApp.
- Average Order Value: The division of revenue by the number of purchases made via WhatsApp.
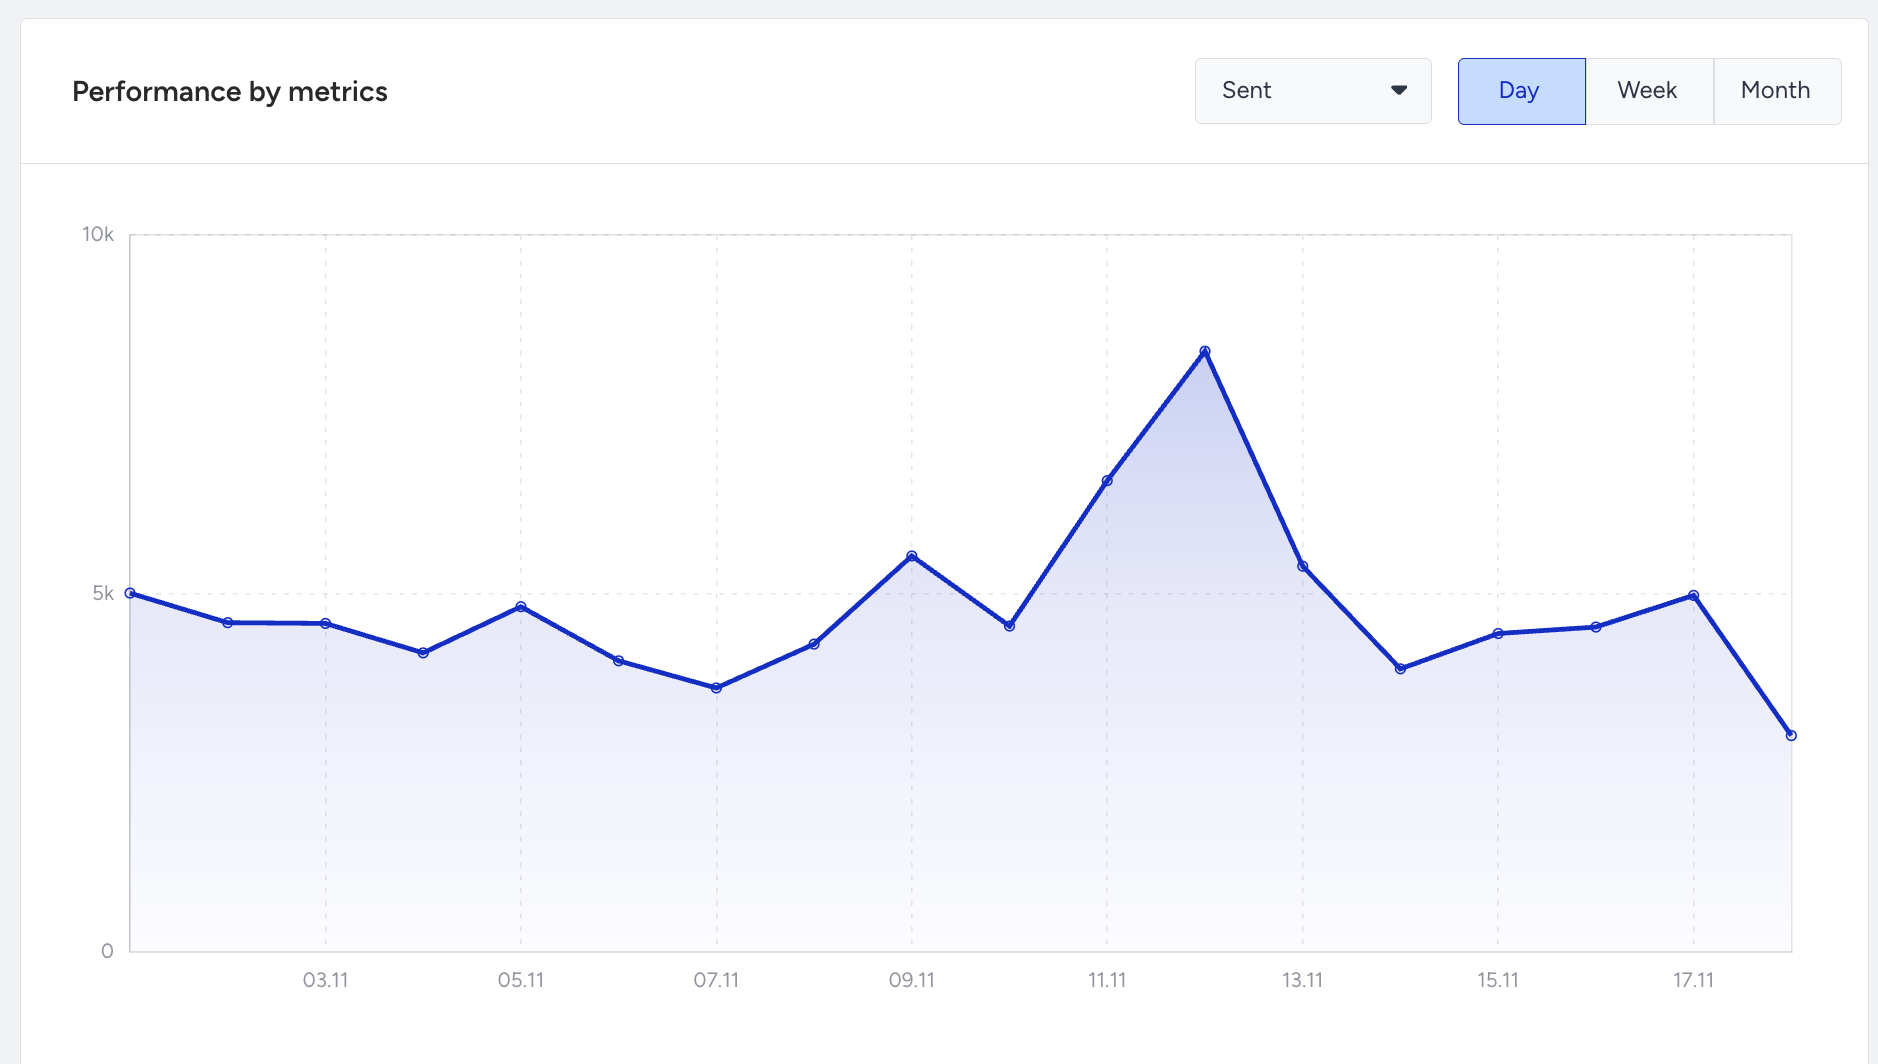
Performance by Metrics
The charts section displays the daily, weekly, or monthly details on a line chart based on your time range selection, and the metric that you can select using the dropdown on the top right corner of this section. You can select Sent, Delivered, Clicks, and Conversions to see their trend according to the selected time frame.
Unsuccessful Messages
Many factors can lead to unsuccessful messages. Under Unsuccessful Messages, you can visualize and analyze the main reasons for the Dropped and the Undelivered messages.
Dropped Messages
Dropped messages are the total number of WhatsApp messages that weren’t transferred to the service provider to be addressed to the recipients. You can check each drop reason explanation through the tooltips in the panel.
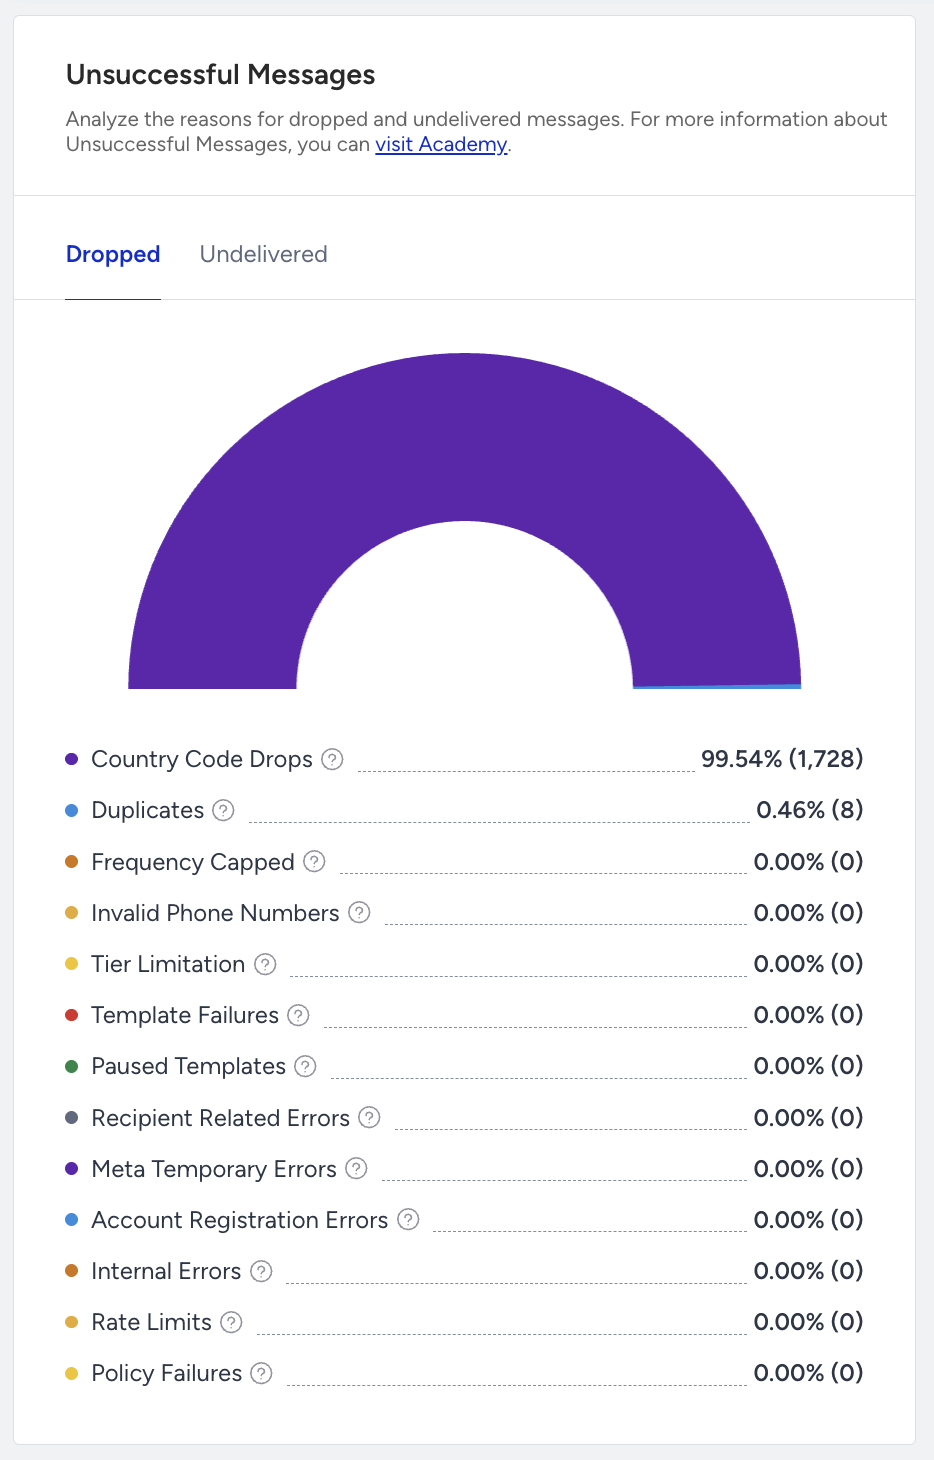
Drop reasons
- Country Code Drops: Country Code Drops is the number of dropped messages due to the phone numbers with country codes other than the specified in your contract.
- Duplicates: Duplicates is the number of Dropped messages due to the duplicate recipients in the audience.
- Frequency Capped: Frequency Capped is the number of dropped messages due to the Channel Frequency Capping settings.
- Invalid Phone Numbers: Invalid Phone Numbers is the number of dropped messages due to the phone numbers in a non-standard format.
- Tier Limitation: Tier Limitation is the number of dropped messages due to the daily messaging limit per unique recipient via WhatsApp.
- Template Failures: Template Failures is the number of dropped messages due to any mismatch in the template elements.
- Paused Templates: Paused Templates is the number of Dropped messages due to the message templates had been paused by Meta since too much negative feedback was given by the recipients.
- Recipient Related Errors: Recipient Related Drops is the percentage (and the number) of dropped messages due to the various issues with the recipient's WhatsApp Account.
- Meta Temporary Errors: Meta Temporary Errors is the number of dropped messages due to temporary issues at Meta.
- Account Registration Errors: Account Registration Errors is the number of dropped messages due to registration issues of your phone number at Meta.
- Internal Errors: Internal Errors is the number of dropped messages due to various internal system issues.
- Rate Limits: Rate Limits is the number of dropped messages due to your account exceeding various rate limits of Meta.
- Policy Failures: Policy Failures is the number of dropped messages due to violating Meta policies.
Undelivered Messages
Undelivered Messages are the total number of WhatsApp messages that weren’t addressed to the recipients by the service provider. You can check each undelivered reason explanation through the tooltips in the panel.
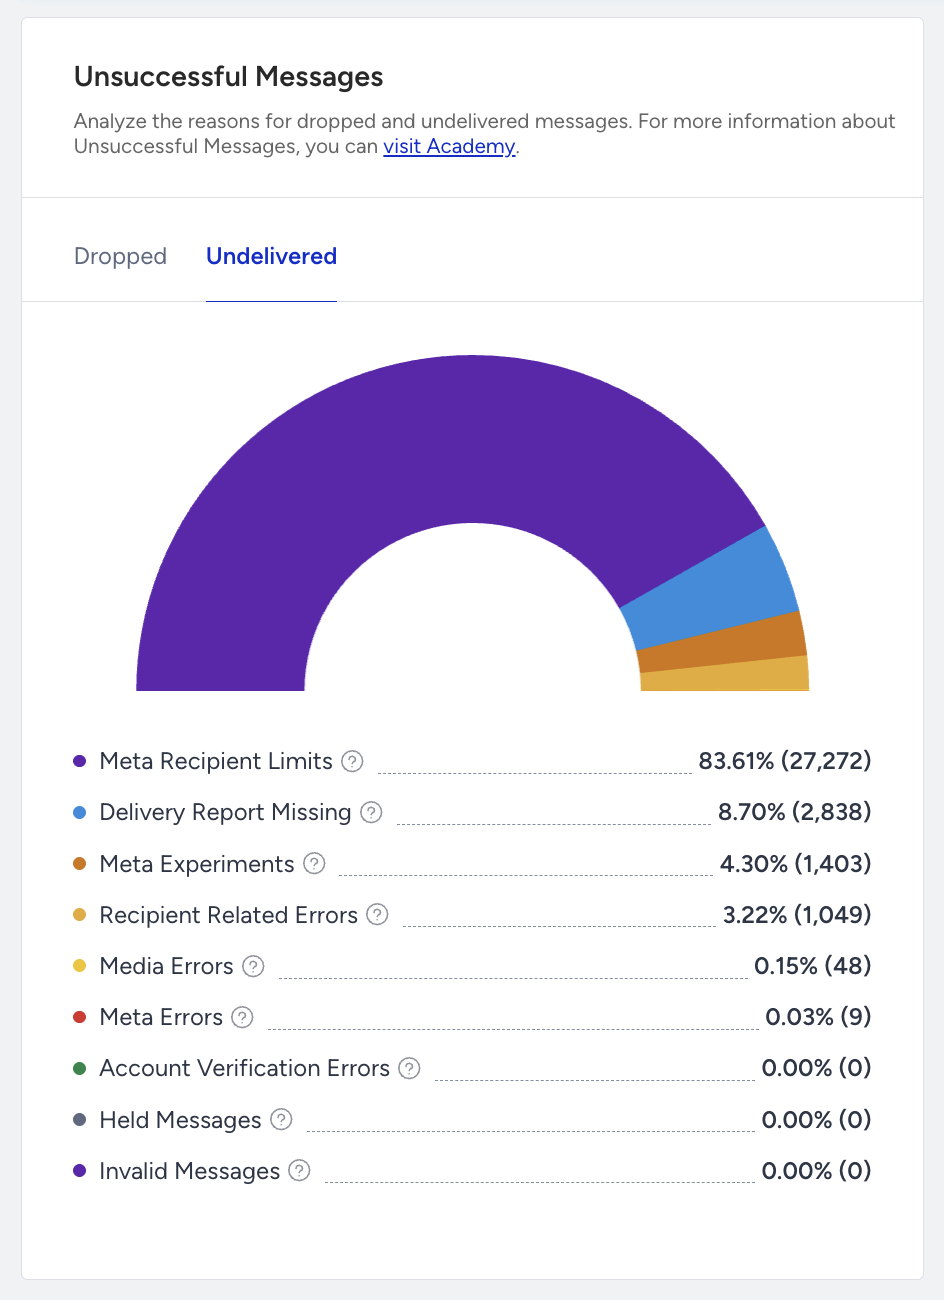
Undelivered reasons
- Meta Recipient Limits: Meta Recipient Limits is the number of undelivered messages due to the Marketing messaging limit per unique recipient set by Meta.
- Delivery Report Missing: Delivery Report Missing is the number of undelivered messages due to no delivery reports received from Meta.
- Meta Experiments: Meta Experiments is the percentage (and the number) of undelivered messages due to experimental features tested by Meta on specific WhatsApp users.
- Recipient Related Errors: Recipient Related Errors is the percentage (and the number) of undelivered messages due to the various issues with the recipient's WhatsApp Account.
- Media Errors: Media Errors is the percentage (and the number) of undelivered messages due to issues with the media elements of your message templates.
- Meta Errors: Meta Errors is the number of undelivered messages due to unexpected rejections by Meta.
- Account Verification Errors: Account Verification Errors is the number of undelivered messages due to verification issues of your phone number at Meta.
- Held Messages: Held Messages is the percentage (and the number) of undelivered messages due to the messages held by Meta since too much negative feedback was given by the recipients.
- Invalid Messages: Invalid Messages is the number of undelivered messages due to uncertain issues with your message content.
Conversational Message Analytics
Conversational Message Analytics are just as same with the Promotional Message Analytics. Other than the Promotional Message Analytics, it contains:
- Performance by Custom Response
- Custom Response Options Activity
- Link Click Activity
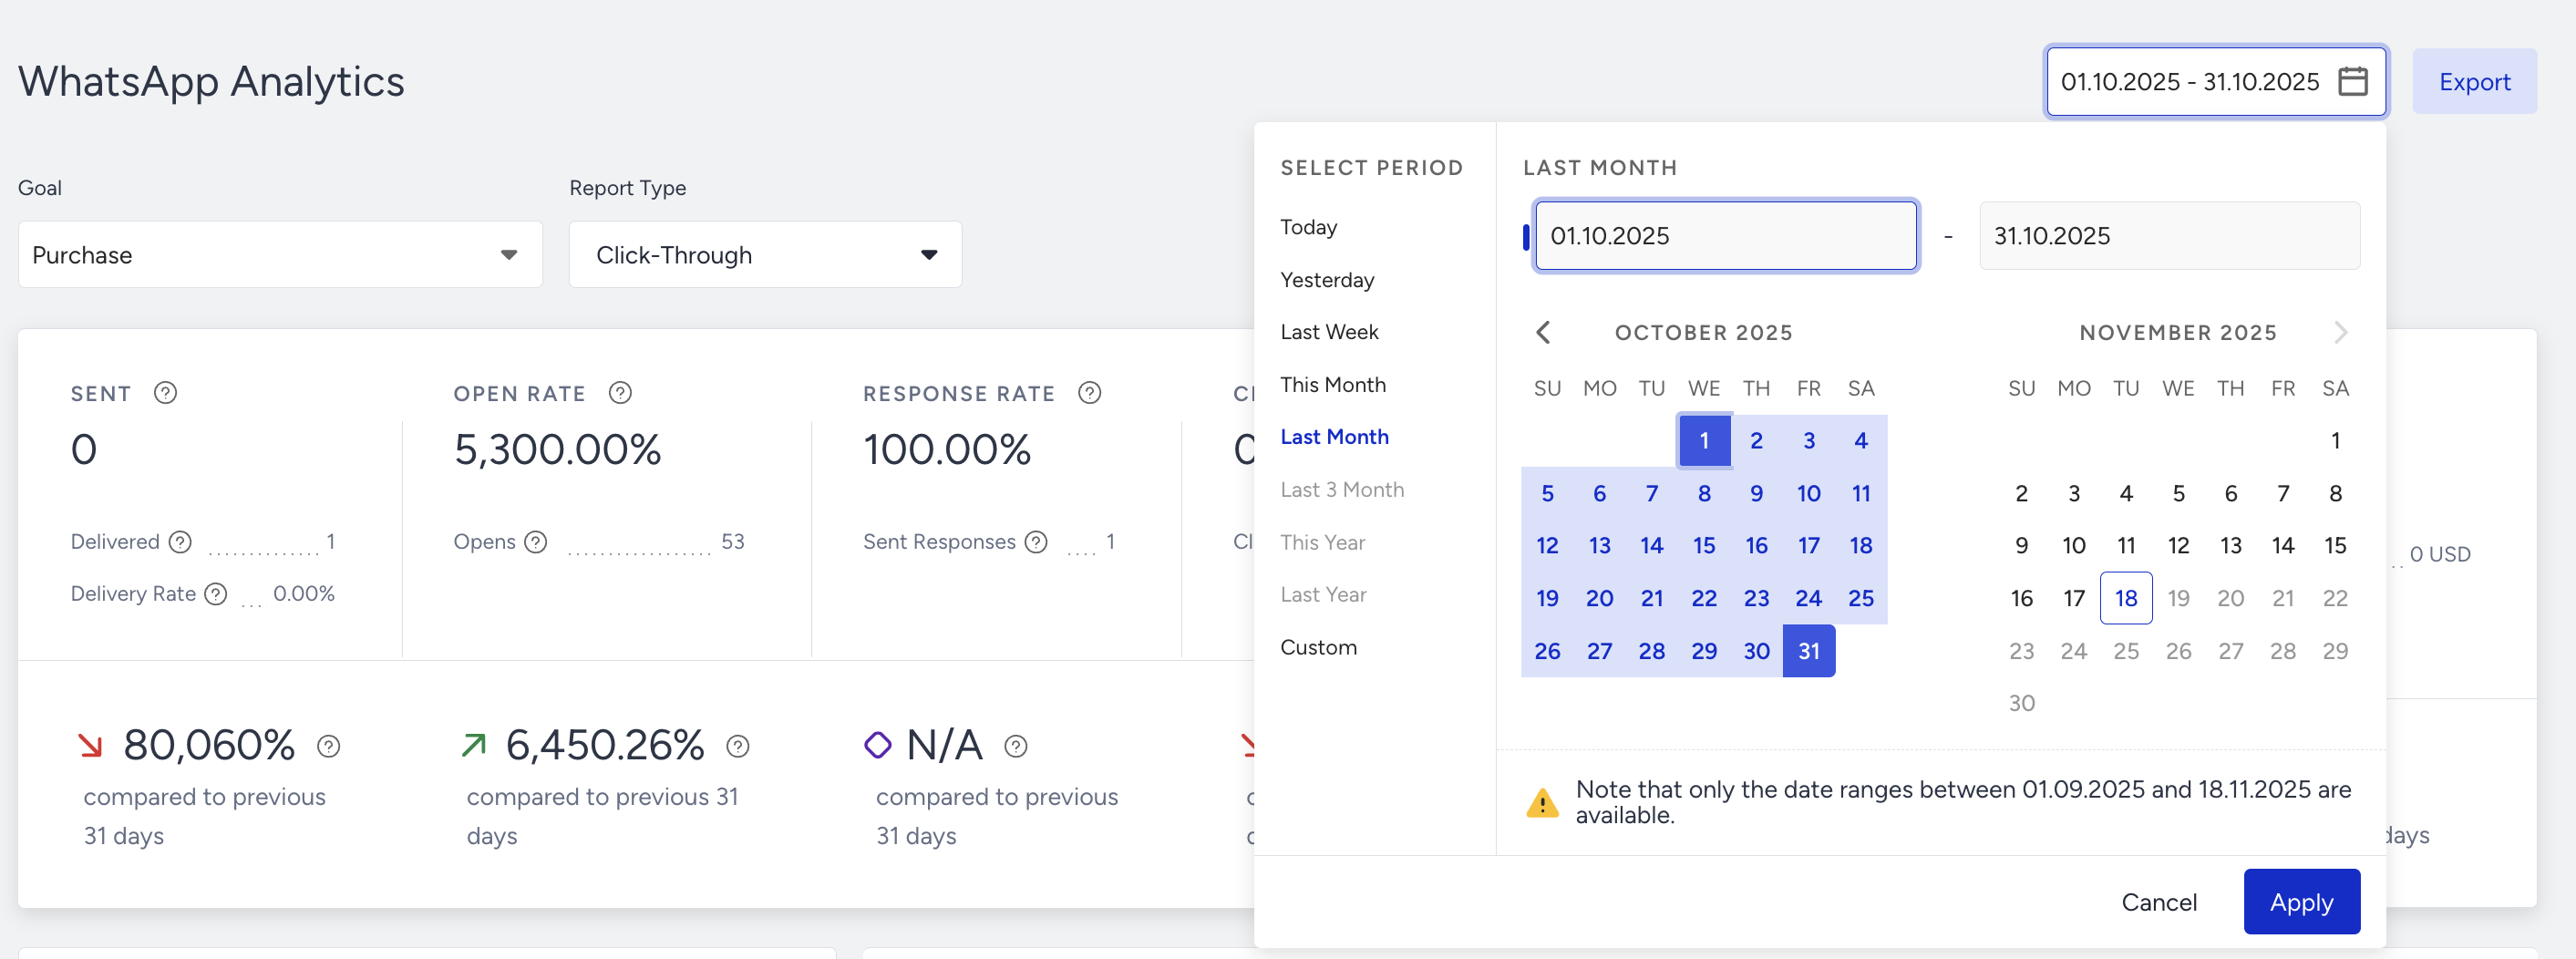
You can filter the channel performance metrics by:
- Selecting a goal to evaluate your WhatsApp conversion and conversion rate metrics using the dropdown in the top left corner of the page.
- Selecting a time range using the date picker in the top right corner of the page.
You can also click the Export button to export your report to Excel.
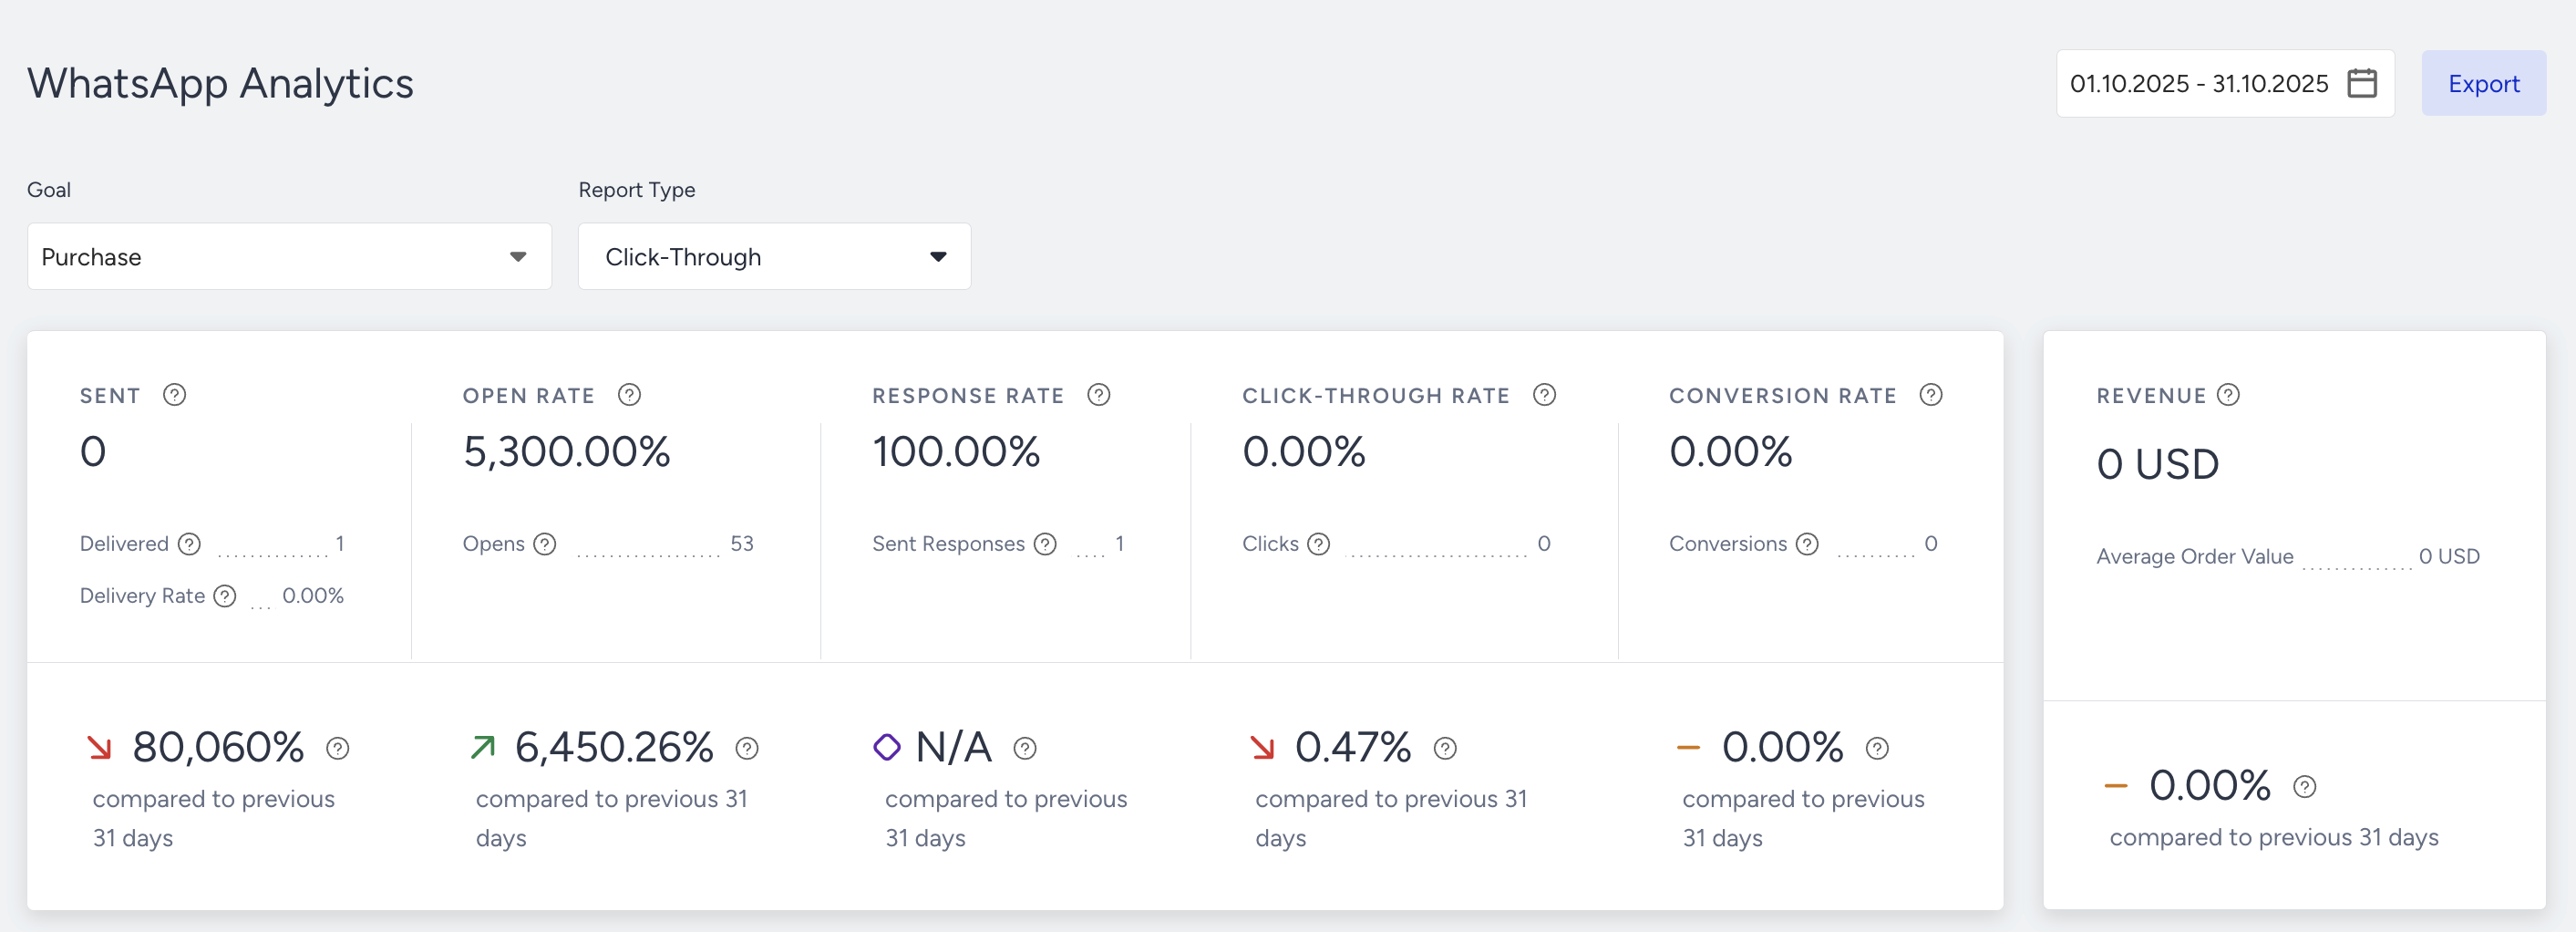
Channel metrics
Narrowing down your results, you can see the following metrics:
.png)
You can view incremental or decremental changes in sent, open rate, response rate, click-through rate, conversion rate, and revenue based on the selected date range. For example, when you select last month, it compares the last month to the previous month. When you select 7 days in the date picker, it compares the selected 7 days with the previous 7 days.
- Sent: The number of messages addressed to the users via WhatsApp.
- Delivered: The number of messages delivered to the users via WhatsApp.
- Open Rate: The percentage of the Opens to the Delivered messages.
- Opens: The number of delivered messages opened by the recipients who have the Read Receipts enabled.
- Opens: The number of delivered messages opened by the recipients who have the Read Receipts enabled.
- Response rate: The percentage of the times that the user responded to the messages to the delivered messages via WhatsApp.
- Sent responses: The number of times the user responded to the message via WhatsApp.
- Click-through rate: The percentage of times that the users clicked the messages to the delivered messages via WhatsApp.
- Clicks: The number of times that the users clicked on the URL in the message.
- Conversion rate: The percentage of successful goal accomplishments to the delivered messages via WhatsApp. The conversion rate changes according to the Conversion Goal selection on the dropdown.
- Conversions: The number of successful goal accomplishments via WhatsApp. Conversion changes according to the Conversion Goal selection in the dropdown.
- Revenue: The total value of the purchases made via WhatsApp.
- Average Order Value: The division of revenue by the number of purchases made via WhatsApp.
Performance by Metrics
The charts section displays the daily, weekly, or monthly details on a line chart based on your time range selection, and the metric that you can select using the dropdown on the top left corner of this section. You can select Sent, Delivered, Clicks, and Conversions to view trends for the selected time frame.
.png)
Unsuccessful Messages
Many factors can lead to unsuccessful messages. Under Unsuccessful Messages, you can visualize and analyze the main reasons for the Dropped and the Undelivered messages.
Dropped Messages
Dropped messages are the total number of WhatsApp messages that weren’t transferred to the service provider to be addressed to the recipients. You can check each drop reason explanation through the tooltips in the panel.
Drop reasons
- Country Code Drops: Country Code Drops is the number of dropped messages due to the phone numbers with country codes other than the specified in your contract.
- Duplicates: Duplicates is the number of Dropped messages due to the duplicate recipients in the audience.
- Frequency Capped: Frequency Capped is the number of dropped messages due to the Channel Frequency Capping settings.
- Invalid Phone Numbers: Invalid Phone Numbers is the number of dropped messages due to the phone numbers in a non-standard format.
- Tier Limitation: Tier Limitation is the number of dropped messages due to the daily messaging limit per unique recipient via WhatsApp.
- Template Failures: Template Failures is the number of dropped messages due to any mismatch in the template elements.
- Paused Templates: Paused Templates is the number of Dropped messages due to the message templates had been paused by Meta since too much negative feedback was given by the recipients.
- Recipient Related Errors: Recipient Related Drops is the percentage (and the number) of dropped messages due to the various issues with the recipient's WhatsApp Account.
- Meta Temporary Errors: Meta Temporary Errors is the number of dropped messages due to temporary issues at Meta.
- Account Registration Errors: Account Registration Errors is the number of dropped messages due to registration issues of your phone number at Meta.
- Internal Errors: Internal Errors is the number of dropped messages due to various internal system issues.
- Rate Limits: Rate Limits is the number of dropped messages due to your account exceeding various rate limits of Meta.
- Policy Failures: Policy Failures is the number of dropped messages due to violating Meta policies.
Undelivered Messages
Undelivered Messages are the total number of WhatsApp messages that weren’t addressed to the recipients by the service provider. You can check each undelivered reason explanation through the tooltips in the panel.
Undelivered reasons
- Meta Recipient Limits: Meta Recipient Limits is the number of undelivered messages due to the Marketing messaging limit per unique recipient set by Meta.
- Delivery Report Missing: Delivery Report Missing is the number of undelivered messages due to no delivery reports received from Meta.
- Meta Experiments: Meta Experiments is the percentage (and the number) of undelivered messages due to experimental features tested by Meta on specific WhatsApp users.
- Recipient Related Errors: Recipient Related Errors is the percentage (and the number) of undelivered messages due to the various issues with the recipient's WhatsApp Account.
- Media Errors: Media Errors is the percentage (and the number) of undelivered messages due to issues with the media elements of your message templates.
- Meta Errors: Meta Errors is the number of undelivered messages due to unexpected rejections by Meta.
- Account Verification Errors: Account Verification Errors is the number of undelivered messages due to verification issues of your phone number at Meta.
- Held Messages: Held Messages is the percentage (and the number) of undelivered messages due to the messages held by Meta since too much negative feedback was given by the recipients.
- Invalid Messages: Invalid Messages is the number of undelivered messages due to uncertain issues with your message content.
Performance by Custom Response
This section shows the performance of your WhatsApp messages.
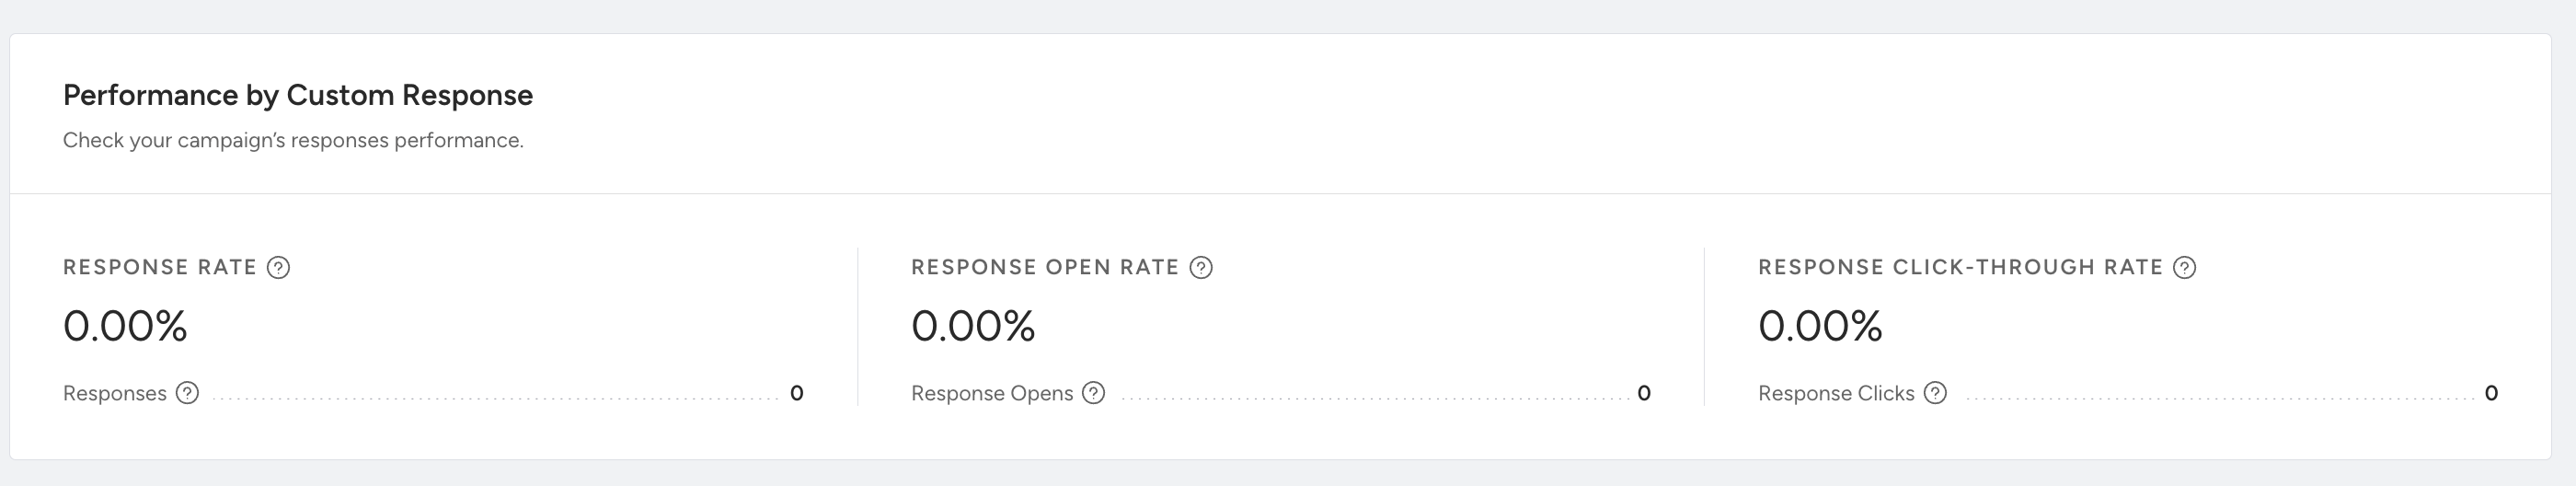
- Response Rate:The percentage of the Responses to the Delivered messages.
- Responses: The total number of response messages delivered to the recipients who replied to your initial messages.
- Response Open Rate: The percentage of the Response Opens to the Responses.
- Response Opens: The total number of Responses opened by the recipients who have the Read Receipts enabled.
- Response Click-Through: The percentage of the Response Clicks to the Responses.
- Response Clicks: The total number of times the recipients clicked the links in your Responses.
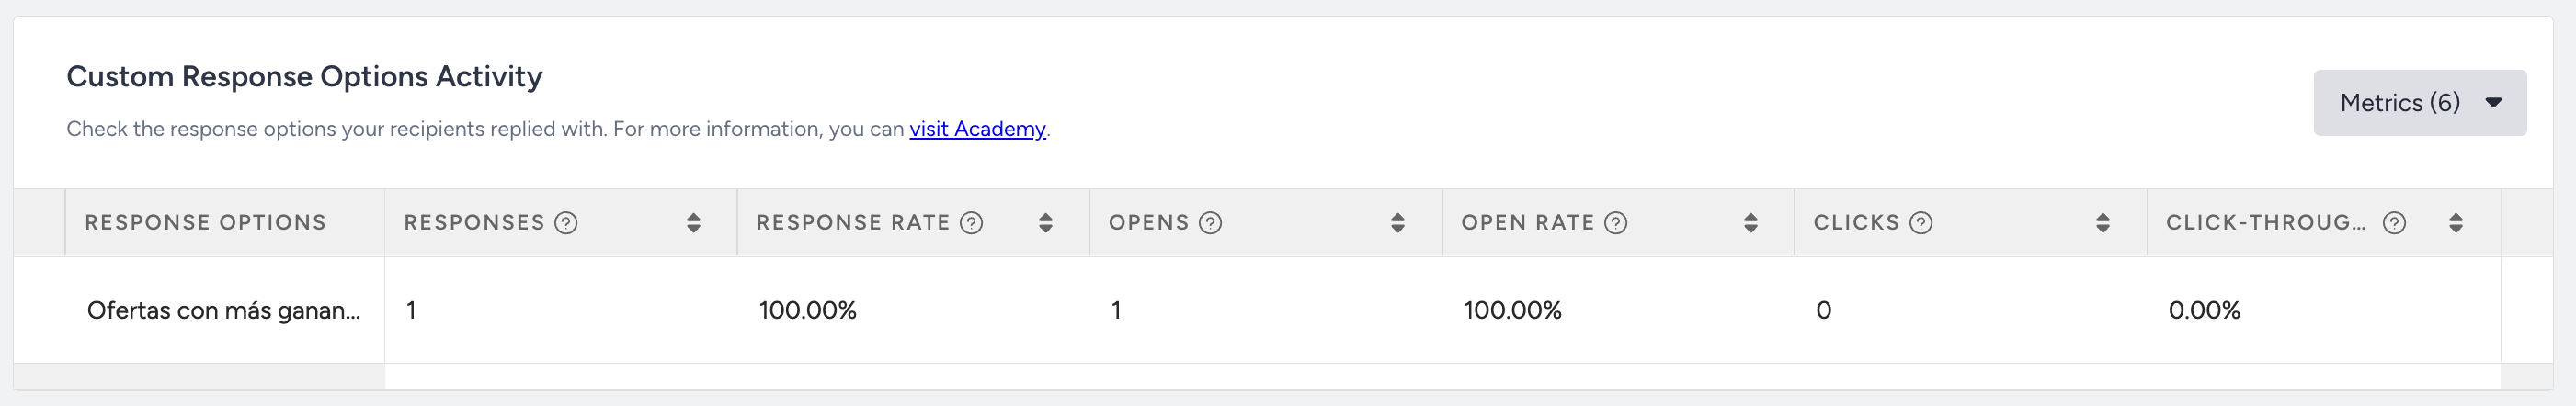
Custom Response Options Activity
This table shows the activity of the custom responses in your WhatsApp messages. You can evaluate the performance of different response options to determine which performs better.
External Platform Response Options Activity
If you have connected an External Platform to give responses to your users, you can track their button clicks and button click rates in this table as well.
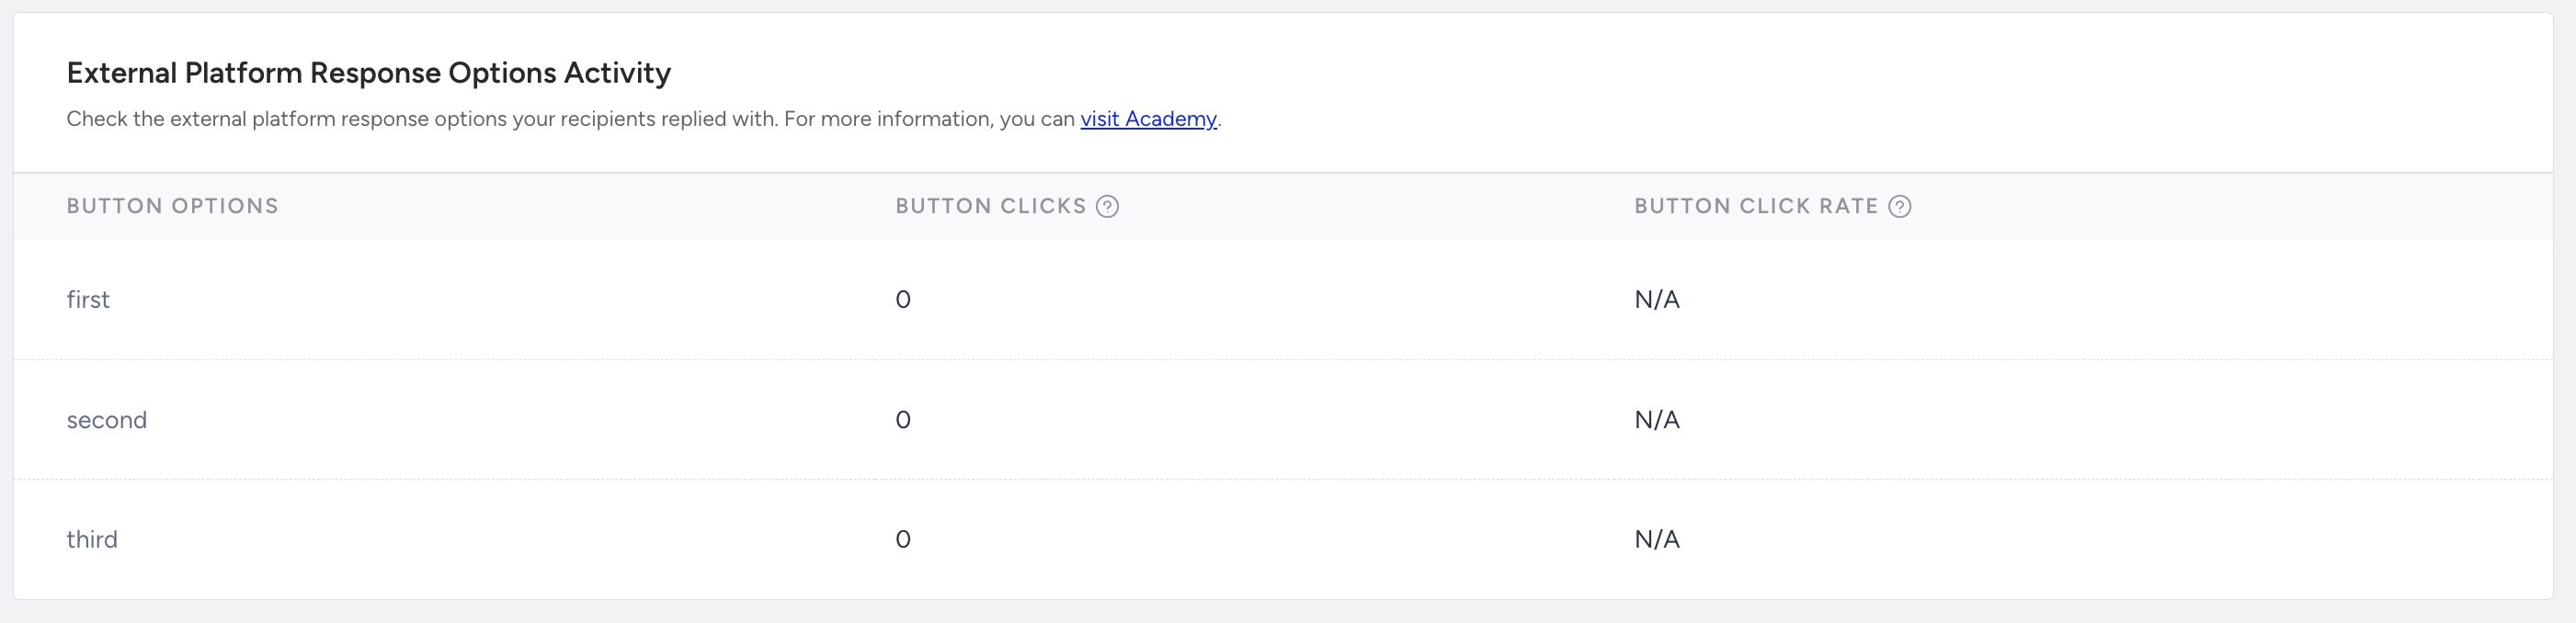
- Button Clicks: The total number of times the recipients clicked the external platform responses.
- Button Click Rate: The percentage of the Button Clicks to the Delivered messages.
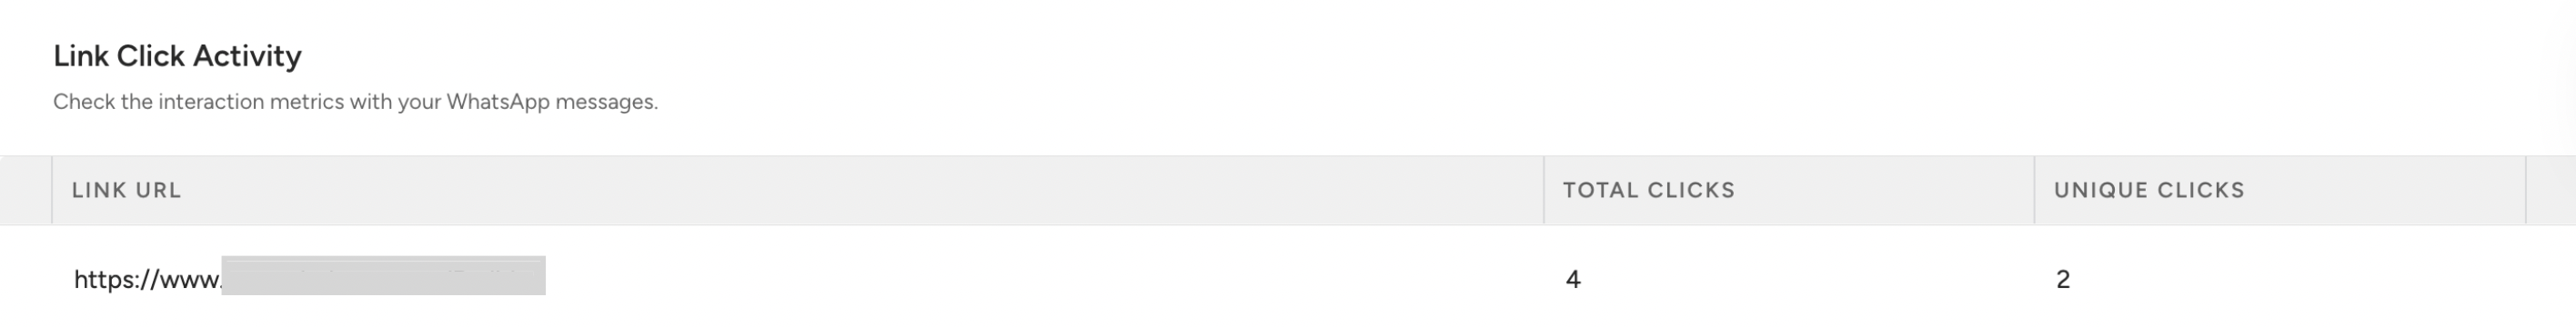
Link Click Activity
This table shows the click interactions in the links you used in your WhatsApp messages.