You can evaluate your results based on campaign-specific metrics to gain a deeper understanding of your Web Templates campaigns. With our real-time analytics, you can track their performance and effectiveness and take the necessary action accordingly.
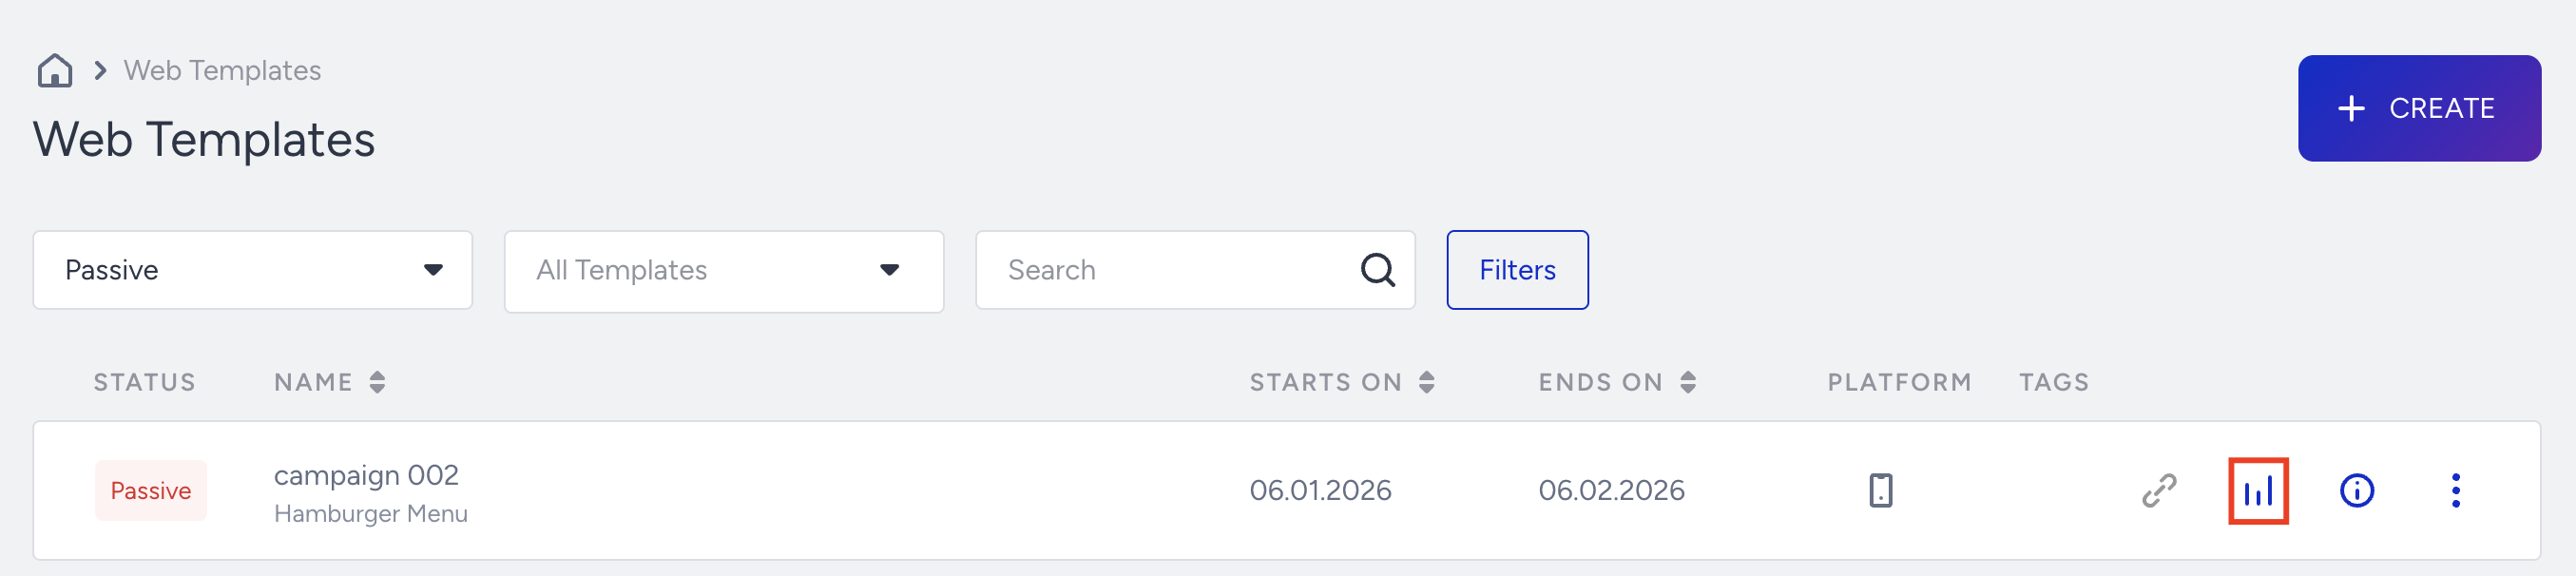
To measure campaign-level performance, click Analytics on the campaign you want to view details for on the Web Templates campaign listing page.
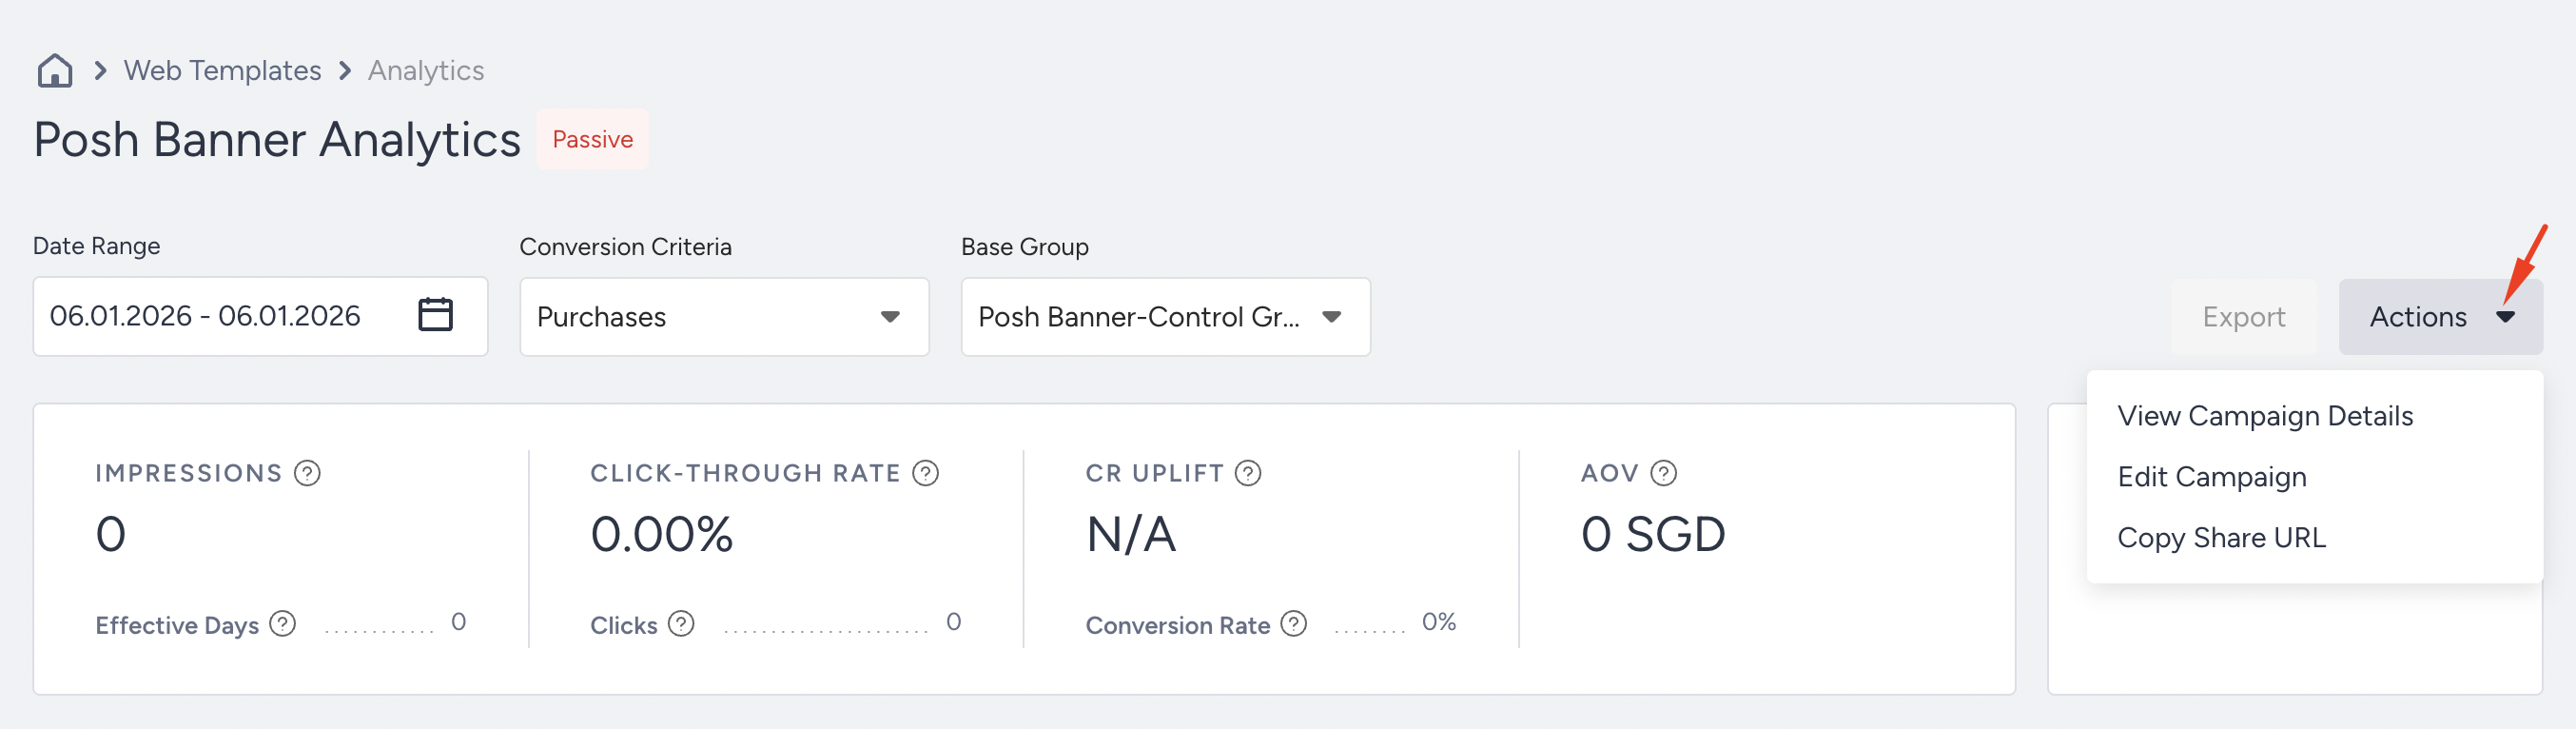
You can view the results based on the time range you select. You can export the result by clicking Export as an Excel file or a URL to share.
You can edit your campaign page or view the details via the Actions menu.
Impression Funnel
You can change the Goal and Base Group to see the performance.
Impressions: The number of times that your users viewed your variant.
Effective Days: The number of days during which at least one variant had been viewed more than 10 times.
Click-through Rate: The percentage of Clicks to Impressions.
Clicks: The total number of times that users clicked the links in your variants.
CR Uplift: Conversion Rate uplift of the most successful variant compared to the control group.
Conversion Rate: The percentage of Conversions to Impressions.
Incremental Value: Calculated the difference between the most successful variation and the control group.
If your campaign has a lead collection template except for the Web Push Opt-in Reminder, you will also see the Leads Collected metric. Users who see this campaign and subscribe to the respective channel will be reflected in the Leads Collected metric.
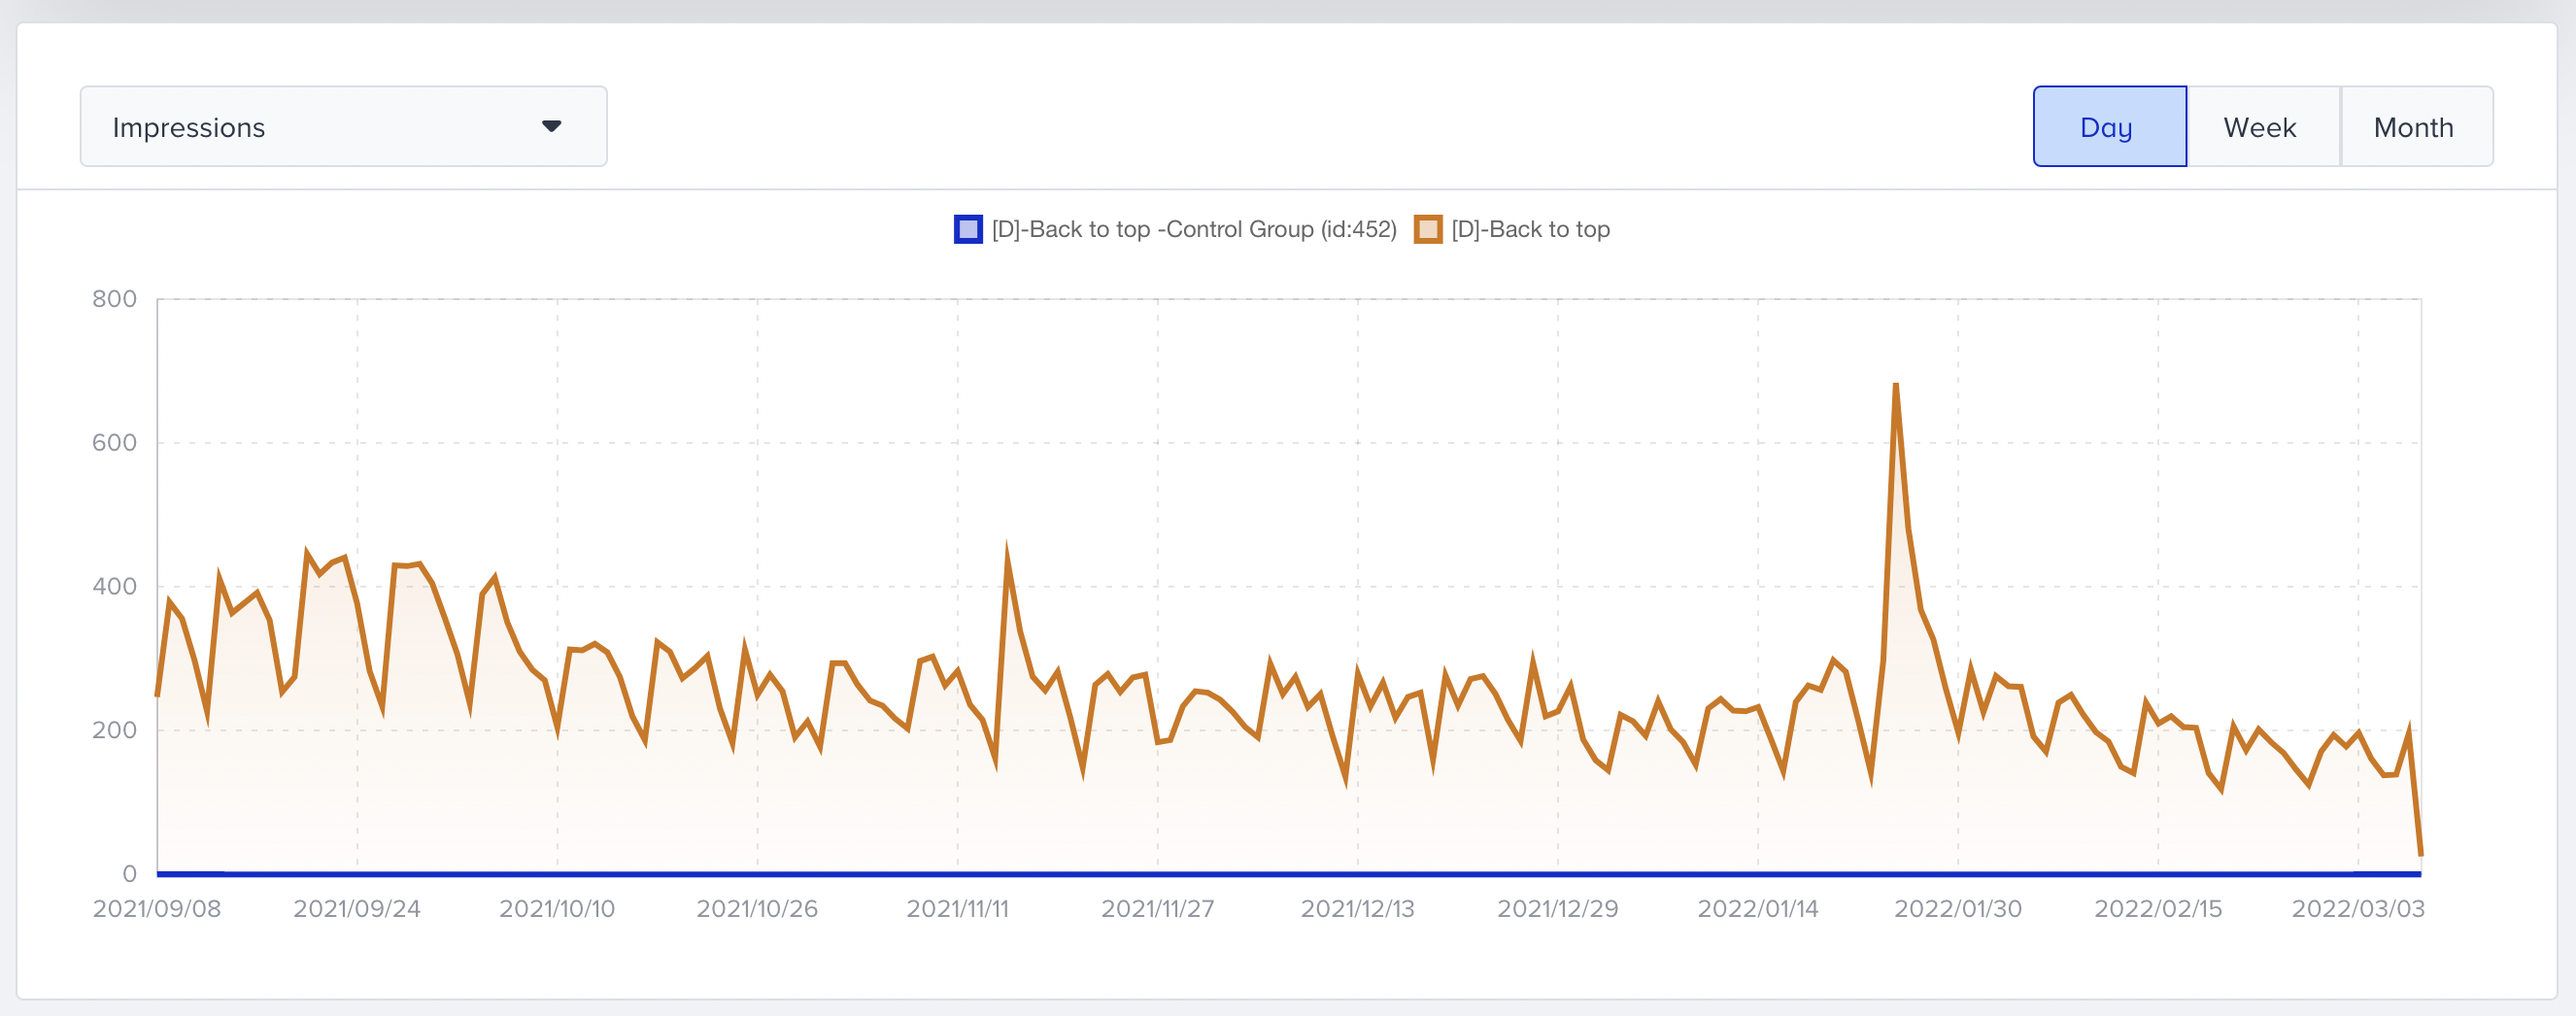
Metrics
You can analyze metrics based on impressions, conversions, and conversion rates on a daily, weekly, or monthly basis.
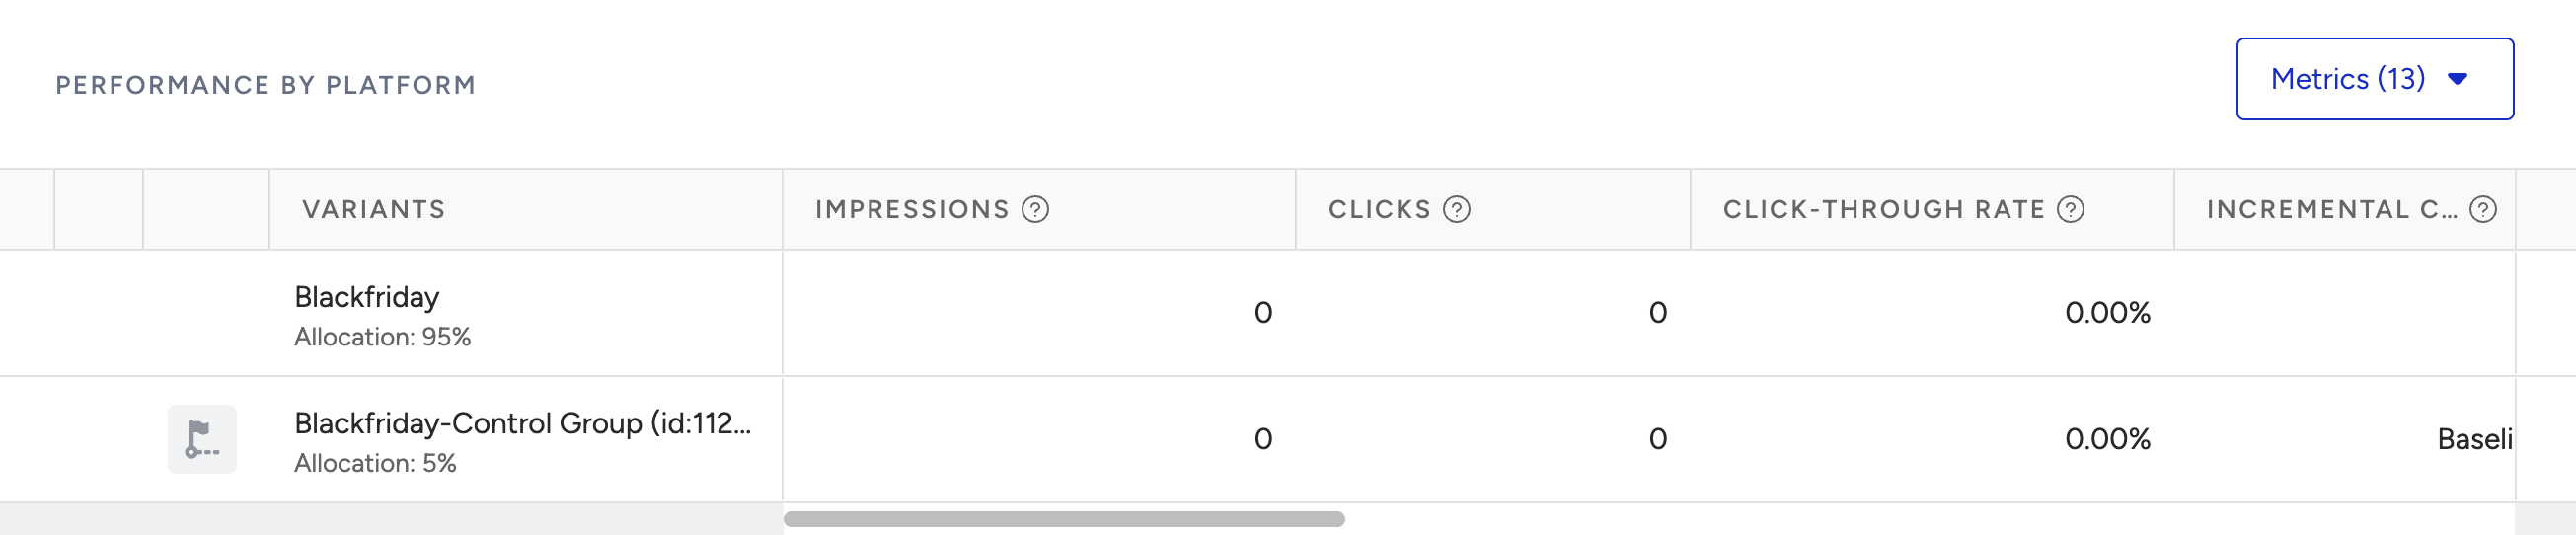
Purchases Goal Metrics
You can select and compare the Purchase goals metrics for your variations.
Impression: The number of unique visitors who became part of the variation.
Conversion: The number of successful primary goal conversions.
Conversion Rate: The number of conversions divided by the number of delivered campaigns.
Uplift: Increase in the conversion rate of variation compared to the control group.
Significance: Expressed as a percentage, it indicates whether a campaign or personalization is effective in prompting action, based on the impressions or uplift.
Probability to Win: Refer to Probability to Win.
Incremental Revenue: Extra revenue from personalization campaigns versus the control group.
Incremental Conversion: Additional conversions from personalization campaigns compared to the control group.
Revenue: The value of purchases made from your variant.
Average Order Value (AOV): The revenue ratio to the total number of purchases.
AOV Uplift: The percentage difference in the Average Order Value between the variant and the control group.
If your campaign has a Lead Collection template, you will also see the Leads Collected metric. Users who see this campaign and subscribe to the respective channel will be reflected in the Leads Collected metric.
For further information, refer to Metric definitions.
Read more on OnSite Analytics about overall campaign analytics.