You can evaluate your results based on campaign-specific metrics to gain a deeper understanding of your campaigns. With our real-time analytics, you can track their performance and effectiveness and take your next action accordingly.
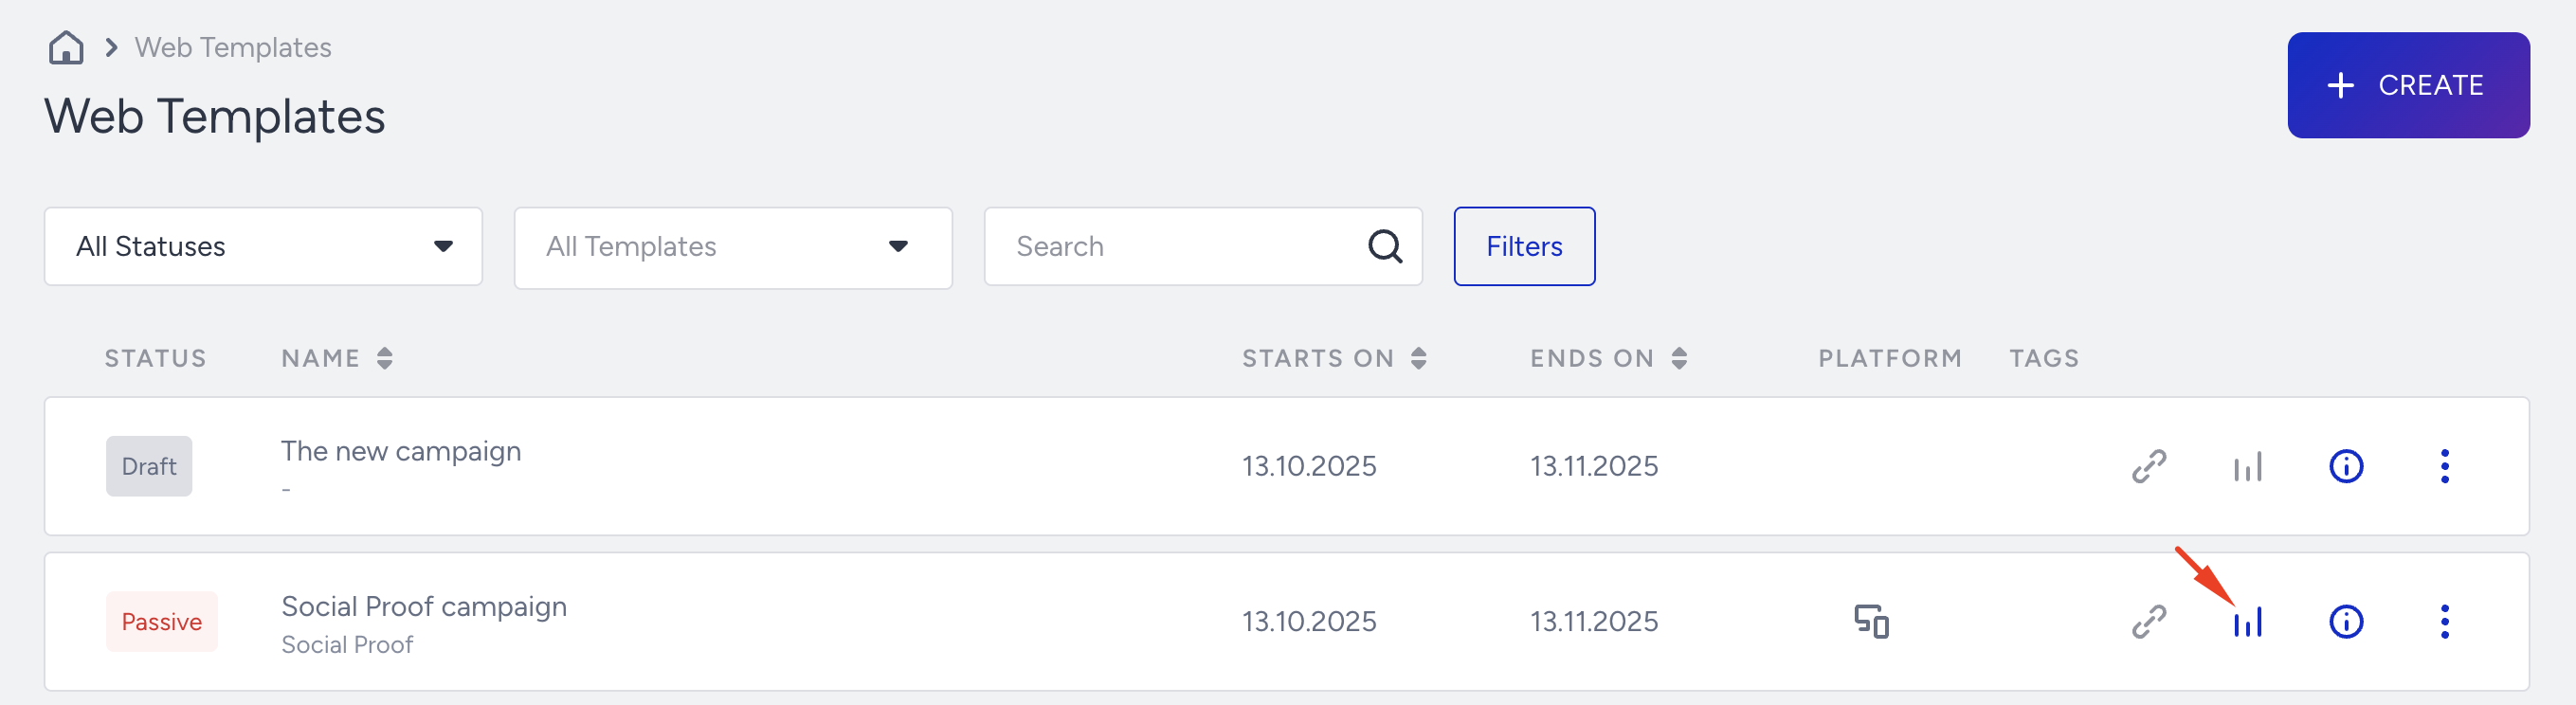
To measure campaign-level performance, click Analytics for the campaign you wish to view on the Web Templates campaign listing page.
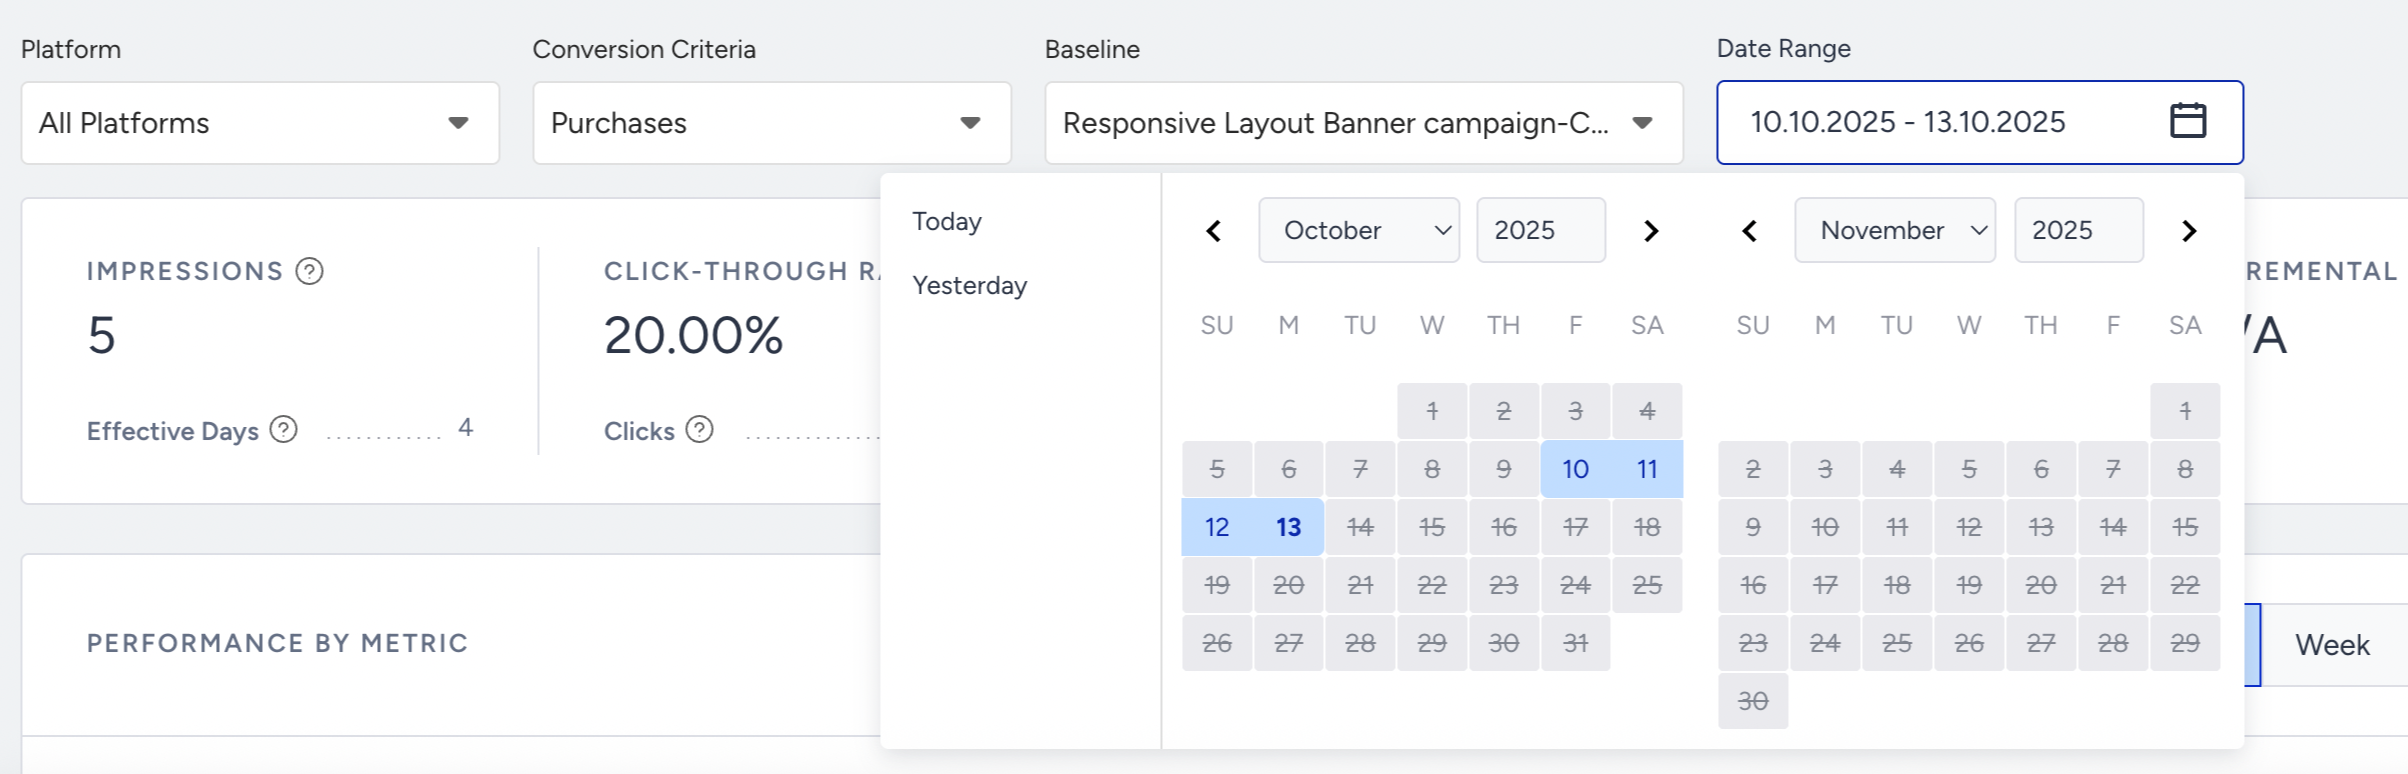
You can filter the performance metrics by selecting a time range using the date picker in the top-right corner of the page.
You can export the filtered data to an Excel file or obtain its URL to share.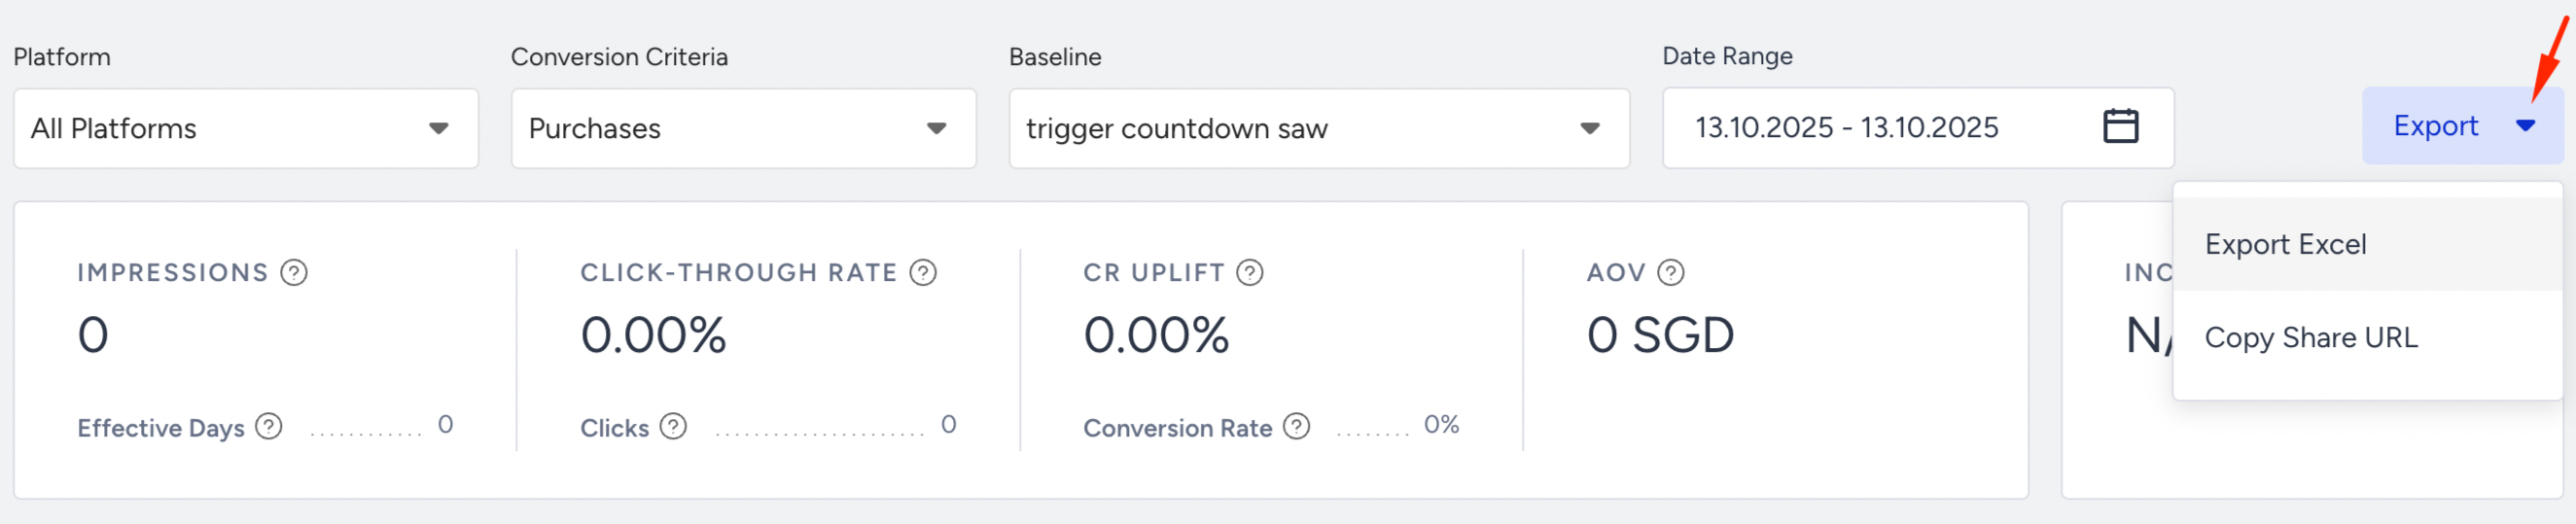
Best Performing Variant Metrics
You can view your campaign's analytics for each platform. Under the platform dropdown, select your desired platform.
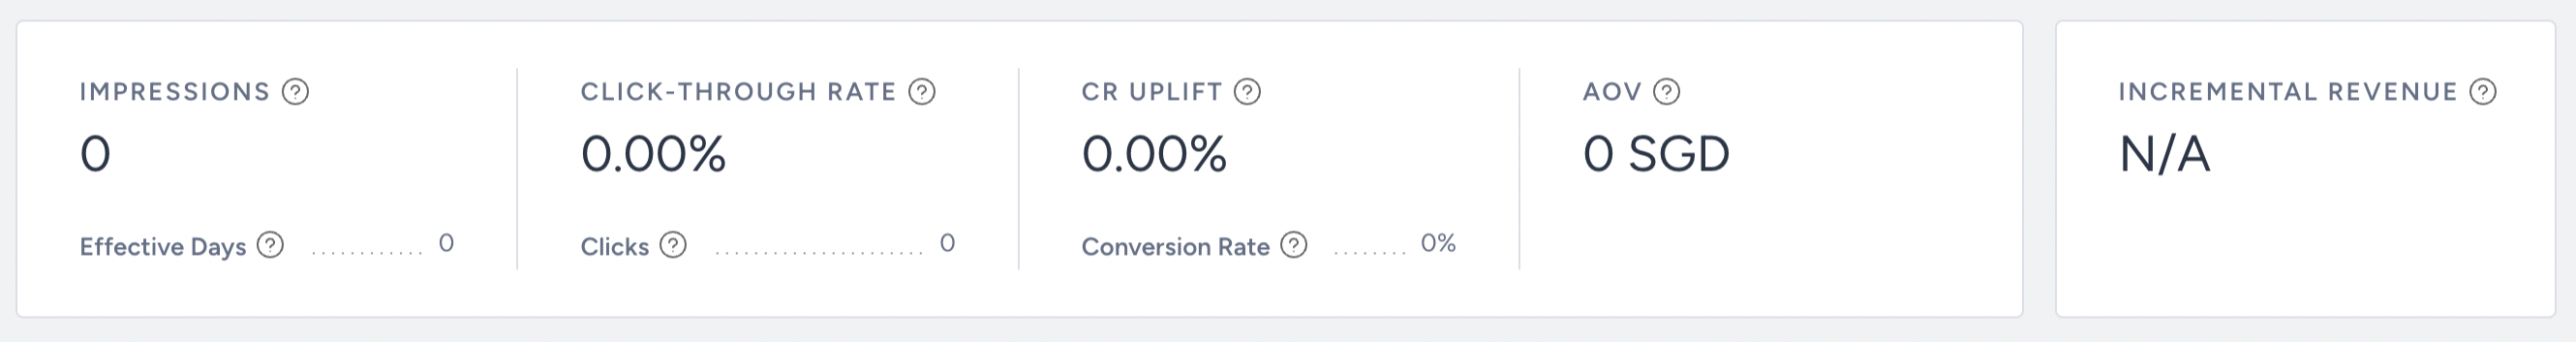
Impressions: The number of times your users viewed your variant.
Effective Days: The number of days during which at least one variant had been viewed more than 10 times.
Click-Through Rate: The percentage of Clicks to the impressions.
Clicks: The total number of times that the users clicked the links in your variants.
CR Uplift: The percentage of the conversion rate difference between the variant and the selected baseline group.
Conversion Rate: The percentage of Conversions to the impressions.
Average Order Value (AOV): The division of Revenue by the number of Conversions.
Incremental Revenue: The extra revenue your variants generated compared to the control group, considering traffic allocations. Refer to Incremental Revenue for further information.
Performance by Metric
Depending on the platform you choose, you can view your campaign's performance timeline daily, weekly, or monthly.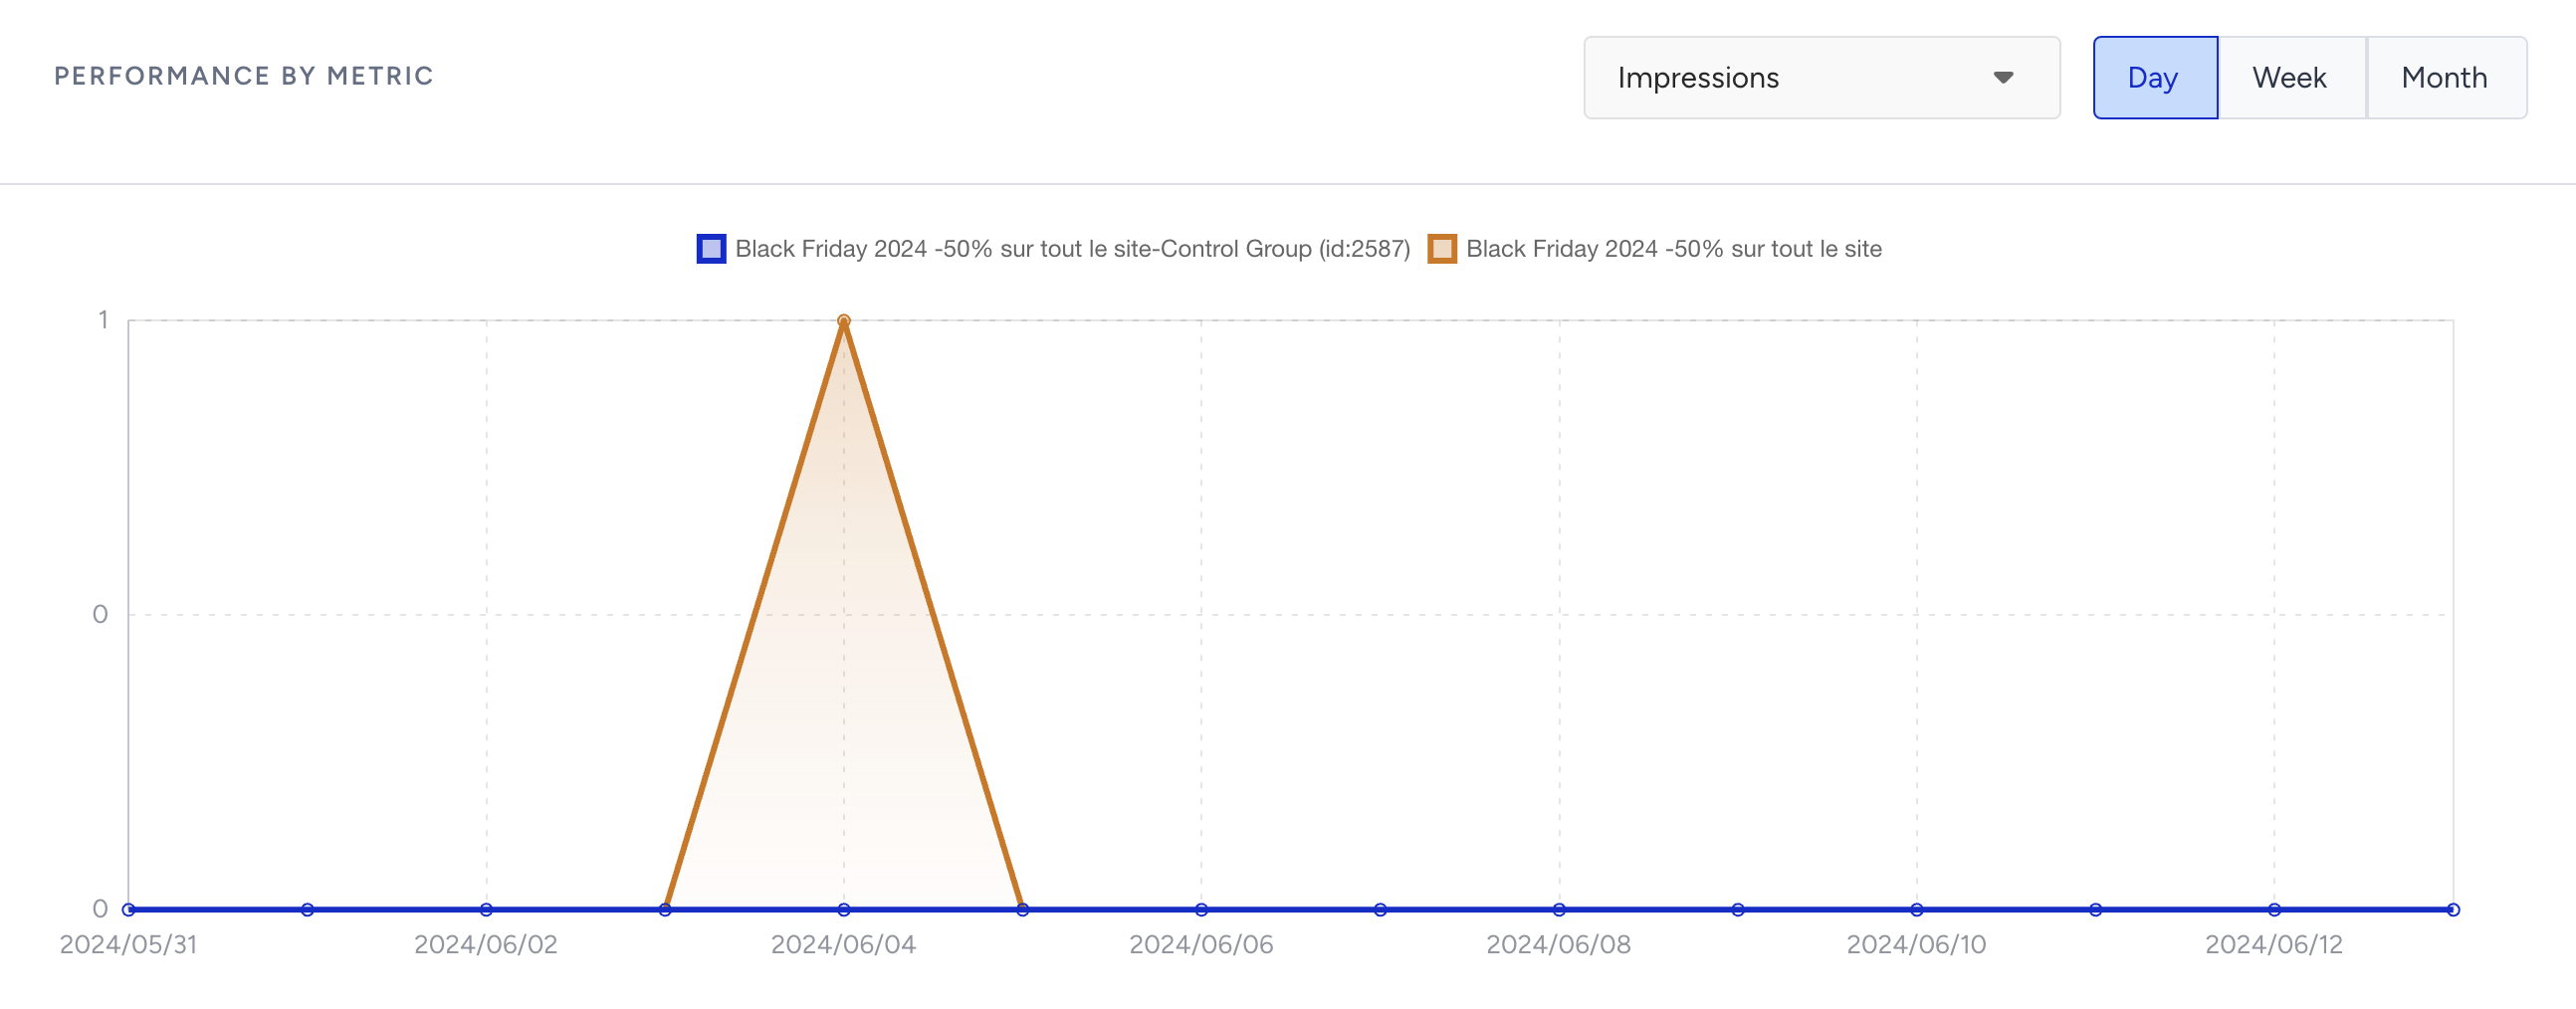
Performance by Platform
Under Performance by Platform, you can get the analytics of each variant on each platform.
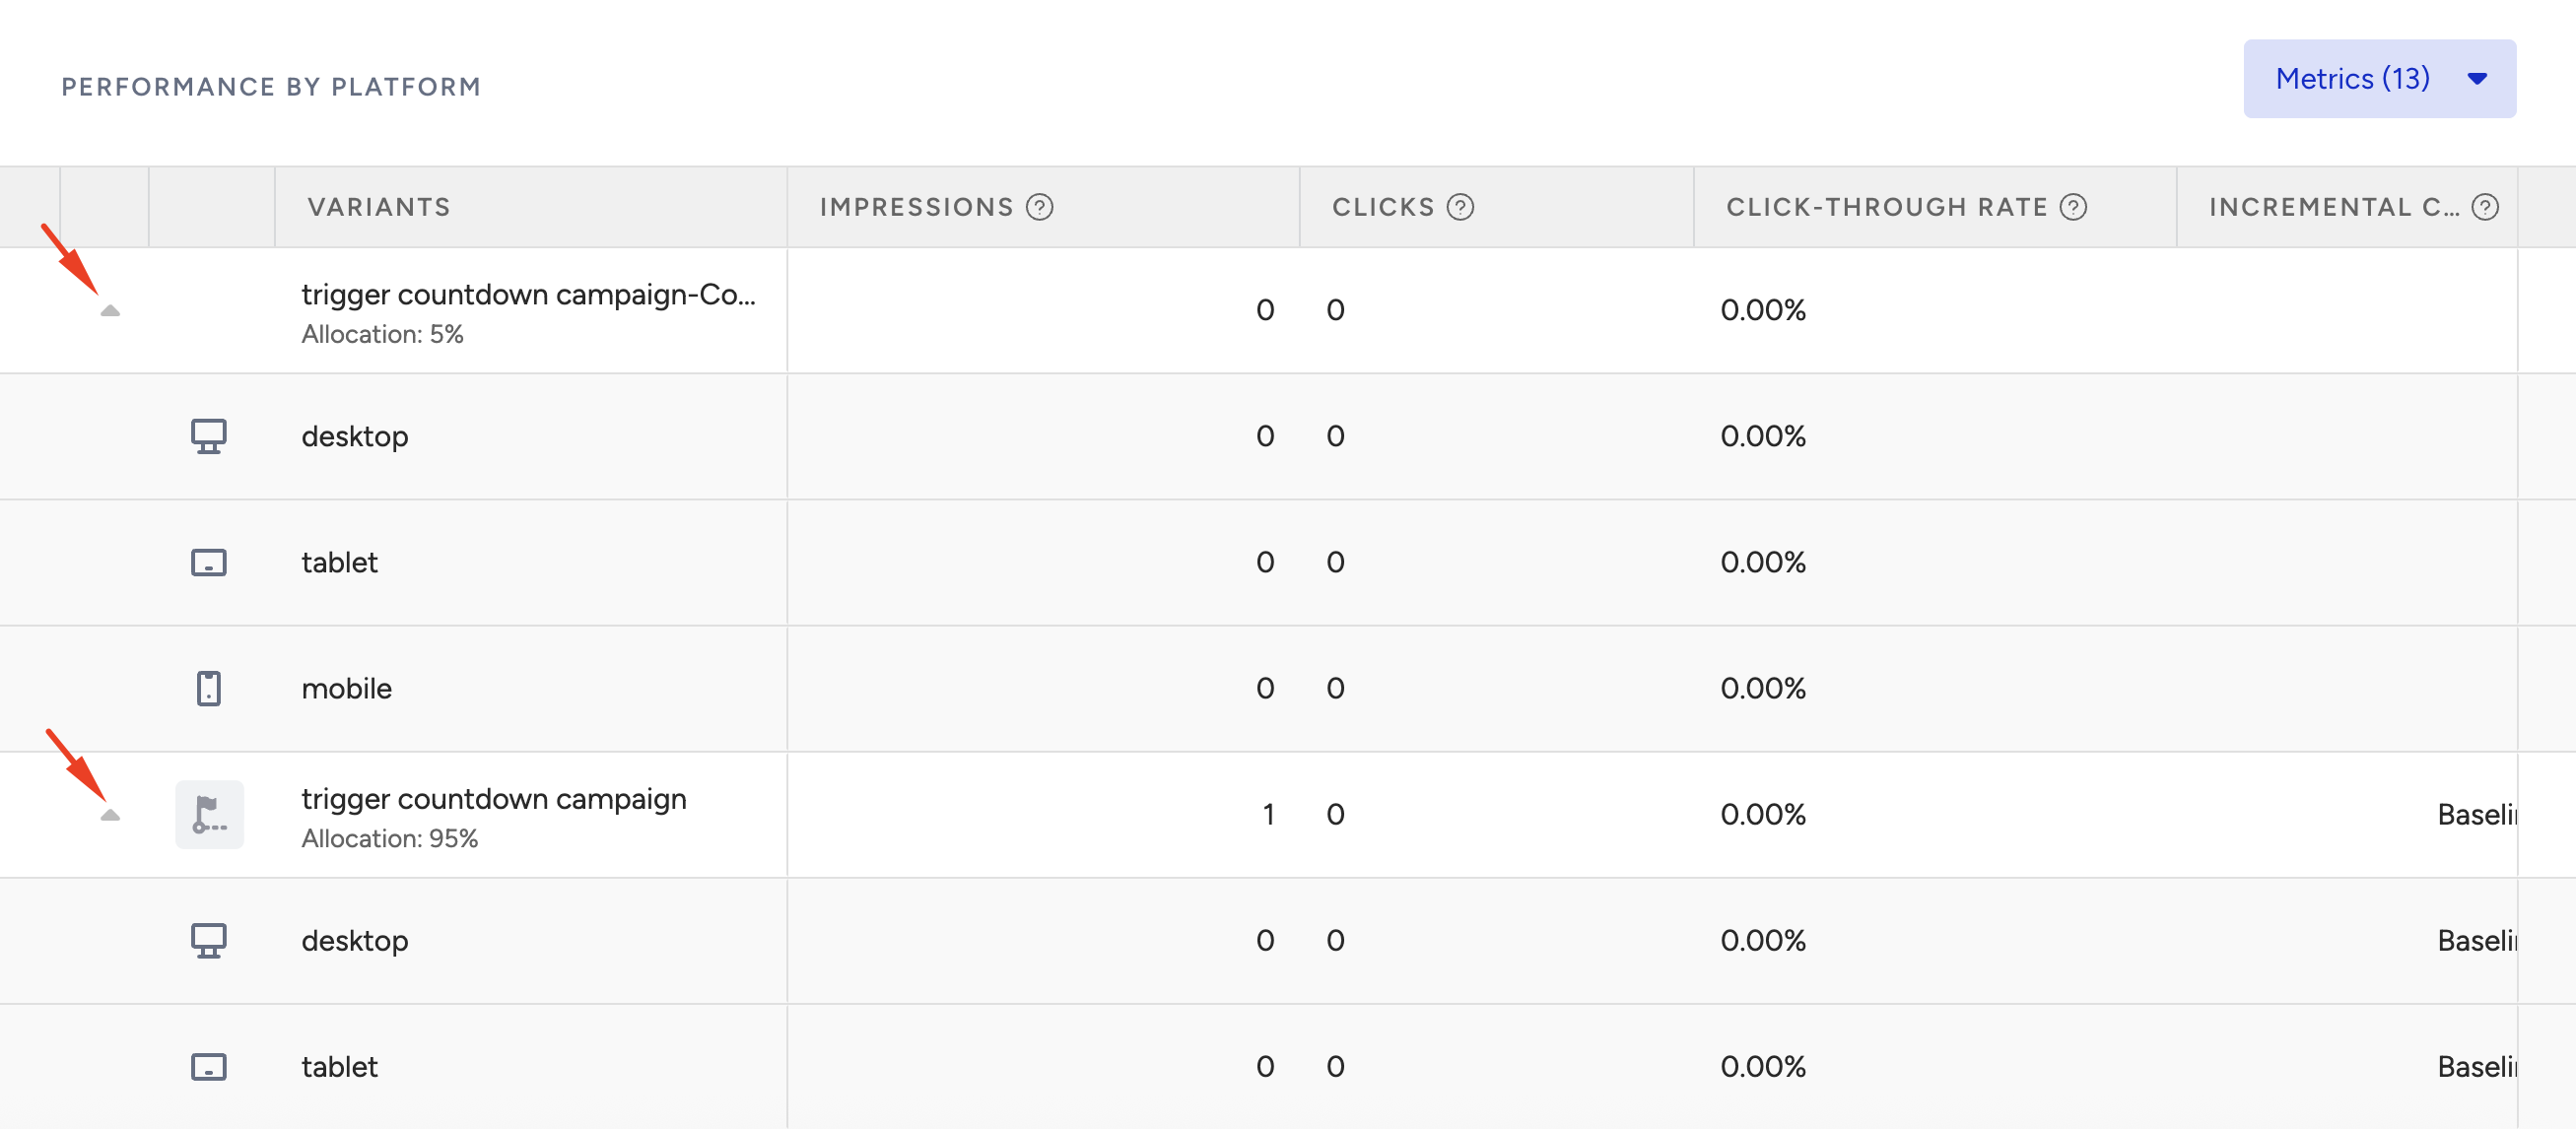
From the dropdown menu, you can select Goal Metrics for each active variant in your selected campaign to be shown in the dashboard.
Impressions: Number of unique visitors that became part of the variation.
Conversions: Number of successful primary goal occurrences.
Conversion Rate: This metric indicates the percentage of visitors who complete the goal of your variant.
Uplift: Conversion rate uplift is calculated by comparing the variation group's conversion rate to that of the control group.
Significance: A global statistical term used in A/B Testing reports. It determines whether a report is reliable enough to act on. Significance depends on the size of the experiment, meaning the number of impressions, and the difference in the performance, in other words, uplift. The score indicates whether the data is sufficient to continue or terminate the experiment. For example, if the Significance is <95%, the experiment is not significant yet.
Probability to Win: Probability to Win is the likelihood of this variant to best the other variant(s) in the test. Based on the data collected so far, this percentage is calculated using Bayesian Significance.
Incremental Revenue: The extra revenue generated by the variation is calculated by finding the difference between the variation and the control group.
Incremental Conversion: The number of additional conversions generated by a personalization group. It is calculated by comparing the variant performance to the control group performance.
Revenue: is the value of purchases made from your variant.
AOV(Average Order Value): The revenue ratio to the total number of purchases.
AOV Uplift: Average order value uplift is calculated based on the ratio of the average order value of the variation to that of the control group. The difference in average order value performance between the variation and the control group will provide this uplift.