Suggested readings: Transactional Journeys Analytics, Transactional Analytics Dashboard, Transactional SMS Channel Analytics, Transactional Journeys: Email
Email Channel Analytics in Transactional Journeys provides reporting for transactional email messages sent through a journey.
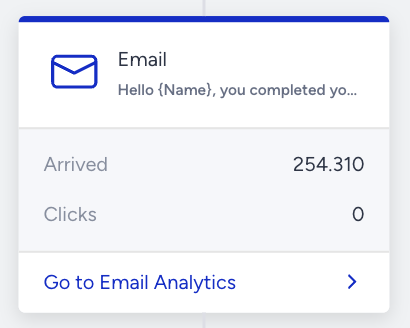
To access Email Channel Analytics, click the email element on the canvas and the Go to Email Analytics button.
The analytics page displays metrics based on the selected date range.
How are analytics reported?
Email Channel Analytics tracks metrics as users progress through the journey and interact with the email message.
Channel metrics are reported as soon as users enter the Email element, and delivery events occur.
Engagement metrics update as opens and clicks are detected.
Conversion metrics are reported only if a goal is enabled and are counted within the configured goal duration.
Metrics outside the goal duration window are not included in conversion or revenue calculations.
Email channel analytics pages
Two versions of the Email Channel Analytics page are available.
Analytics without conversion metrics
Displayed when the journey is launched without Goal Tracking.
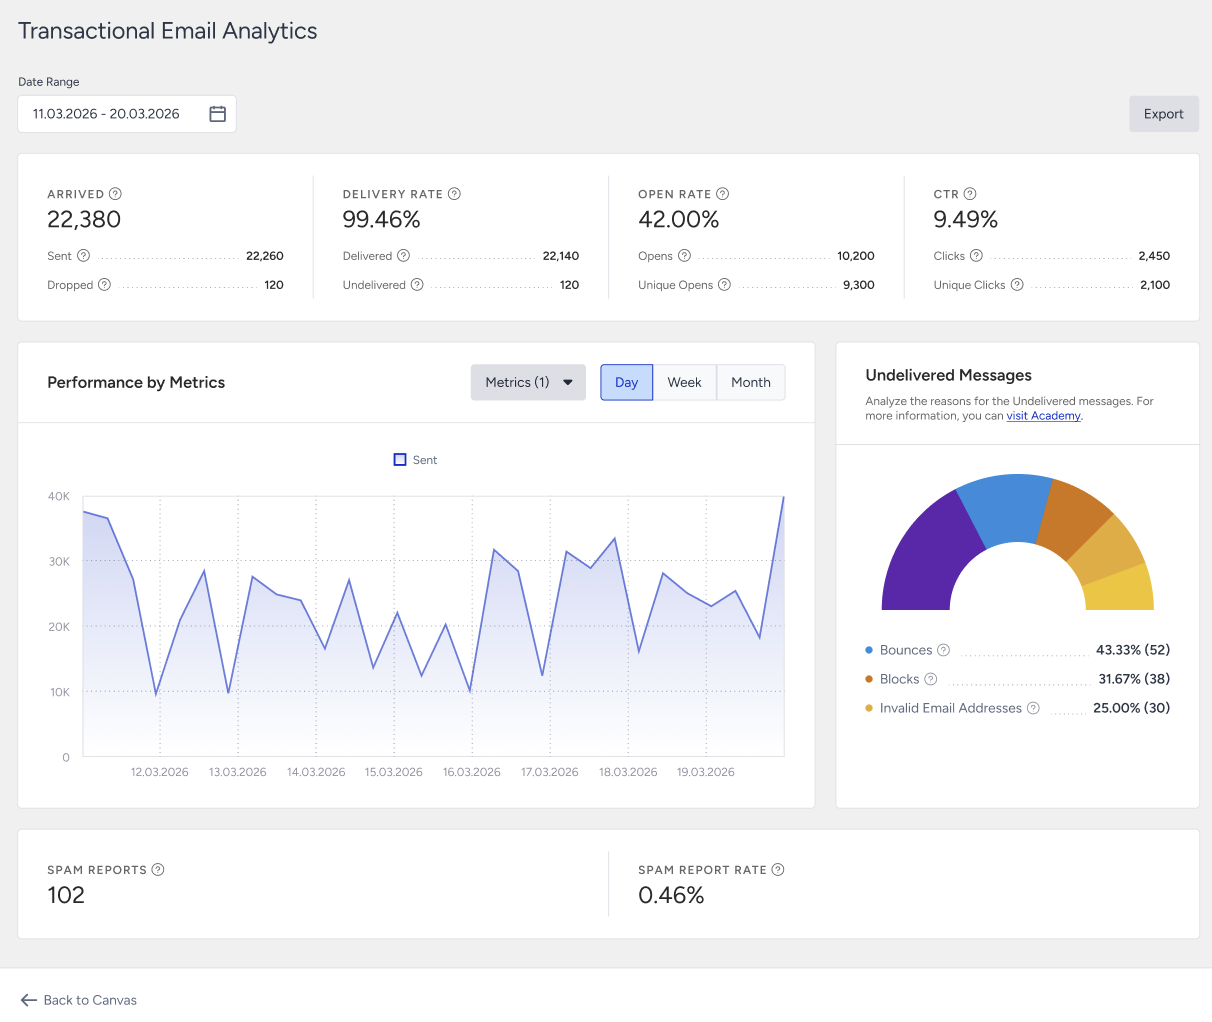
Use the date picker at the top of the page to define the reporting window. All metrics, charts, and breakdowns update based on the selected range.
The metrics below are displayed on the Analytics page:
Arrived: The number of users who arrived at this Email element in the journey. Reported immediately when users arrived at the Email element.
Sent: The number of email messages addressed to the email service providers. Reported when message sending is initiated.
Dropped: The number of email messages that were not transferred to the service provider to be addressed to recipients. Reported when a message cannot proceed to delivery.
Delivered: The number of email messages successfully transferred to the email service providers. Reported as delivery confirmations are received.
Undelivered: The number of email messages that were not addressed to recipients by the service provider. Reported after delivery attempts fail.
Delivery Rate: The percentage of delivered messages compared to sent messages. Updates as Sent and Delivered counts change.
Opens: The estimated number of email messages opened by users and Mail Privacy Protection (MPP). Tracked as open events are received.
Unique Opens: The estimated number of email messages opened for the first time by users and MPP.
Clicks: The total number of times recipients clicked any link in the email.
Unique Clicks: The number of recipients who clicked any link in the email for the first time.
Open Rate: The estimated percentage of Unique Opens (User and MPP) compared to Delivered messages. Updates as open events are detected.
Click-Through Rate (CTR): The percentage of Unique Clicks compared to Delivered messages.
Click-to-Open Rate (CTOR): The percentage of Unique Clicks compared to Unique Opens.
Spam Reports: The number of recipients who marked the email as spam.
Spam Report Rate: The percentage of spam reports relative to delivered messages.
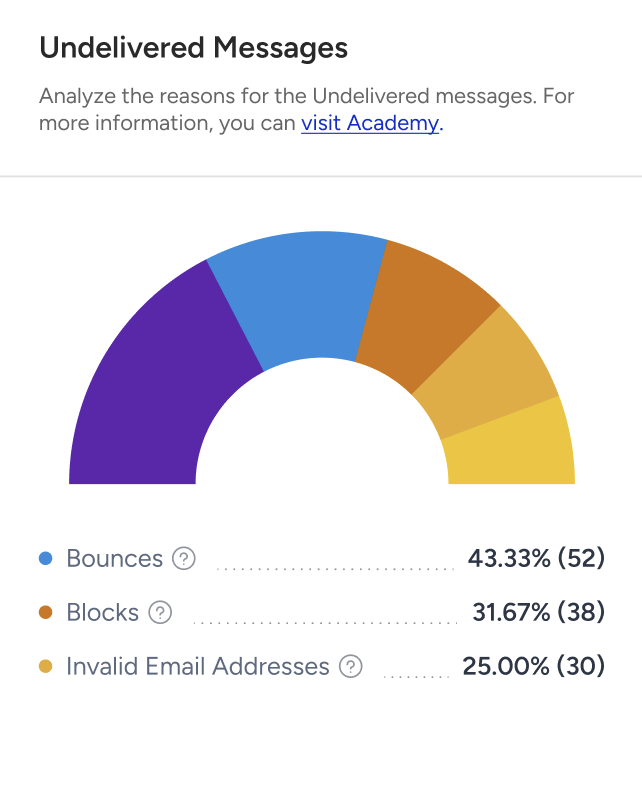
Undelivered Messages Breakdown:
Bounces: Emails rejected because the recipient address is invalid or does not exist.
Blocks: Emails rejected by the recipient server due to content, IP reputation, inbox limits, or filtering rules.
Invalid Email Addresses: Emails sent to addresses that are not valid.
Analytics with conversion metrics
Displayed when the journey is launched with Goal Tracking.
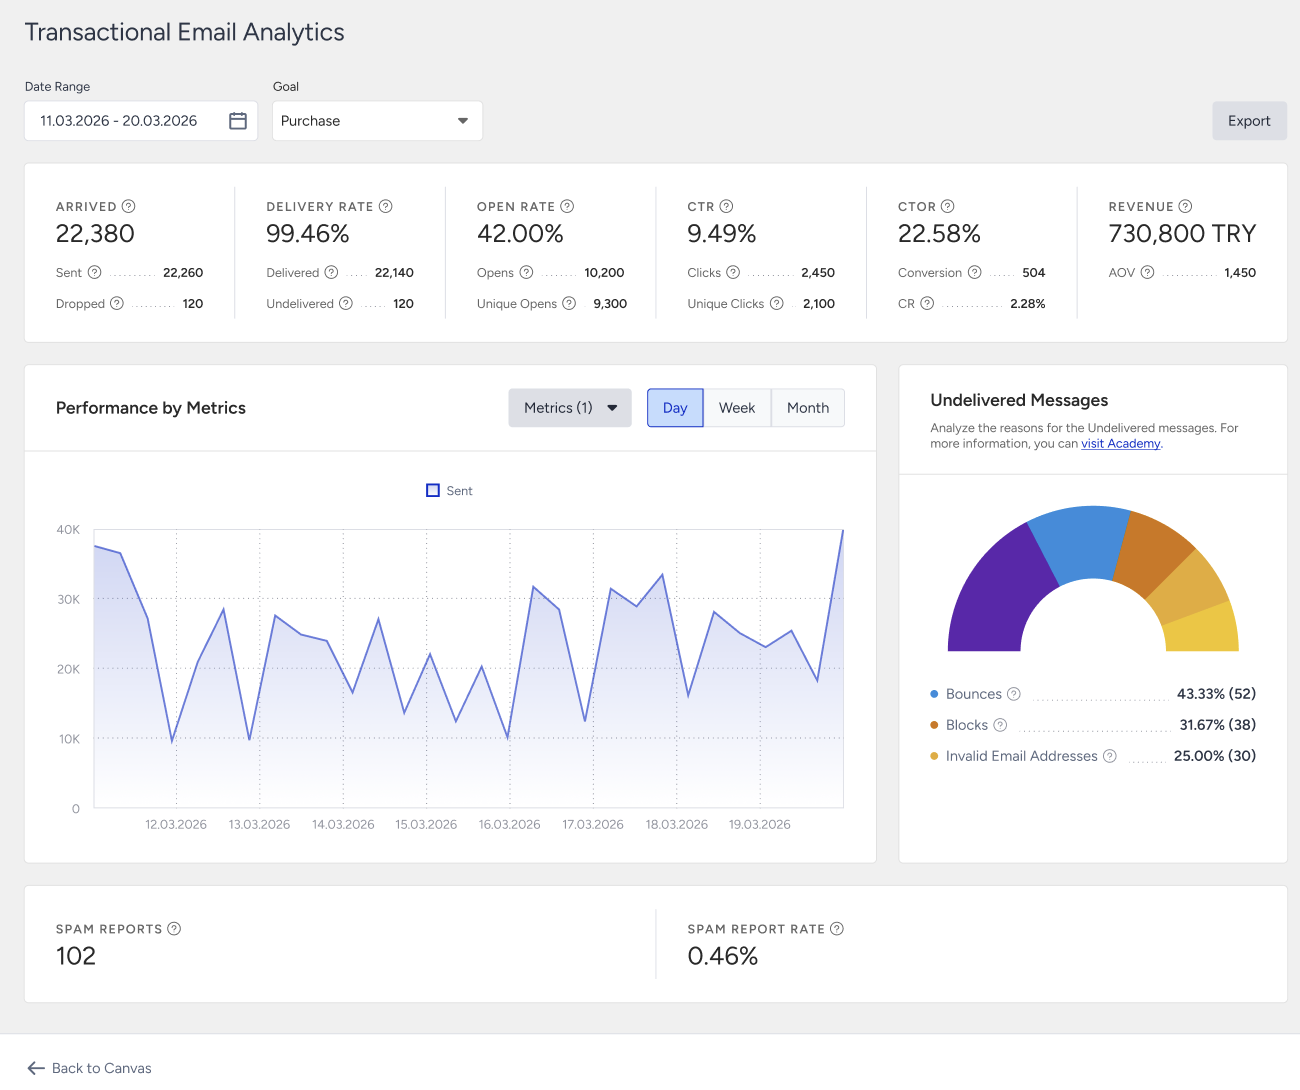
The metrics below are displayed on the analytics page on top of the channel metrics listed above:
Conversion: The number of successful goal accomplishments attributed to the email message within the goal duration.
Conversion Rate: The percentage of conversions compared to delivered messages.
Revenue: The total value of purchases completed within the goal duration and attributed to the email message.
Average Order Value (AOV): The division of revenue by the number of purchases made after clicking the email message.
Export
Use the date picker at the top of the page to define the reporting window. Click the Export button to download the analytics data.
The export includes only the selected date range and visible metrics. The file is returned in XLSX format. The exported data matches what is displayed on the analytics page.