Suggested readings: Transactional Journey Analytics, Transactional Email Channel Analytics, Transactional SMS Channel Analytics
The Overall Analytics provides a consolidated view of the performance of all transactional journeys. It allows you to monitor delivery, engagement, and conversion metrics across journeys within a selected time range.
You can access Overall Analytics from the Analytics tab on the Journey Listing Page.
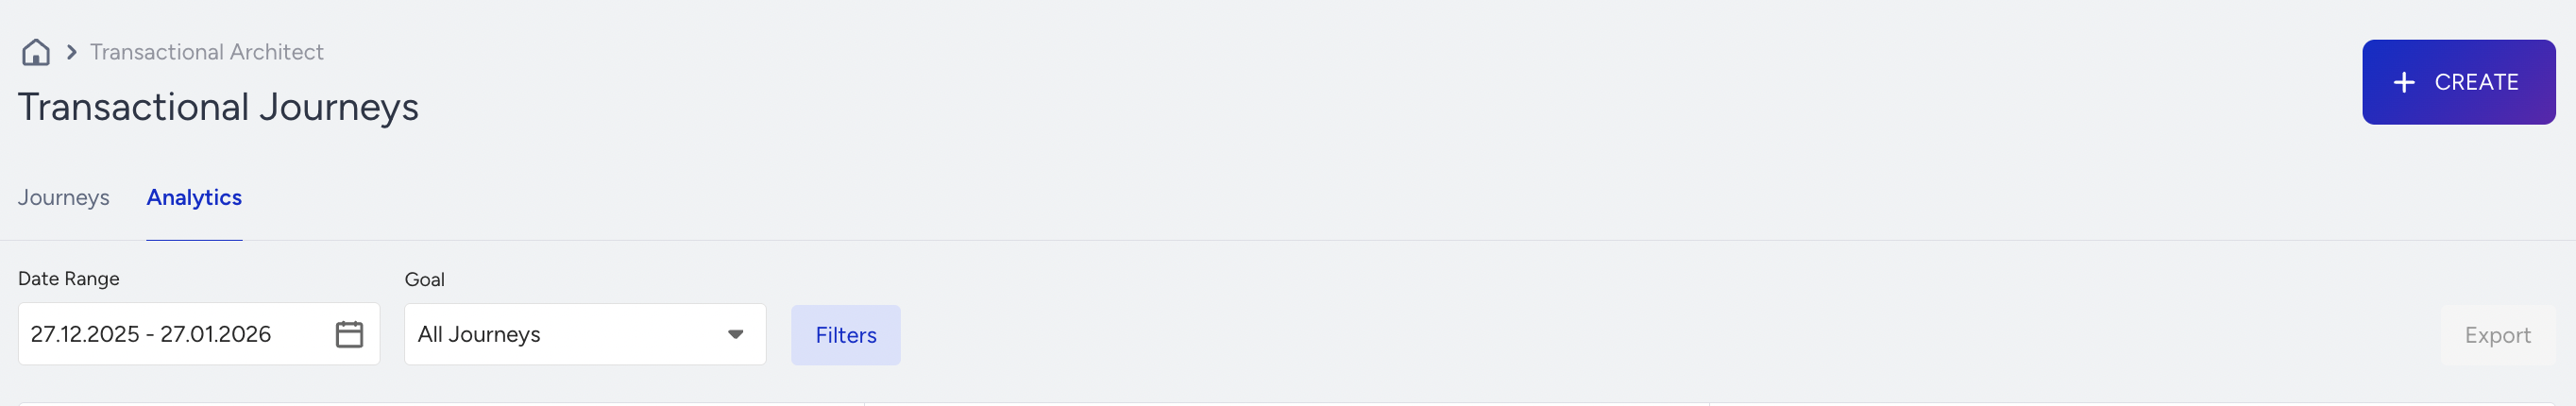
Time range and filters
At the top of the page, you can select a time range to analyze journey performance.
You can select any time range up to 1 year. The selected period does not need to include the current date. All metrics, charts, and tables update based on the selected range.
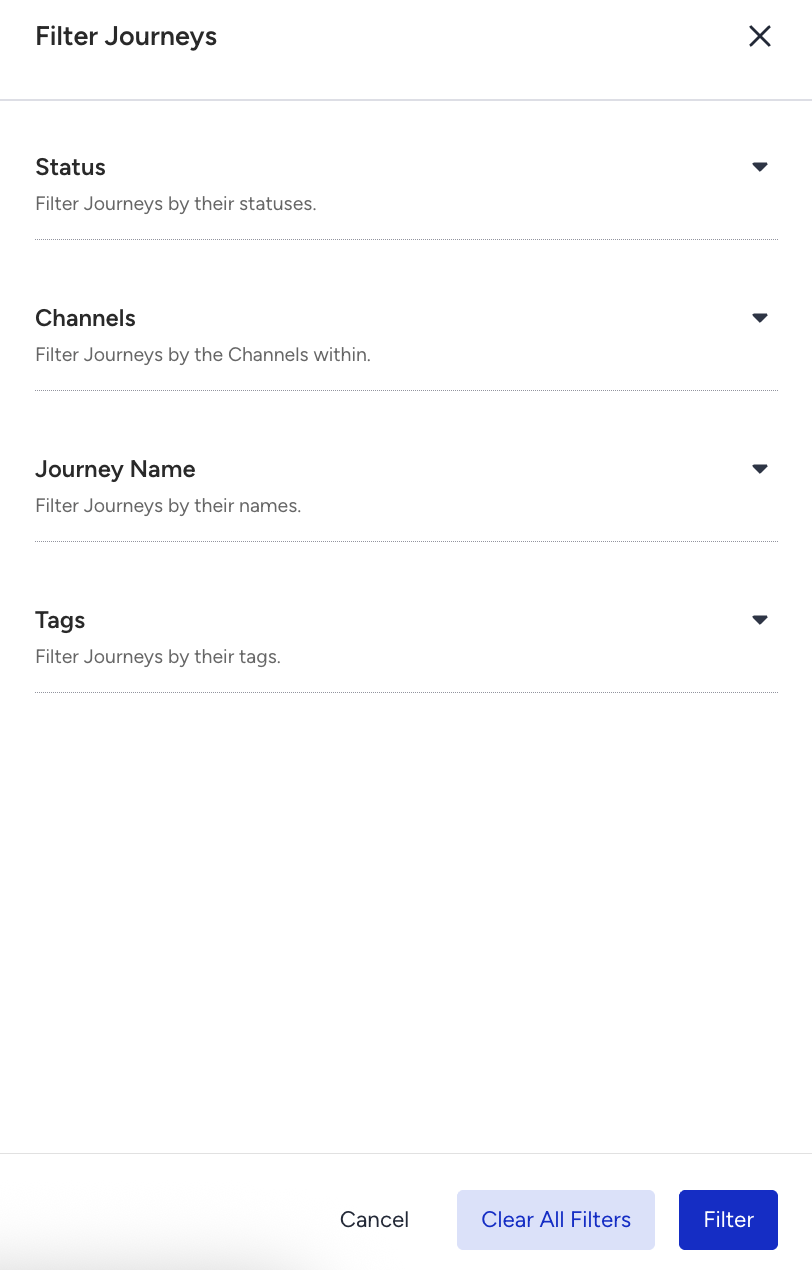
You can also filter analytics by:
Journey status
Journey name
Journey tags
Channels used in journeys
By default, Overall Analytics shows only Active journeys. You can use the filters to include the other statuses.
Conversion Tracking Availability
In Transactional Journeys, conversion tracking is disabled by default for journeys.
Conversion metrics appear in Overall Analytics only for journeys where:
The goal tracking is enabled during Launch.
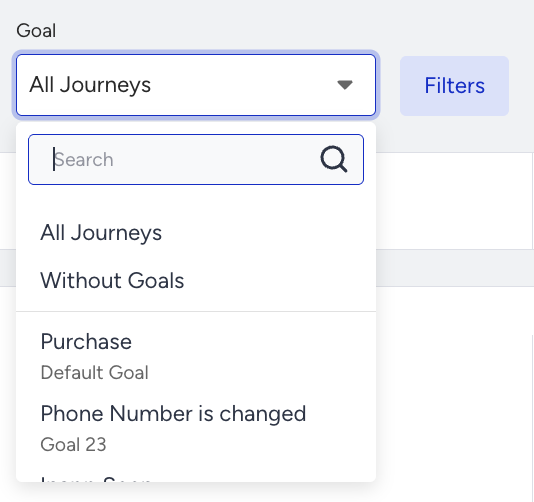
A conversion goal is defined or defaulted.
If Goal Tracking is enabled and no specific goal is selected, Purchase is tracked as the default conversion goal.
Journeys without goal tracking enabled:
Do not contribute to conversion, revenue, or AOV metrics.
Are excluded from conversion-based aggregations.
Number Of Journeys
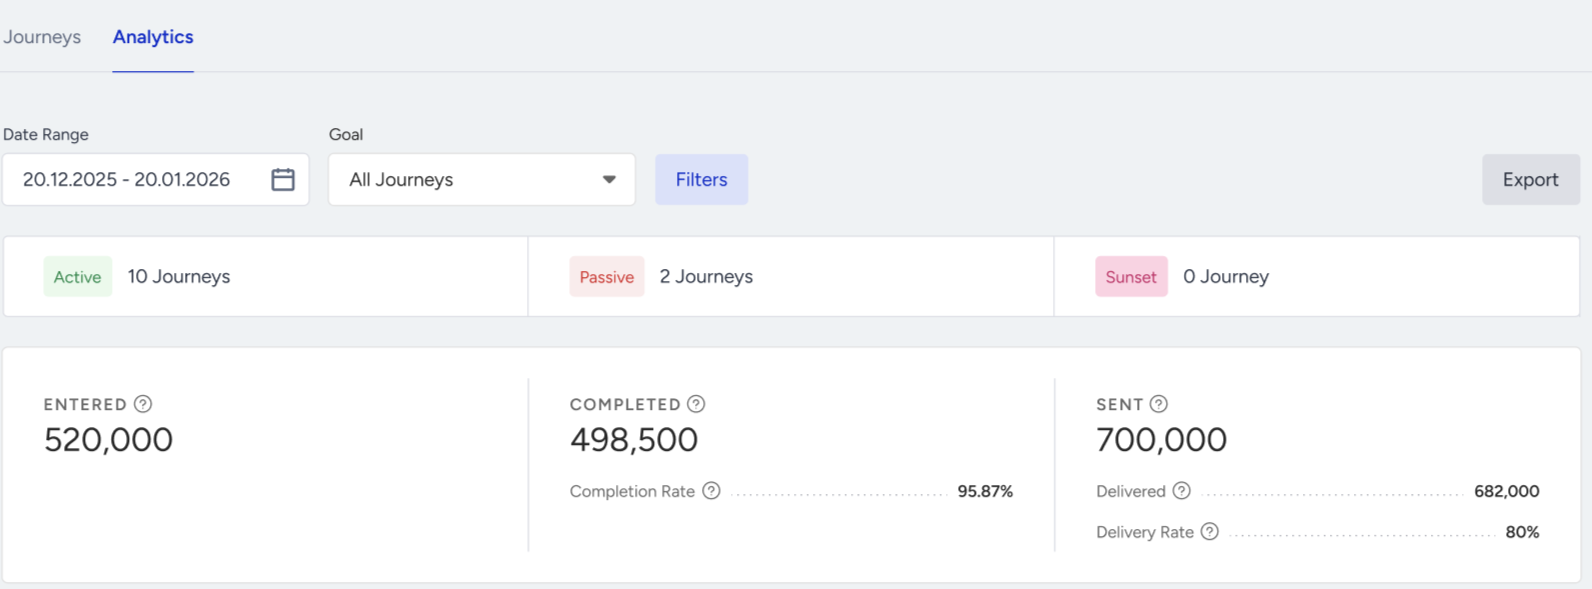
This section shows the number of journeys grouped by status.
It provides a high-level view of the number of journeys in Active, Draft, and Passive statuses. The counts update based on the selected filters.

Live Stats
Live Stats display aggregated user-level journey metrics across all included journeys.
The following metrics are shown:
Entered: Total number of users who entered journeys.
Dropped: Total number of users dismissed due to channel reachability issues.
Drop Rate: Percentage of dropped users compared to entered users.
Completed: Total number of users who completed journeys.
Complete Rate: Percentage of completed users compared to entered users.
Exited: Total number of users who exited journeys due to exit criteria.
Sent: Total number of messages addressed across all journeys and channels.
Delivered: Total number of messages successfully delivered.
Delivery Rate: Percentage of delivered messages compared to sent messages.
A timeline below this section shows daily, weekly, or monthly trends for these metrics.
Performance Analytics
This section provides aggregated engagement and conversion metrics across all included journeys.
Displayed metrics include the following ones:
Total Clicks: Total number of clicks across all channels.
Click Rate: Clicks divided by delivered messages.
Total Conversions: Number of completed conversion goals. It is displayed only for journeys with Goal Tracking enabled.
Conversion Rate: Conversions divided by delivered messages.
Total Revenue: Revenue attributed to conversion events.
Average Order Value (AOV): Revenue divided by number of purchases.
Trend indicators show increases or decreases compared to the previous equivalent time range.
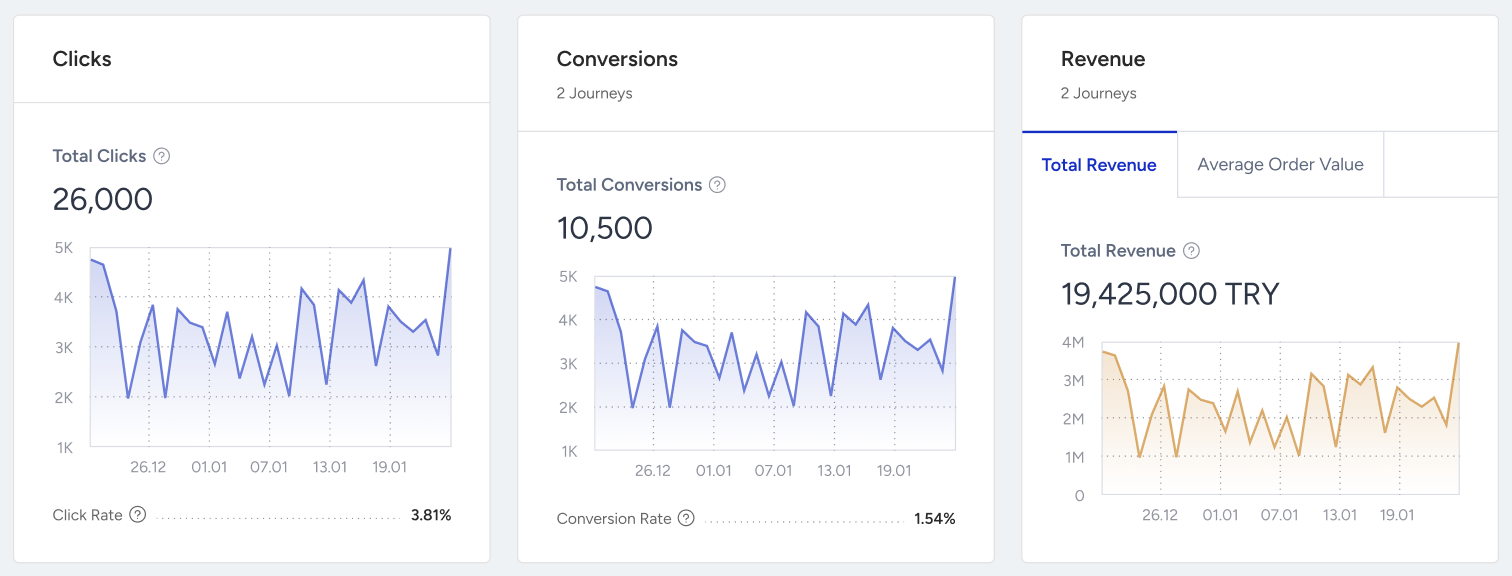
You can use the Goal dropdown to switch between conversion goals. Transactional Journeys work with only Click-Through Conversion.
Requests Breakdown
The Requests Breakdown section provides visibility into the health of API requests that trigger transactional journeys across the selected scope.
This section helps you analyze whether journeys are being triggered successfully and identify request-level issues that may prevent users from entering journeys.
Requests Breakdown reflects API execution health, not message delivery performance.
Requests Breakdown Chart
The chart shows the volume of API requests over time for all journeys included in the current filters.
Available metrics include:
All Requests: The total number of API requests sent to trigger transactional journeys.
Successful Requests: The number of API requests that were successfully validated and accepted.
Failed Requests: The number of API requests that failed validation or processing and did not trigger any journey entry.
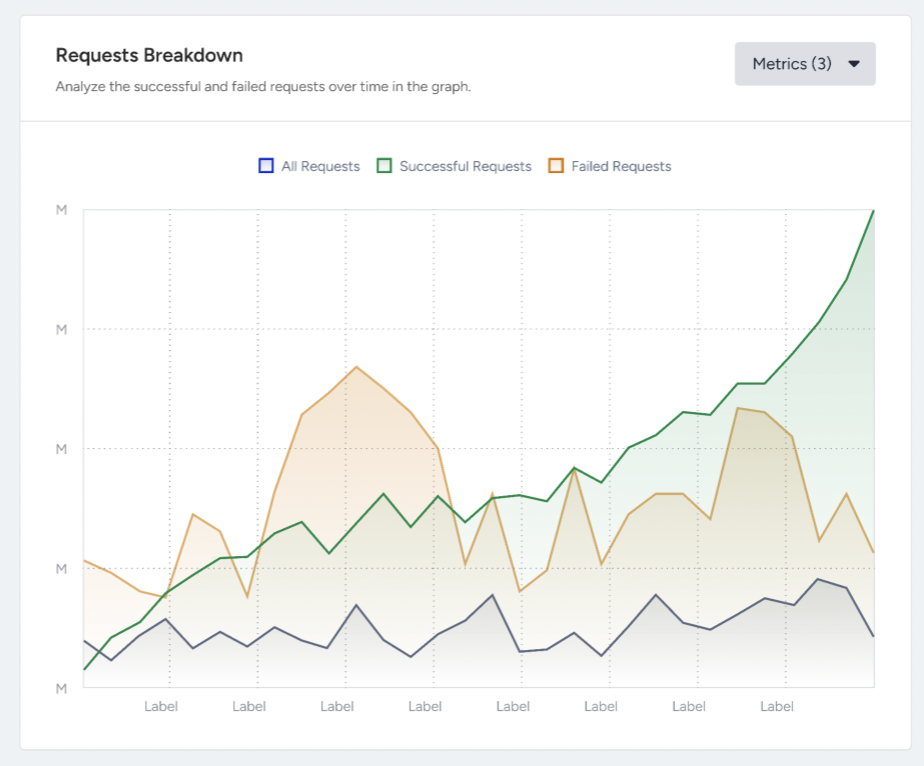
You can use the Metrics selector to enable or disable each metric to focus on specific request outcomes. The chart supports daily, weekly, and monthly granularity based on the selected time range.
Failed Requests Table
The Failed Requests table provides a breakdown of failed API requests by failure reason.
For each failure type, the table shows:
Description: A human-readable explanation of the failure reason.
Request Count: The total number of failed API requests with this failure reason.
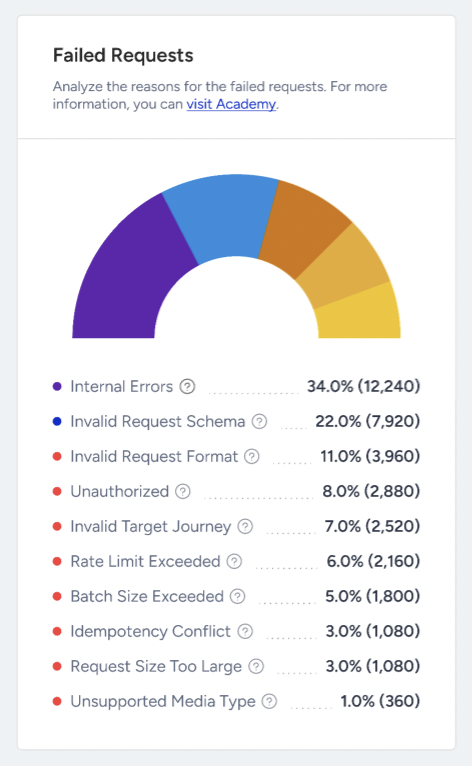
Common failure types
Below are some examples of failure reasons:
Invalid API Key: Requests rejected due to missing or invalid authentication credentials.
Request Size Too Large: Requests exceeding the allowed payload size.
Encryption Failure: Requests that could not be decrypted or validated securely.
Internal Errors: Represents requests that failed due to unexpected system-level issues during processing.
Internal errors occur after the request is received and validated.
They are not caused by payload structure or authentication.
They do not result in journey entry or message sending.
Invalid Request Schema: The request payload does not match the expected schema for the journey. It might be due to:
Missing required fields
Incorrect data types
Mismatched dynamic attribute structures
Invalid nesting depth in dynamic content
Invalid Request Format: Occurs when the request body cannot be parsed correctly. It might be due to:
Malformed JSON
Invalid content structure
Corrupted request body
Unauthorized: Failures occur when the request cannot be authenticated due to:
Missing authentication headers
Invalid or expired API keys
Incorrect partner credentials
Invalid Target Journey: Indicates that the request references a journey that:
Does not exist.
Is not Active.
Is not accessible by the authenticated partner.
Rate Limit Exceeded: Indicates that the request exceeded allowed rate limits.
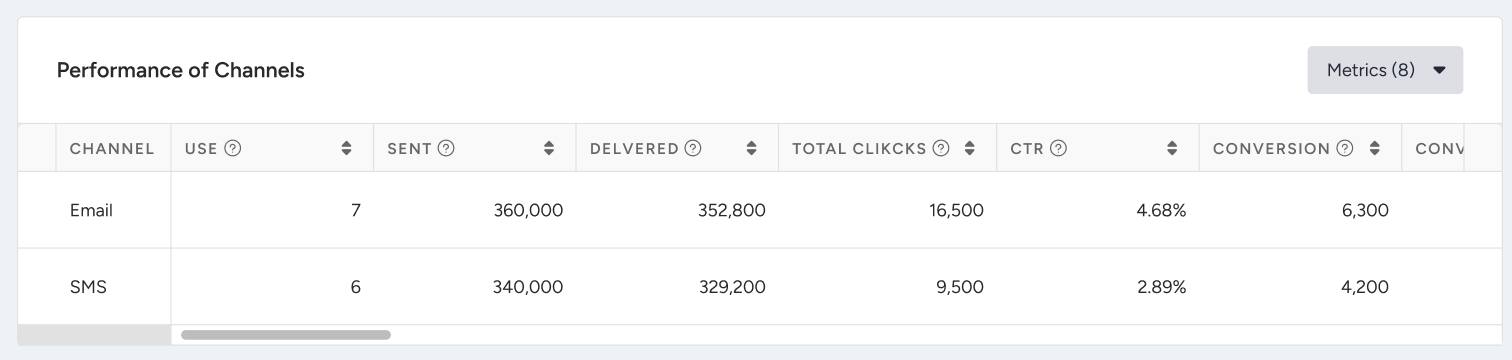
Performance Of Channels
This section evaluates channel performance across all journeys.
Metrics are aggregated per channel type and include the following:
Use: The number of times that a channel type is utilized in all journeys.
Sent: The number of messages addressed to the users via a channel in all journeys.
Delivered: The number of messages delivered to the users via a channel in all journeys. Impressions are counted as Delivered for the On-Site and In-App channels.
Delivery Rate: The percentage of the Delivered to the Sent messages.
SMS Message Parts: The number of SMS message parts allocated for sending all the content in SMS messages.
Total Opens: The total number of times that the users opened the Email or WhatsApp messages in all journeys.
Unique Opens: The unique number of times that the users opened the Email or WhatsApp messages in all journeys.
Open Rate: The percentage of users who opened the Email and WhatsApp messages in all journeys.
Total Clicks: The number of times that the users clicked the messages via a channel in all journeys.
Unique Clicks: The unique number of times that the users clicked the Email(s) in all journeys.
Click-Through Rate: The percentage of times that the users clicked the messages to the delivered messages via a channel in all journeys.
Conversions: The number of successful goal accomplishments via a channel in all journeys.
Conversion Rate: The percentage of successful goal accomplishments to the delivered messages via a channel in all journeys.
Revenue: The value of purchases made via the channel in all journeys.
Average Order Value: The division of Revenue by the number of Conversions made via a channel in all journeys.
You can:
Select which channels to compare.
Choose the metric to visualize.
Switch between daily, weekly, and monthly views.
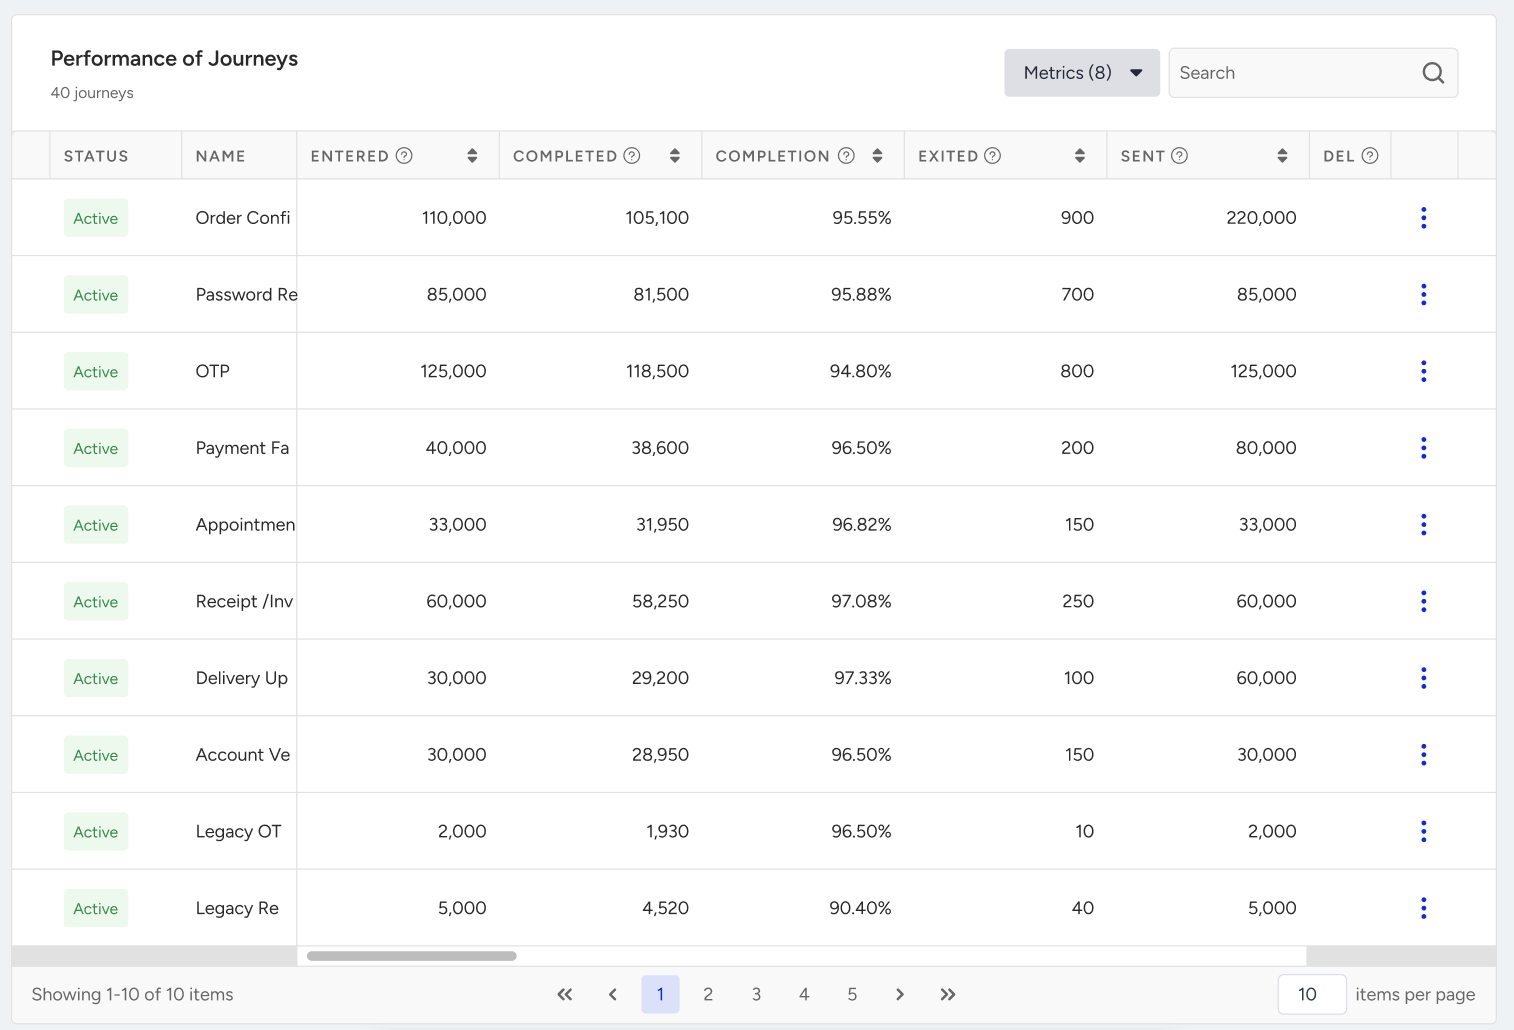
Performance Of Journeys
This table lists all journeys included in the selected filters and shows their performance side-by-side.
Available columns include the following:
Status: Indicates the current status of the journey.
Name: Shows the journey name.
Entered: The number of users who entered the journey.
Completed: The number of users who completed the journey.
Completion Rate: The percentage of users who completed the journey to the users who entered the journey.
Sent: The number of messages addressed to the users via all channels in the journey.
Delivered: The number of messages delivered to the users via all channels in the journey. Impressions are counted as Delivered for the On-Site and In-App channels.
Delivery Rate: The percentage of the Delivered to the Sent messages.
SMS Message Parts: The number of SMS message parts allocated for sending all the content in SMS messages.
Total Opens: The total number of times users opened the Emails or WhatsApp messages in the journey.
Unique Opens: The unique number of times that the users opened the Emails or WhatsApp messages in the journey.
Open Rate: The percentage of users who opened the Email or WhatsApp messages in the journey. When calculating the open rate, unique opens are considered for Email, while total opens are considered for WhatsApp.
Total Clicks: The number of times that the users clicked the messages via all channels in the journey.
Unique Clicks: The number of times that the users clicked the Emails in the journey.
Click-Through Rate: The percentage of times that the users clicked the messages to the delivered messages via all channels in the journey.
Conversions: The number of successful goal accomplishments via all channels in the journey.
Conversion Rate: The percentage of the successful goal accomplishments to the delivered messages via all channels in the journey.
Revenue: The value of purchases made via all channels in the journey.
Average Order Value: The division of Revenue by the number of Conversions made via all channels in the journey.
You can:
Sort by any column.
Add or remove visible metrics.
Search journeys by name.
Navigate directly to Journey Analytics or Canvas.
Export
Click the Export button to export the Overall Analytics.
The export reflects the selected filters and time range and includes multiple tabs, such as consolidated metrics, per-journey metrics, goal metrics, and formulas. It is downloaded in XLSX format and matches what is displayed on the dashboard.