Once you successfully create and launch your app survey campaign, you can track its performance on the Analytics page.
On this dashboard, you can perform the following actions:
- Filtering
- Date range selection
- See reports
- Select metrics
- View performance by metrics
- View variants metrics
Click the See Analytics button against the campaign that you want to analyze.
The Results page helps you filter results and export reports.
Filtering
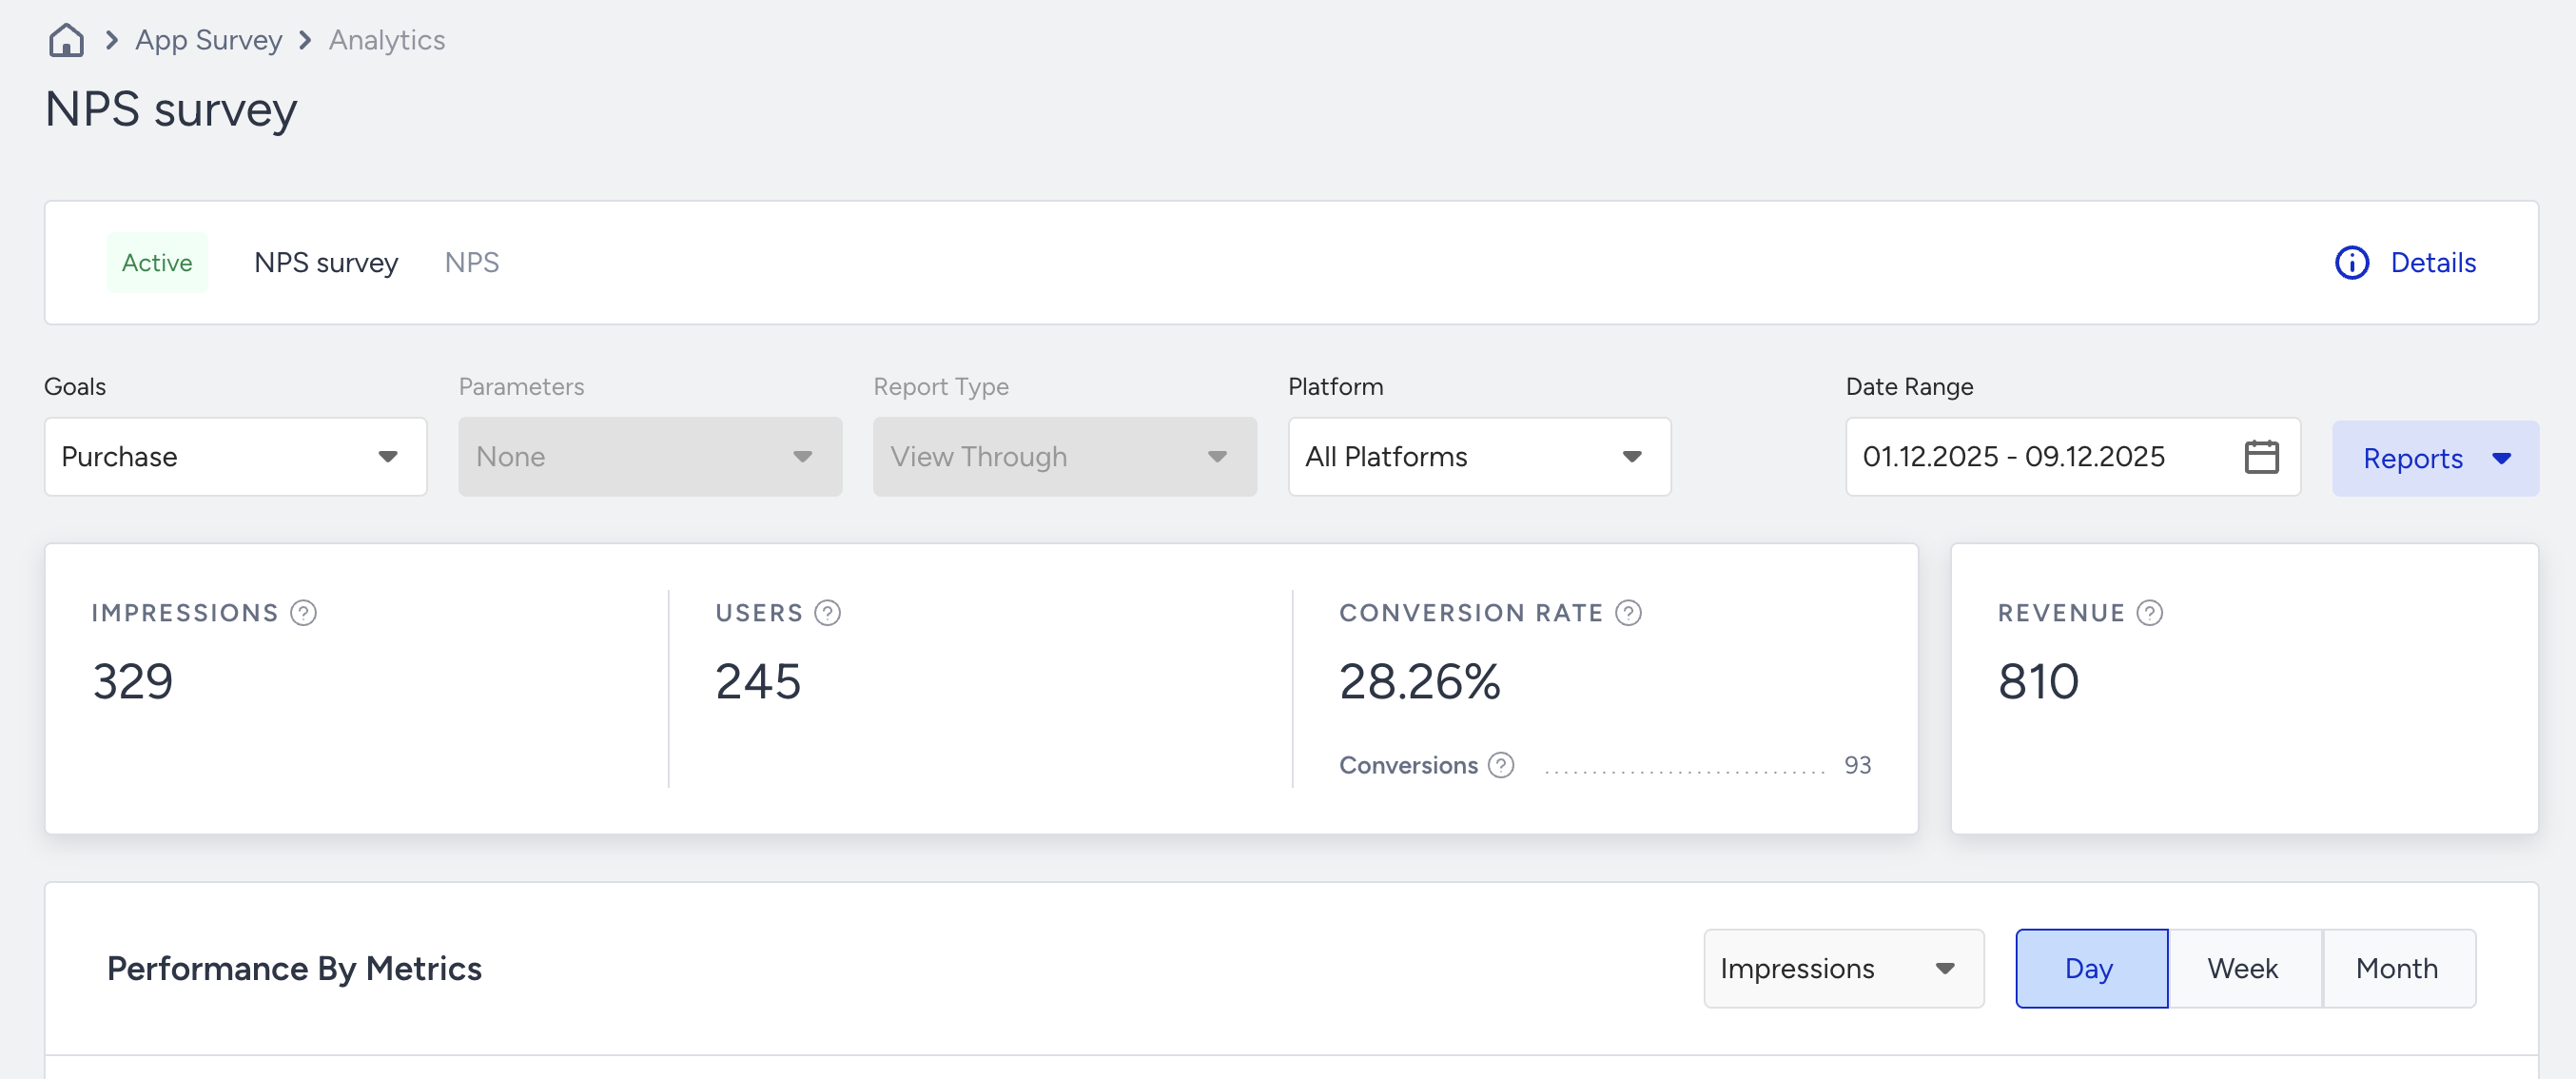
You can filter the results based on goals, parameters, report type, and platforms (all platforms, Android, iOS).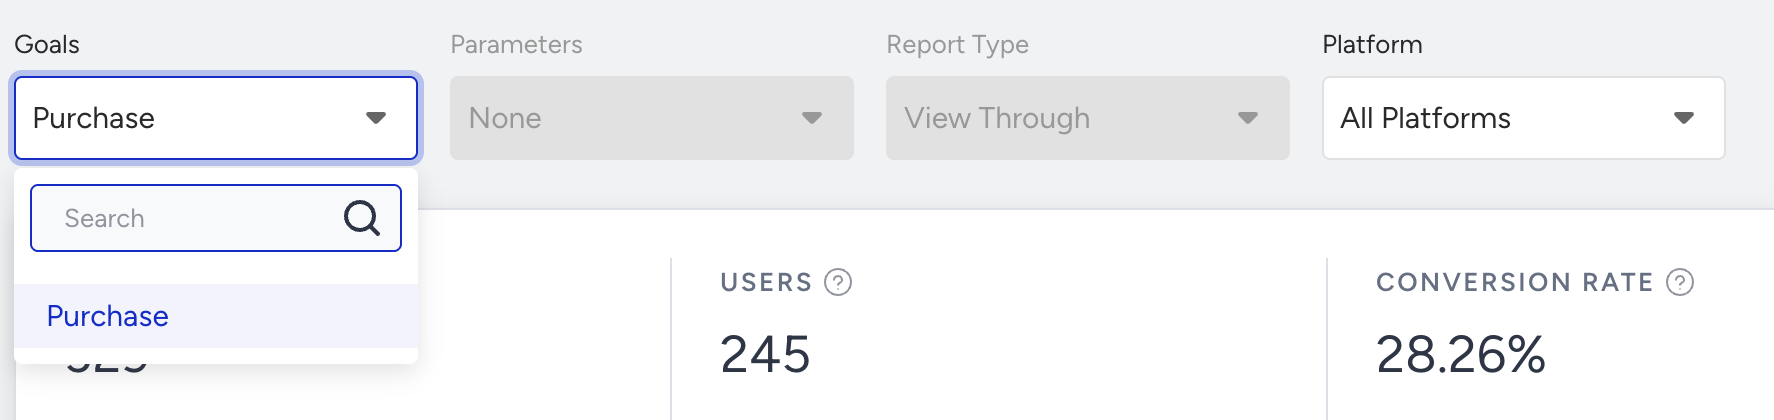
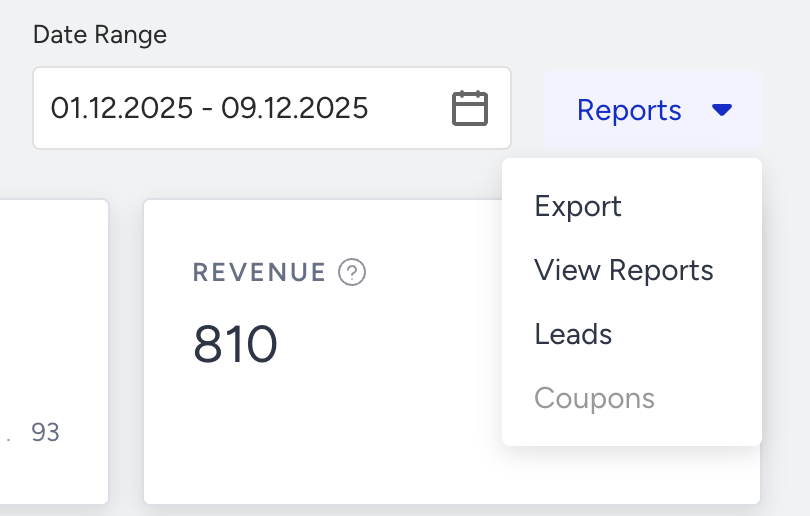
Date Range
You can view your results based on specific date ranges.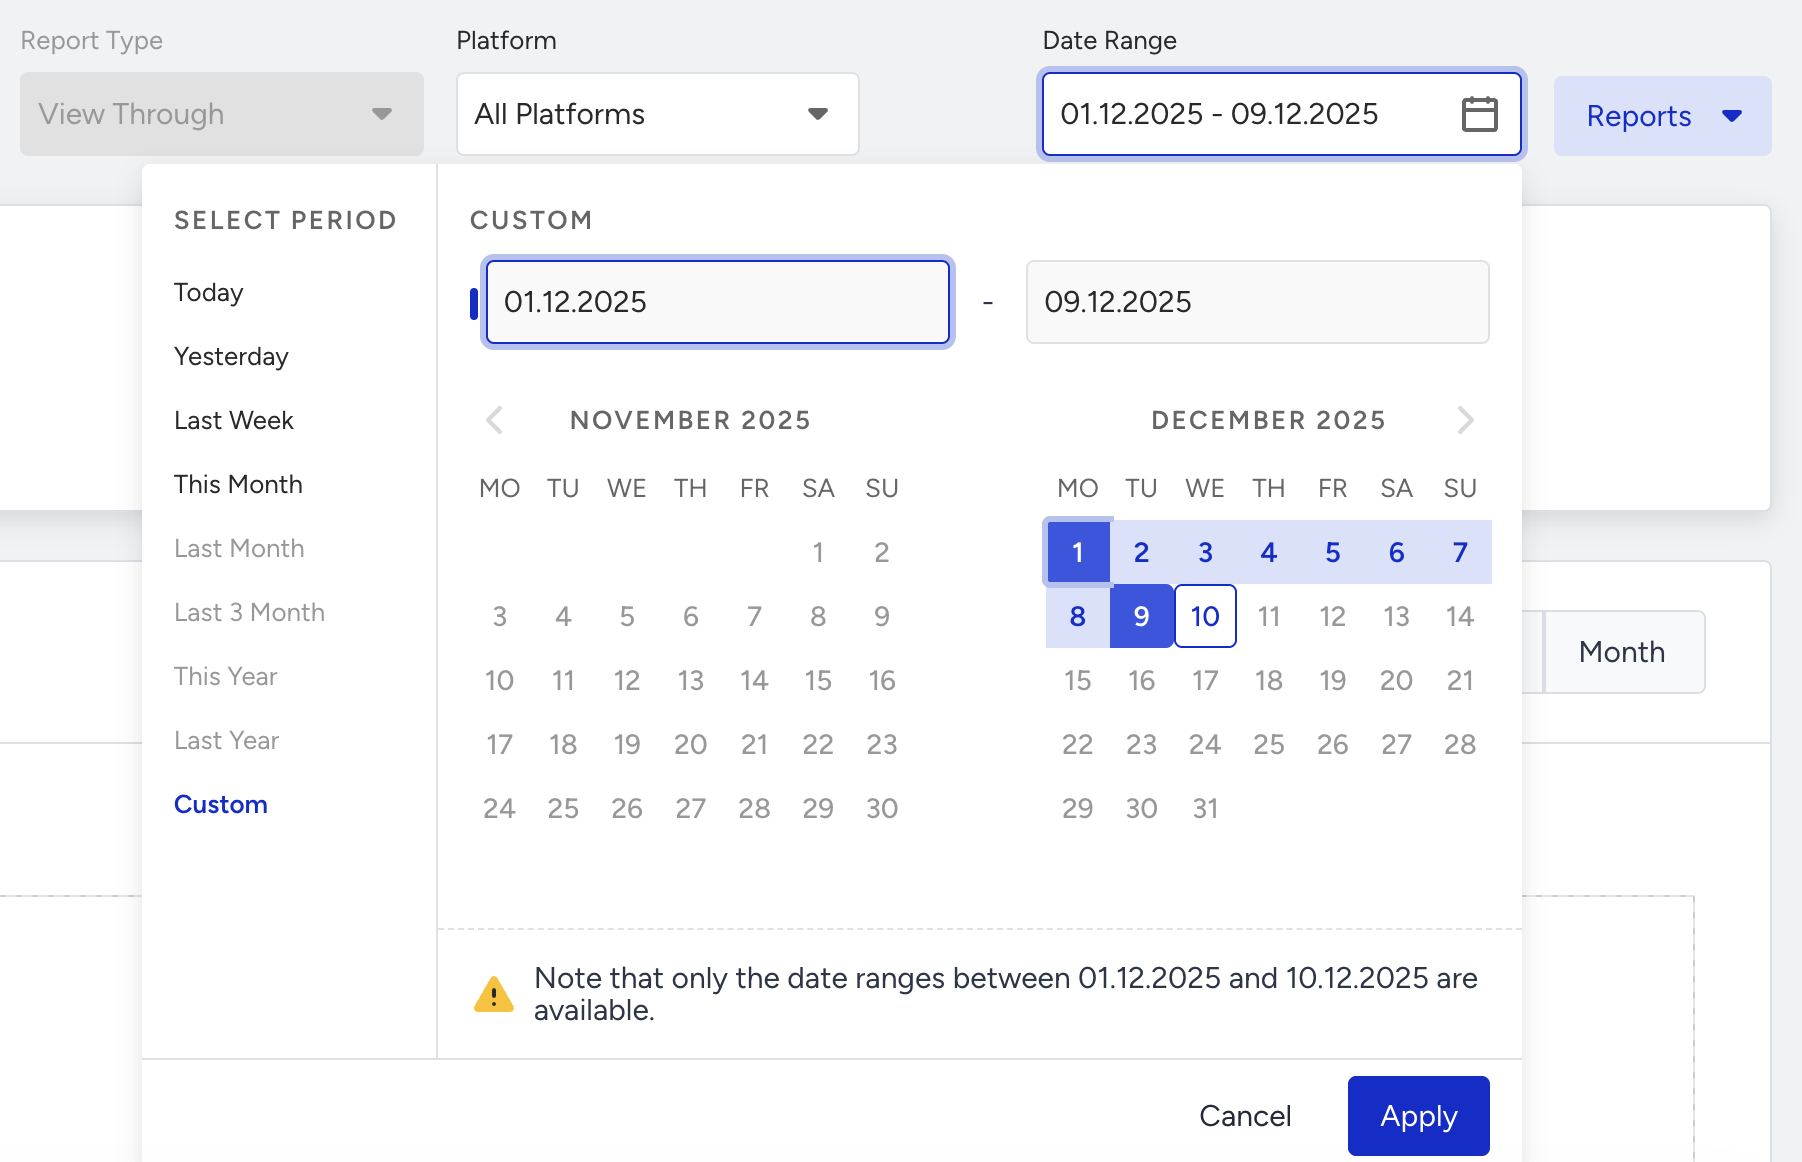
Reports
You can export campaign analytics, leads, and coupons and view reports on your analytics page.
Export Campaign Analytics
Select Reports > Export to click the Create Report button.
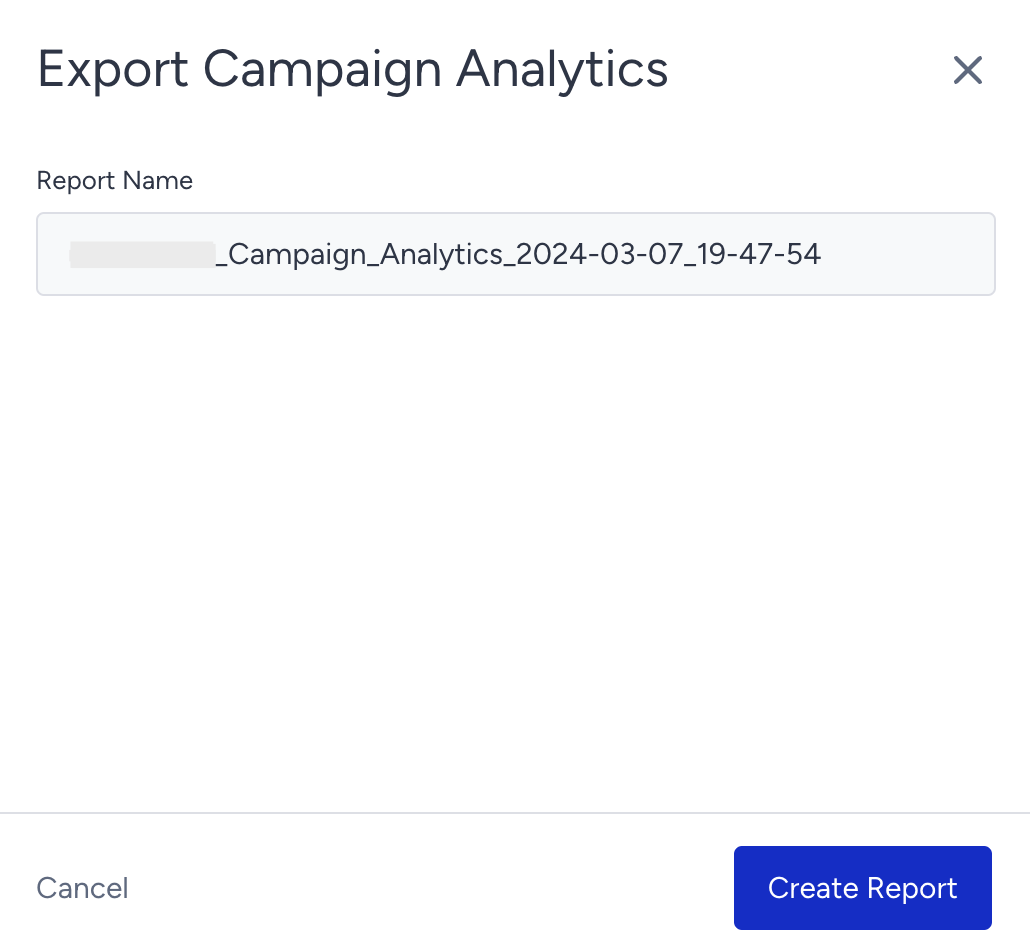
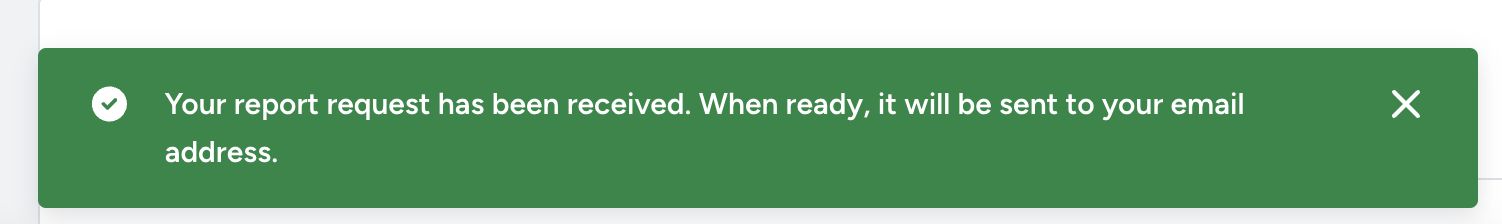
Once your request is received, you will see a message and a progress bar indicating that your report is being generated.
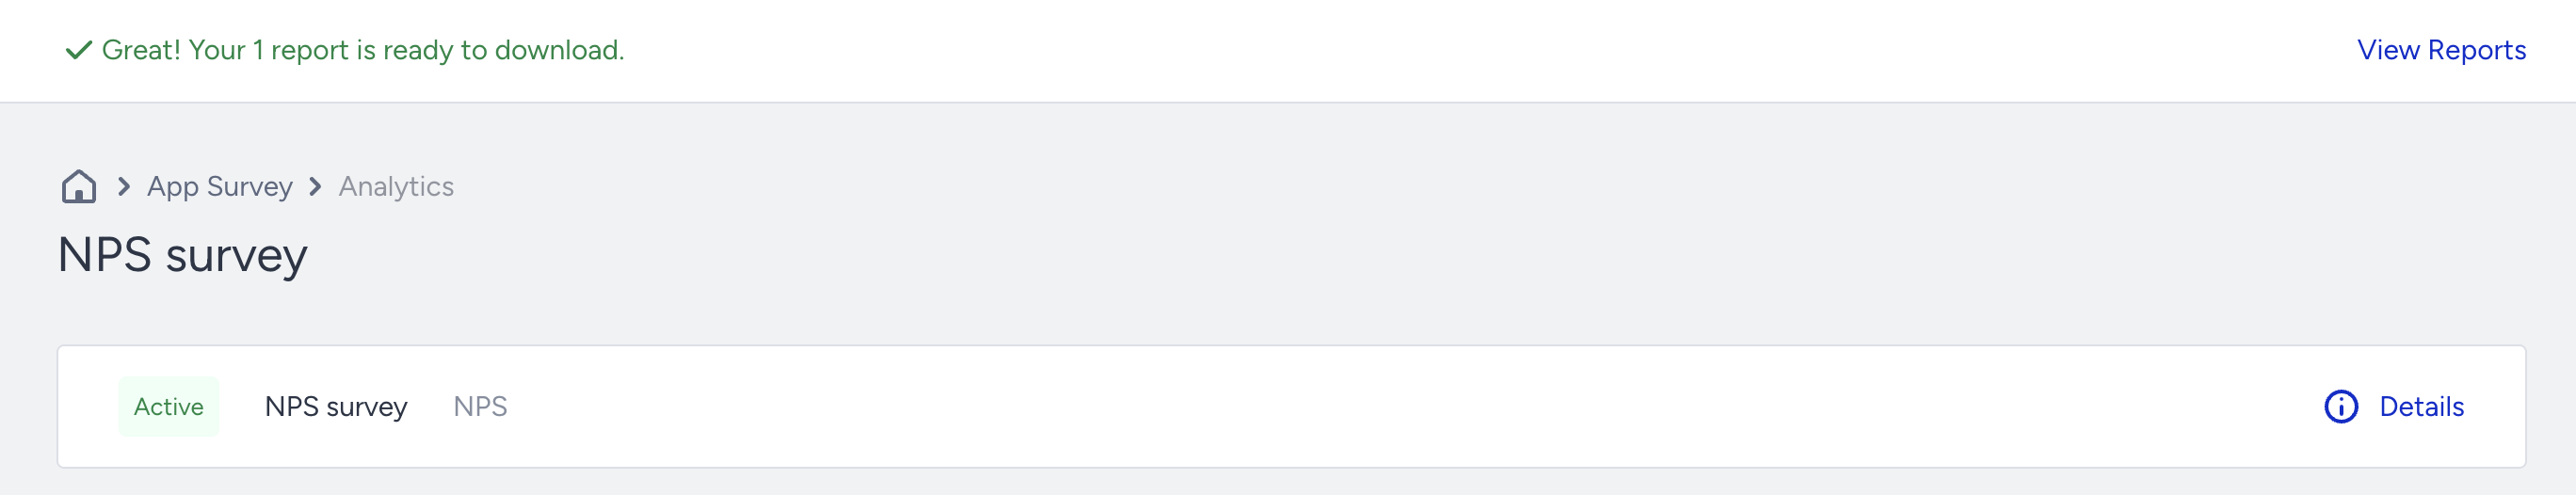
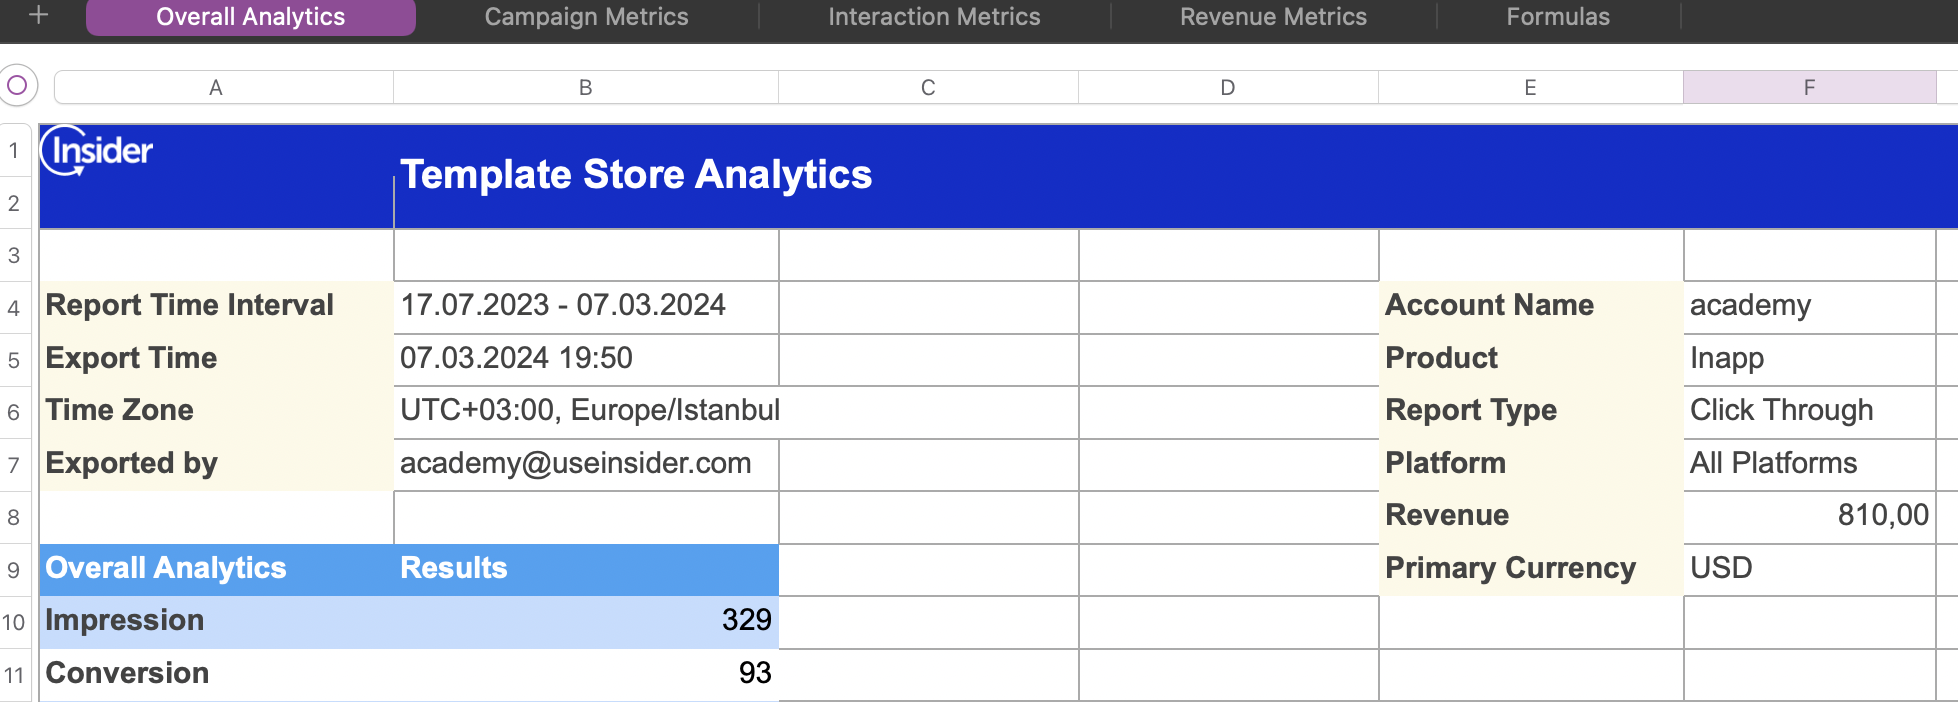
Click the View Reports button to see your generated reports in XLS format.
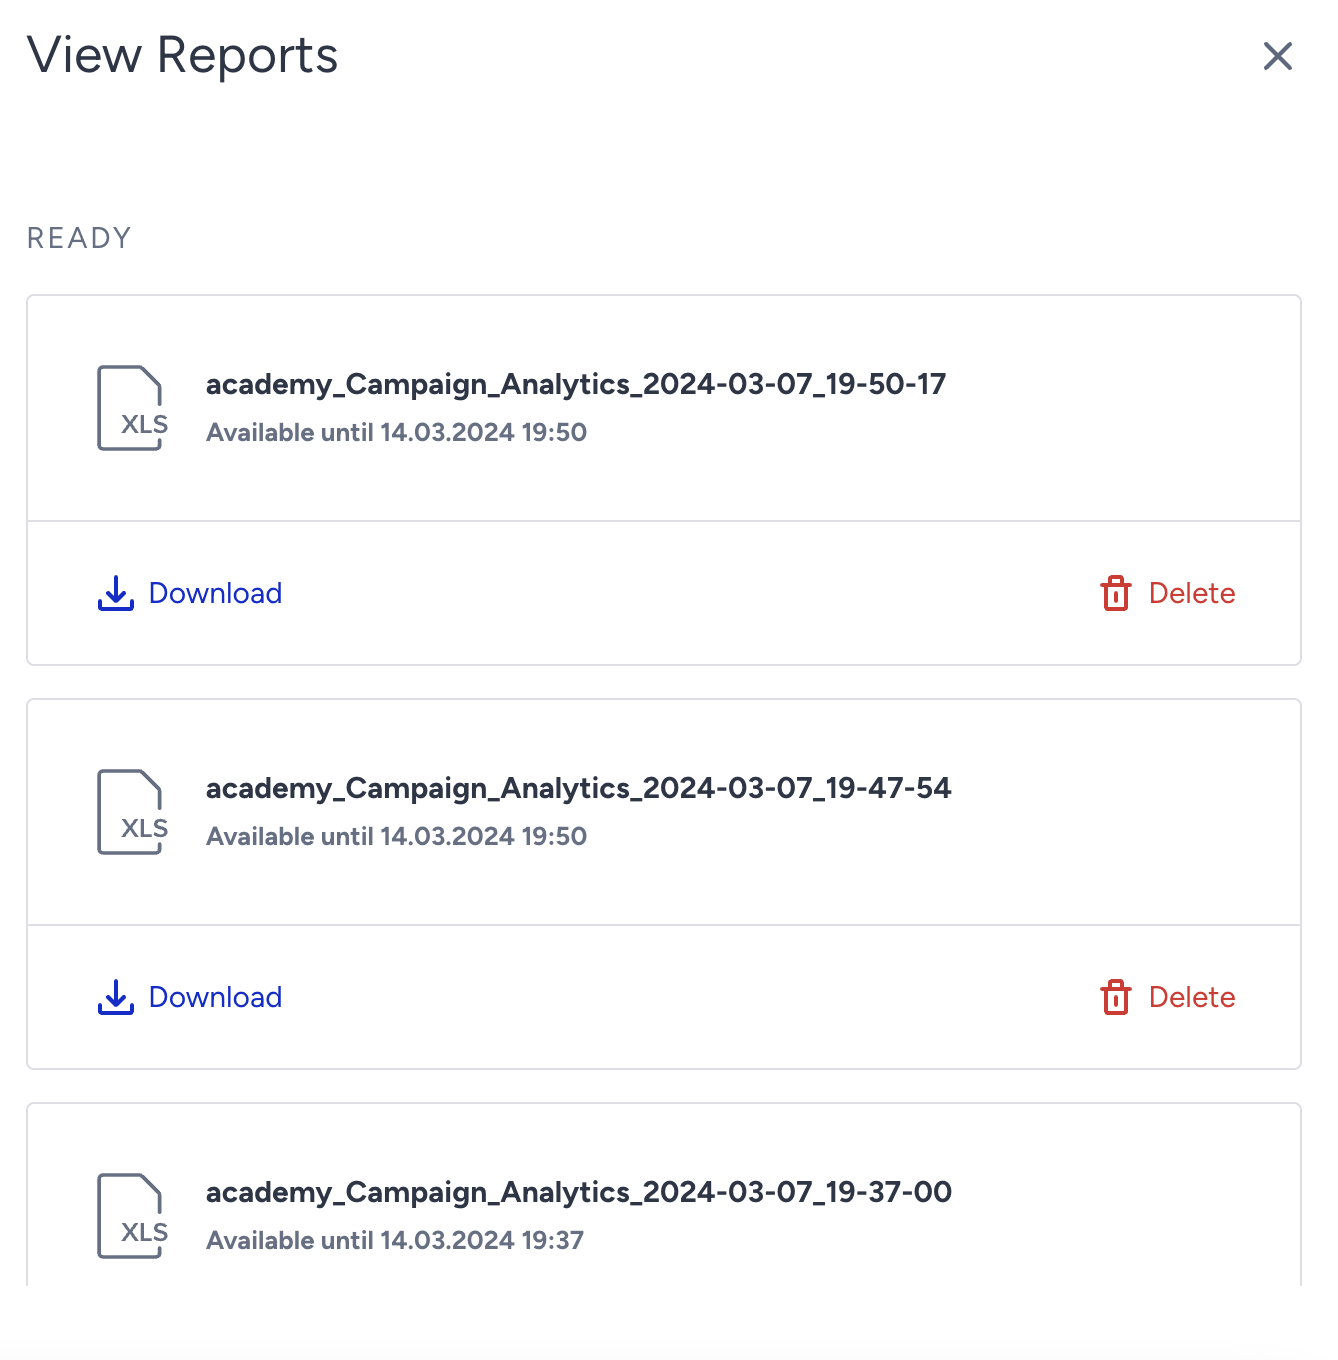
You can export your results to your local computer with the following details and metrics:
- Campaign name
- Variations
- Segment name
- Global frequency capping status
- Start date & time
- End date & time
- Impression
- Users
- Button clicks
- Primary goal & secondary goal(s) if applicable
- Uplift
- Significance
- Revenue & converted revenue
Export Leads
Select Reports > Leads to request your report.

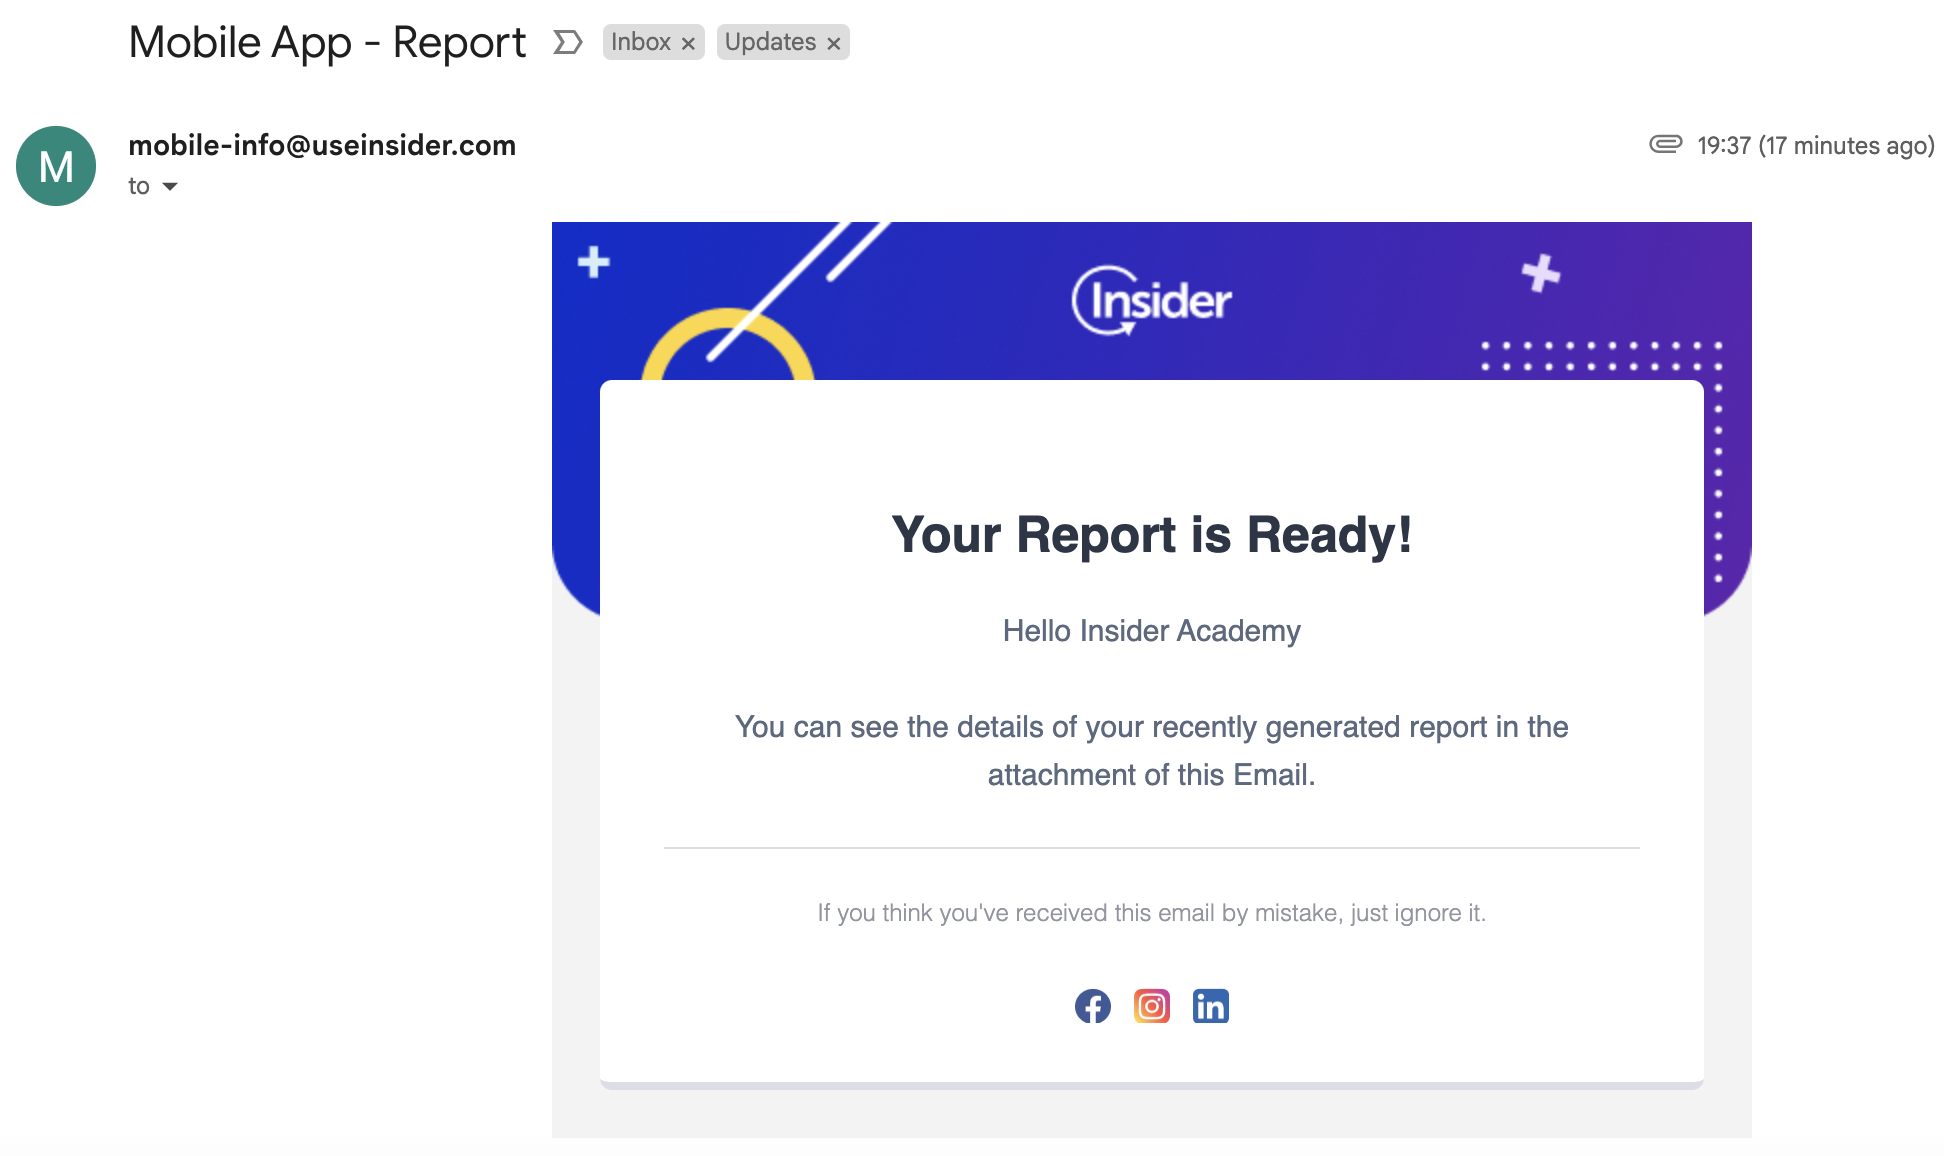
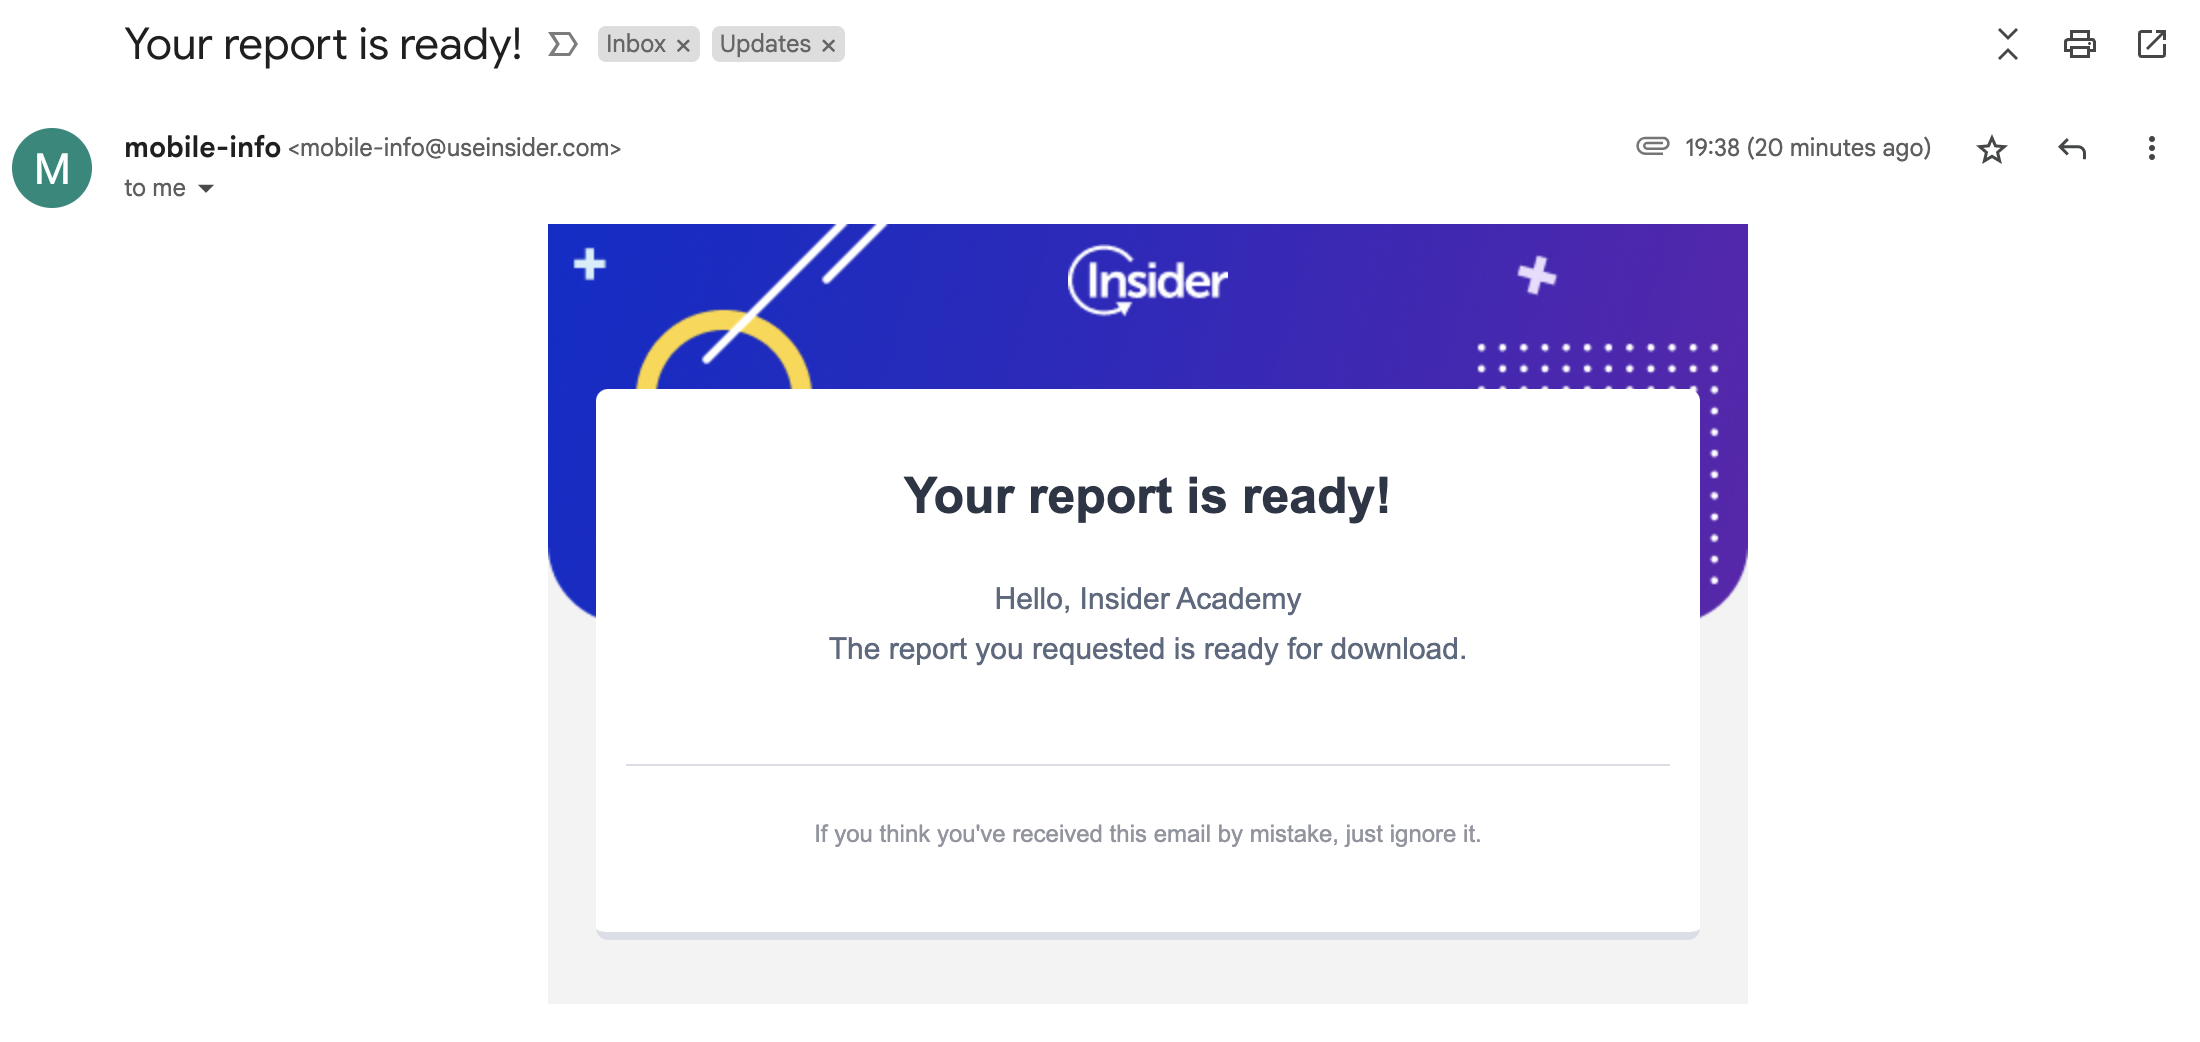
You will receive an email with a CSV report in your inbox.
Export Coupons
Select Reports > Coupons to request your report to see which coupon codes are offered to which users.
You will receive an email with a report in XLSX format in your inbox.
Metrics
For your campaigns, you can view the following metrics:
- Impressions: The number of times the campaign was viewed by users. This metric covers the users who view the surveys but not those who submit them.
- Users: The number of users that viewed your campaigns.
- Conversion Rate: The percentage of the conversions to the impressions.
- Conversions: The number of successful goal accomplishments.
- Revenue by Currency: The value of purchases by users who started shopping by clicking your variant.

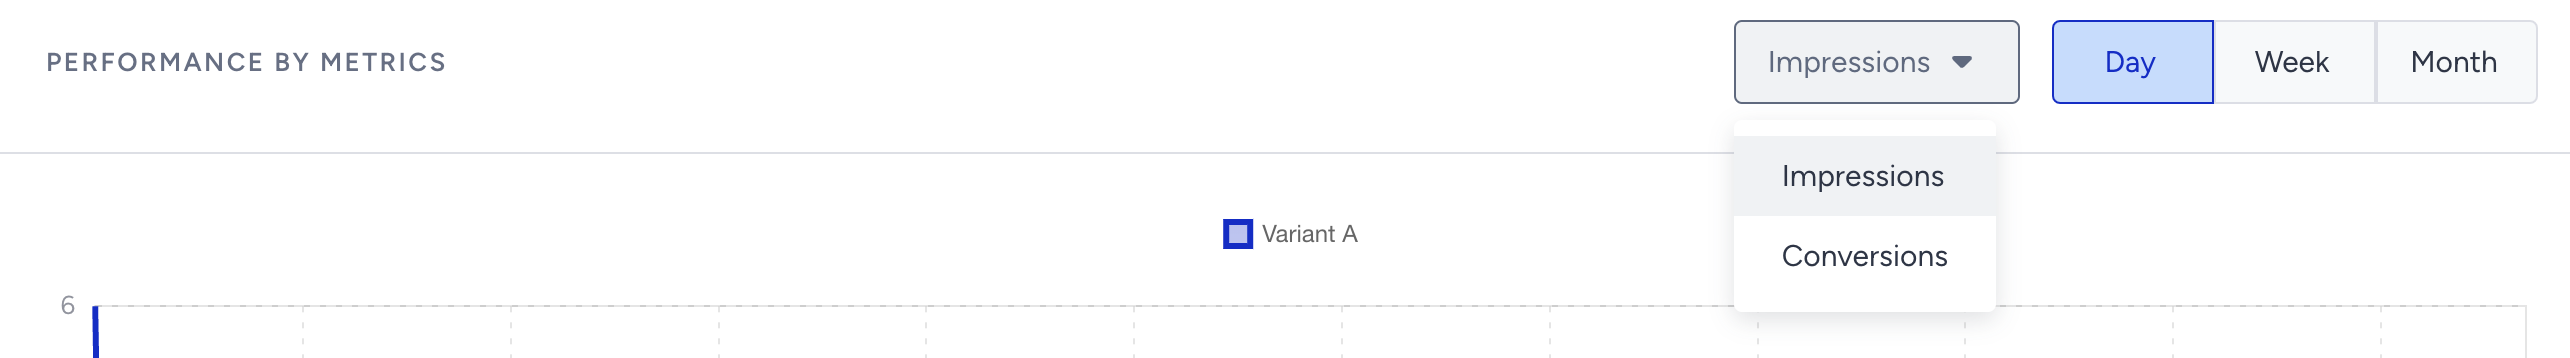
Performance by Metrics
This chart displays your variants' impressions and conversions daily, weekly, or monthly.
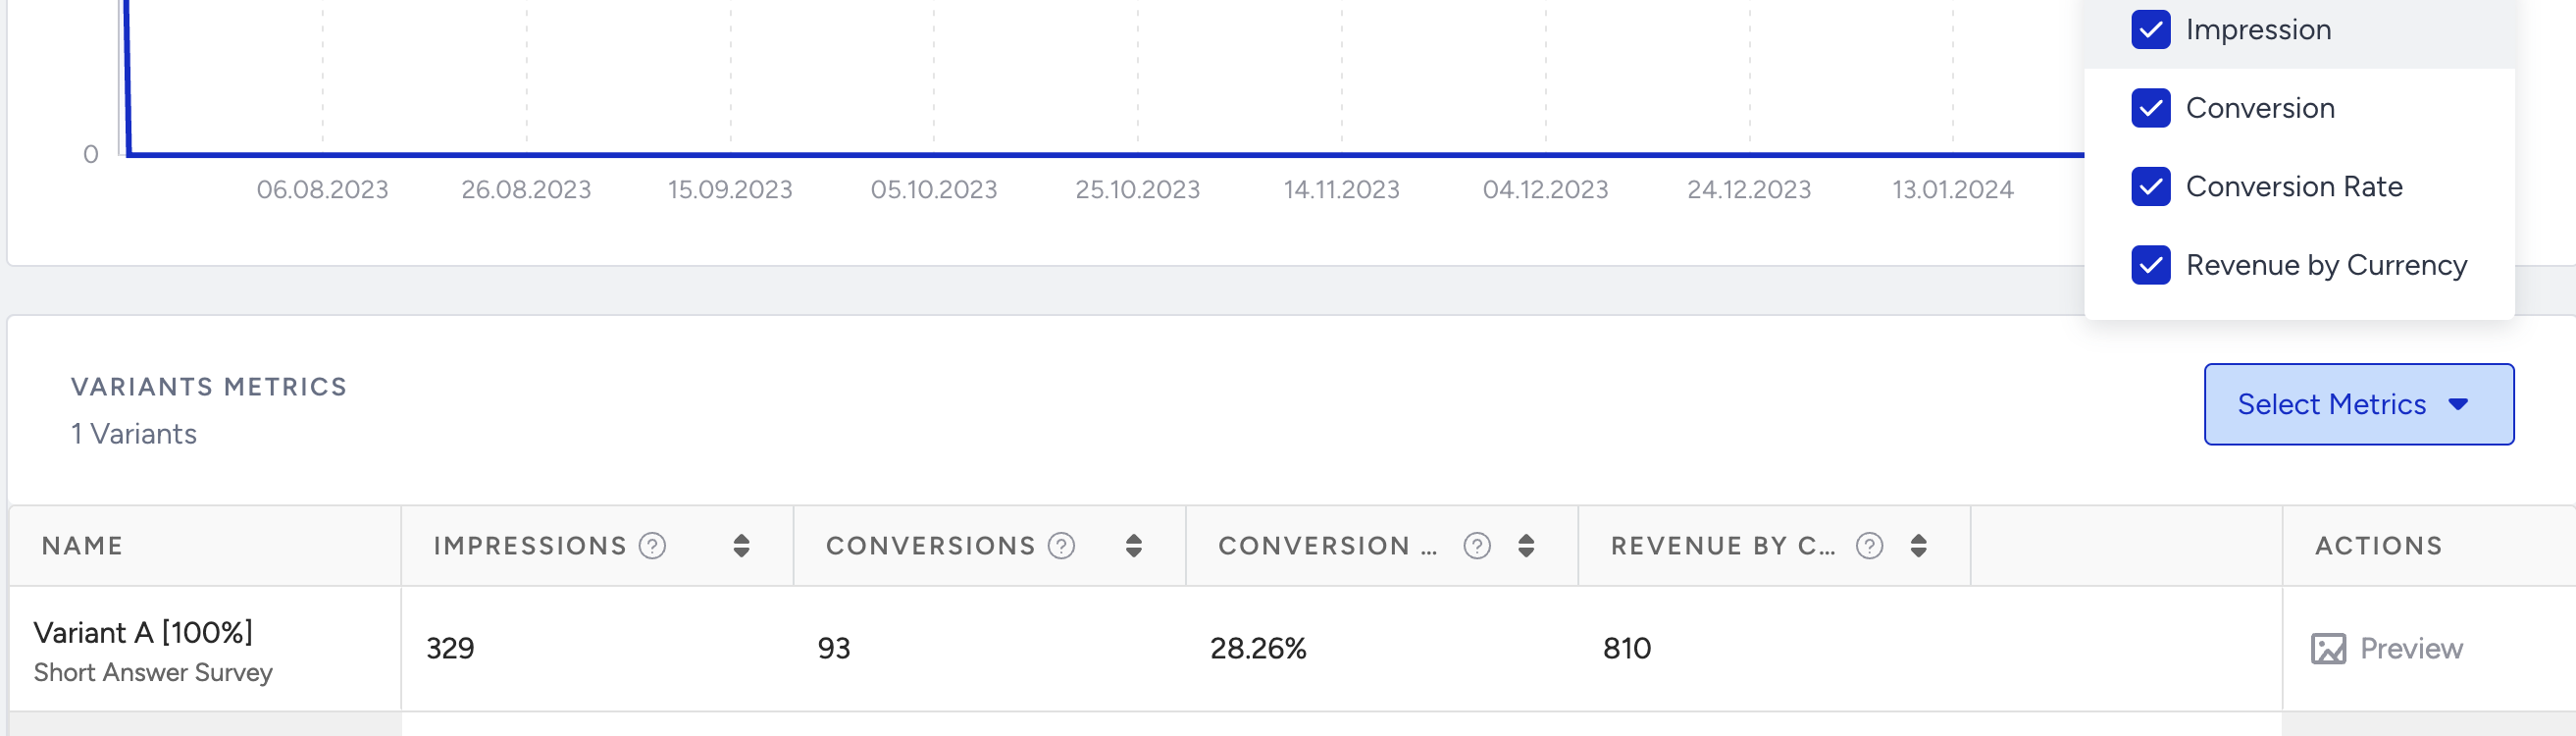
Variants Metrics
The variants table displays the variants of your campaign and their breakdown of impressions, conversions, conversion rate, and revenue by currency. You can also click the Preview button to see a preview of your variation.