The Executive Summary Dashboard helps you view the performance of your marketing activities across all Insider One tools. It’s designed to help you track key metrics, monitor campaign success, and identify growth opportunities. It helps you answer key questions like:
Are we using Insider One’s capabilities to their full potential?
Which products drive the most engagement and conversions?
Where can we improve adoption or campaign results?
You can review this dashboard regularly, stay ahead of trends, measure ROI, and continuously optimize your strategy.
This guide explains the following concepts:
Intended audience
Anyone managing campaigns, data, or performance can benefit from the dashboard.
Marketers and CRM managers can review campaign engagement and conversion results.
Growth and retention teams can spot audience trends and areas for optimization.
Analysts and strategists can measure adoption and channel effectiveness across Insider One’s tools.
Dashboard content
Your dashboard is organized to give you both a high-level overview and channel-level details that help you understand performance from every angle.
You can use your Executive Summary Dashboard:
After launching campaigns to measure the immediate impact.
During monthly or quarterly performance reviews.
Before planning new initiatives to identify what’s working.
Anytime you want to validate results or share success internally.
Executive summary
It is a snapshot of product usage, active campaigns, and engagement trends, and helps you understand how effectively you’re using Insider One’s capabilities.
Channel insights
This section displays performance by product and helps you track the channels that are driving the strongest results.
(2).png)
Adoption metrics
You can observe the feature usage and campaign volume over time, spot adoption gaps, and plan enablement or expansion.
(2).png)
Engagement metrics
You can monitor interaction rates, click-throughs, and conversions, and identify campaigns or audiences that deliver the highest return on investment.
(2).png)
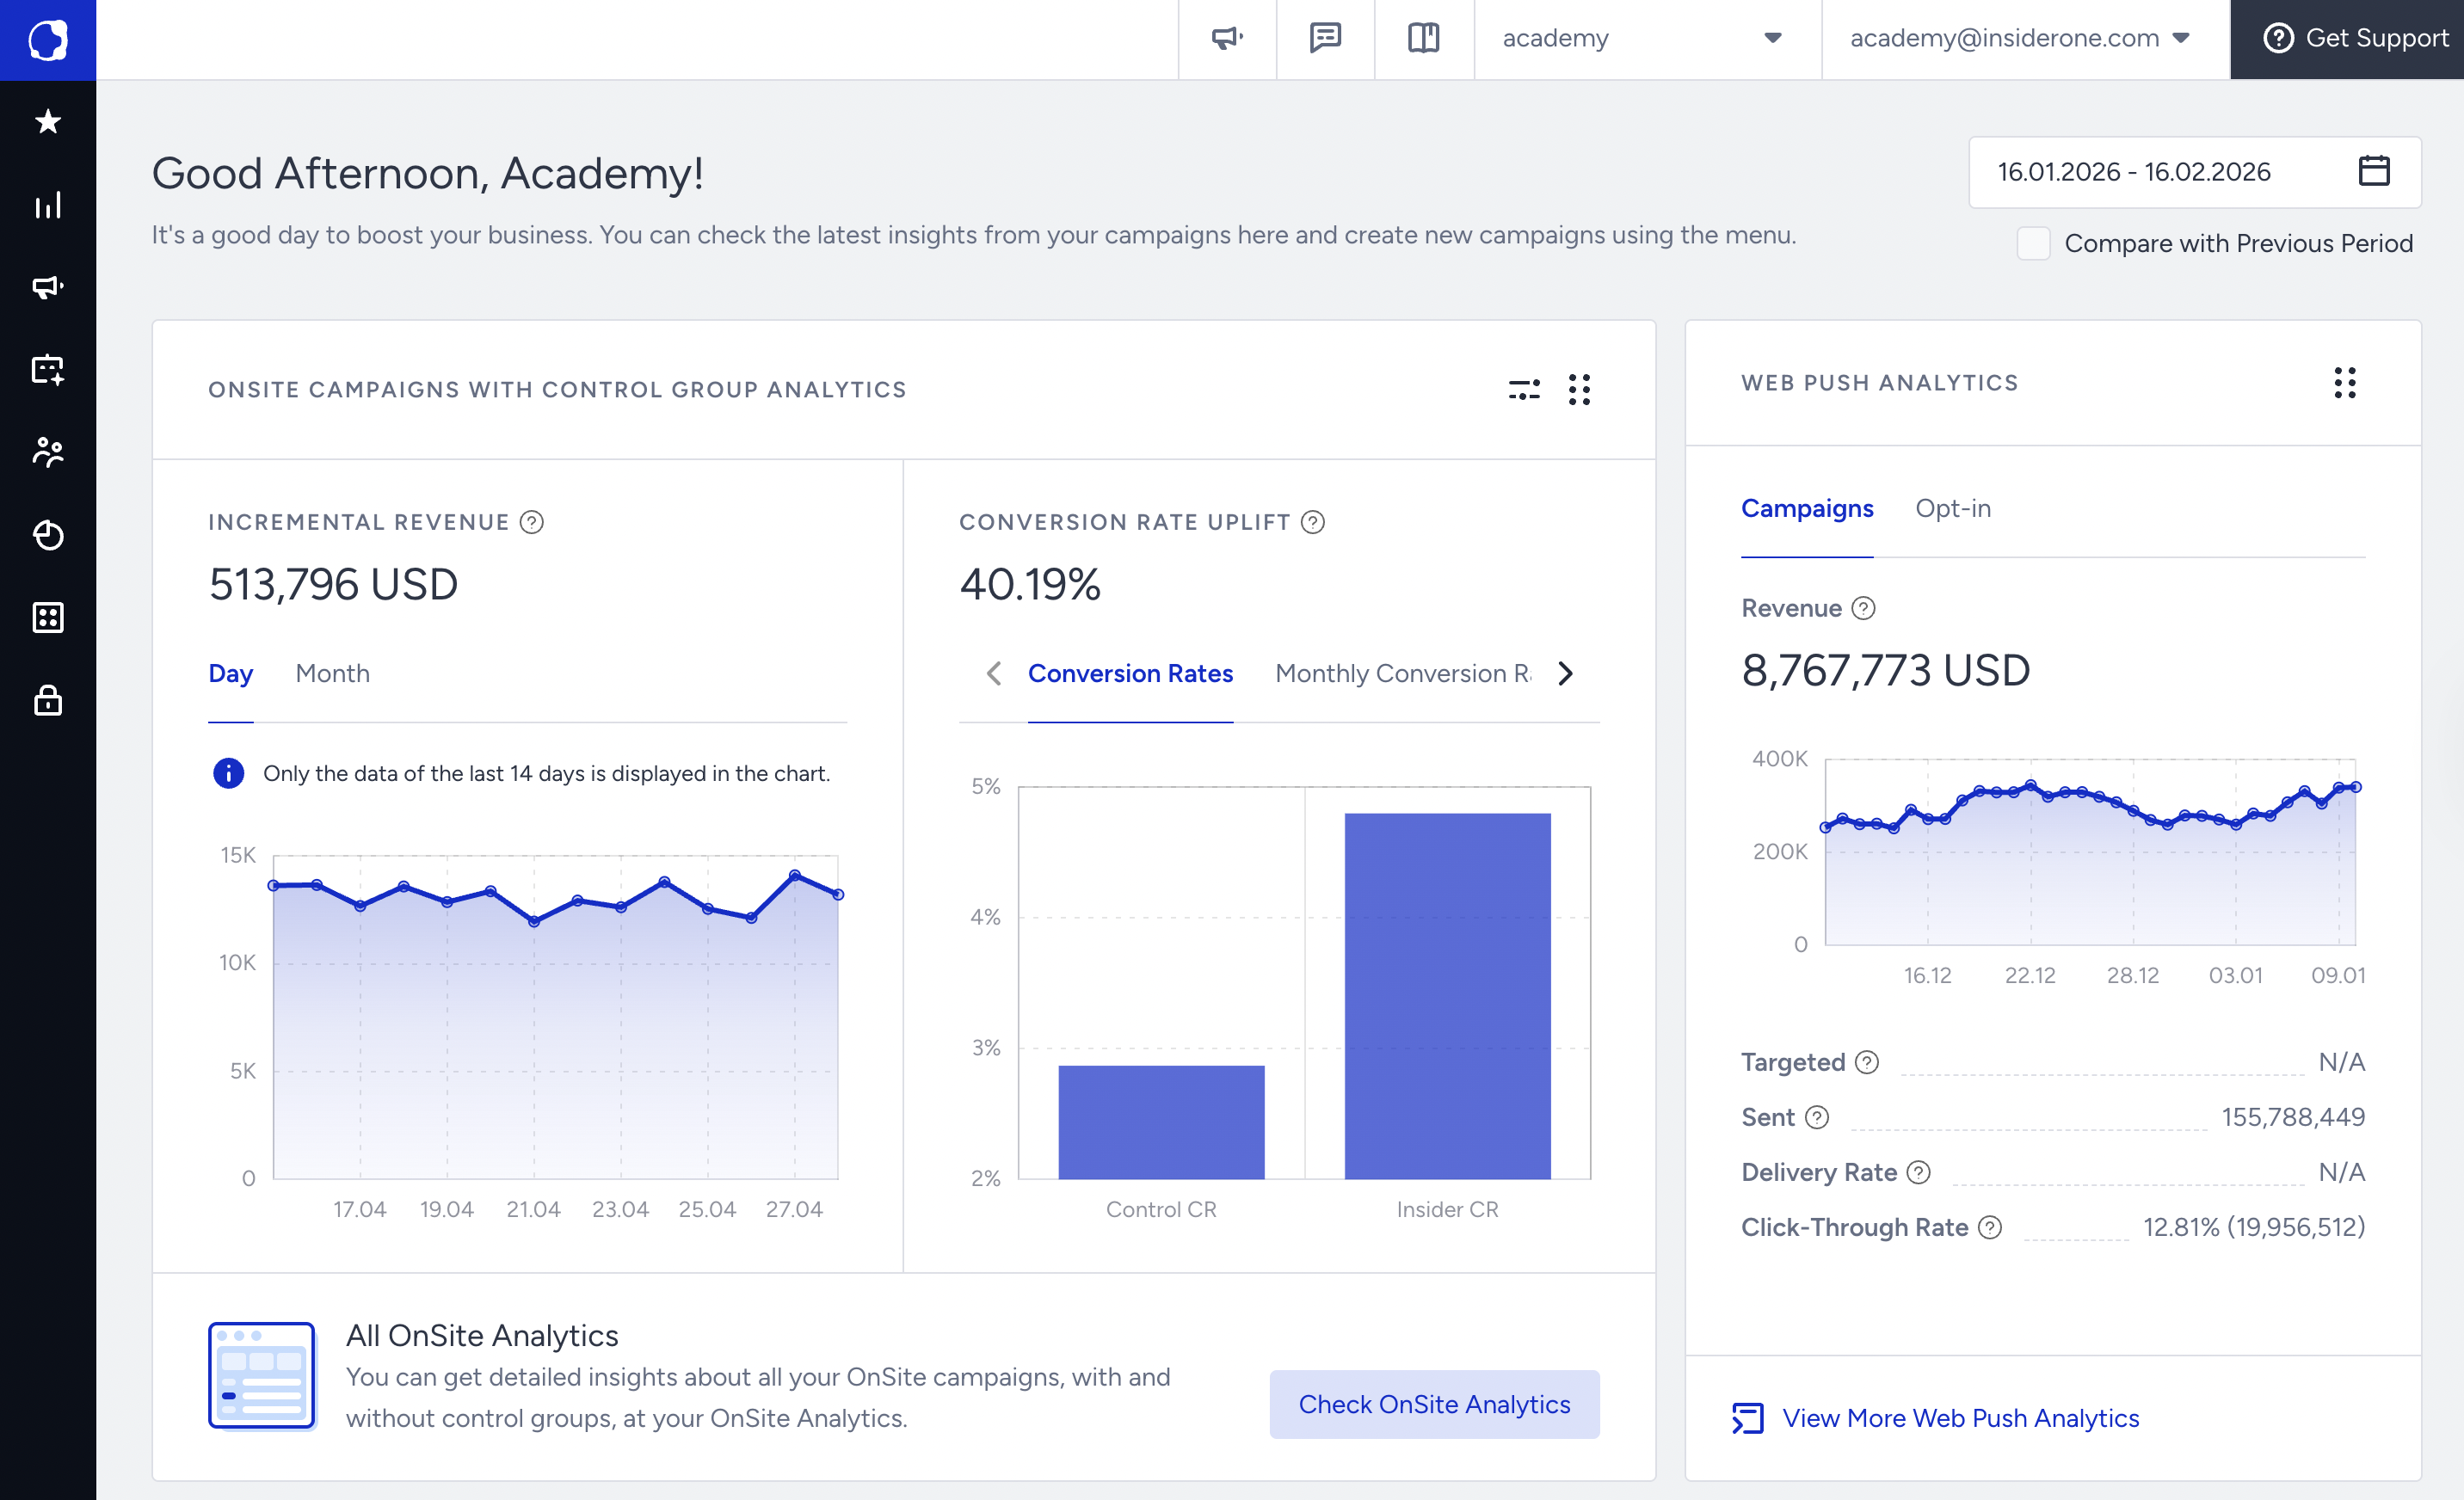
OnSite campaigns with control group
You can track incremental revenue and conversion rate uplift relative to the control group to measure the true impact of onsite campaigns.
(2).png)
Data interpretation and action
You can interpret the dashboard data and plan actions accordingly.
Review tooltips or info icons for definitions. For example, “Engagement Rate” shows the percentage of users who interacted with your campaign.
Use the date range selector to compare current and previous performance.
Spot red flags early. A drop in engagement or usage may signal campaign fatigue, segment overlap, or timing issues.
Link patterns across channels. For example, you can see how email performance affects web or app engagement.
Below are some example actions.
Engagement is declining.
You can review recent campaign frequency and personalization, and A/B test new formats or messages.
Adoption of a specific product is low.
You can explore feature guides in Insider One Campus or reach out to your Insider One contact for enablement.
Performance varies by channel.
You can identify top-performing channels and replicate successful tactics across others.
Benchmark gap is identified.
You can use comparative data to set new optimization goals with your team.
Dashboard success tips
Below are some tips to get the most out of your dashboard.
Adjust the date range to compare performance over different periods (weekly, monthly, quarterly).
Use the Compare to Previous Period option to understand whether key metrics are improving or declining.
Focus on outcome metrics such as Incremental Revenue, Incremental Conversions, Conversion Rate (CR), and Conversion Rate Uplift to understand real business impact.
Compare trends across channels to see where results are improving or declining.
Use longer time ranges to spot patterns and shorter ranges to investigate recent changes or drops.
Bookmark key reports so you can revisit them quickly.
Use the dashboard as a shared reference during internal reviews or team discussions.
Customize your view to focus on the channels most relevant to your goals.
Check regularly because consistency helps you track the long-term impact of your campaigns.
FAQs
Q: How often does the dashboard update?
A: Metrics refresh automatically, depending on data type. Most performance metrics update daily; some adoption and benchmark data may update weekly or monthly.
Q: What if my data looks incomplete or empty?
A: Try adjusting your date range or channel filters. If you still don’t see data, it might be due to campaign inactivity or visibility settings in your panel.
Q: Can we compare performance by product or channel?
A: Yes, you can switch between different product dashboards or use cross-channel views to see how results vary across Web, App, Email, and more.
Q: Where can we learn more about specific metrics?
A: Read more in the Executive Summary Dashboard or ask the Academy's AI assistant your questions about metrics and how to interpret them.