The Overall Analytics dashboard provides a single, comprehensive view of your marketing performance across all Insider One products and channels. It’s your go-to page for understanding the total impact of your campaigns; there's no need to jump between multiple analytics pages.
With Overall Analytics, you can:
See the big picture of your marketing initiatives and their results.
Compare performance across channels like OnSite, Web Push, Architect, Email, SMS, WhatsApp, and Smart Recommender.
Identify opportunities for optimization and growth.
Export and share key metrics for internal reporting.
This guide explains the following concepts:
Key sections and their usage
Overall performance
In this section, you will find:
Number of campaigns
Total revenue
Total conversions
Conversion rate (CR)
Conversion rate uplift
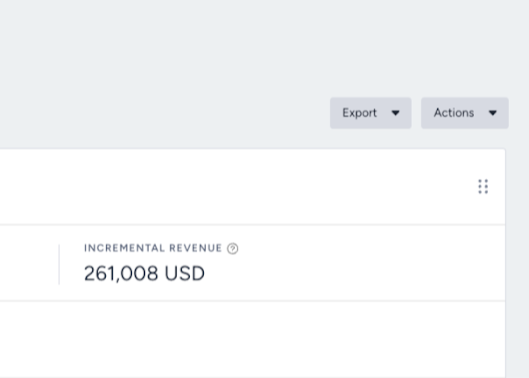
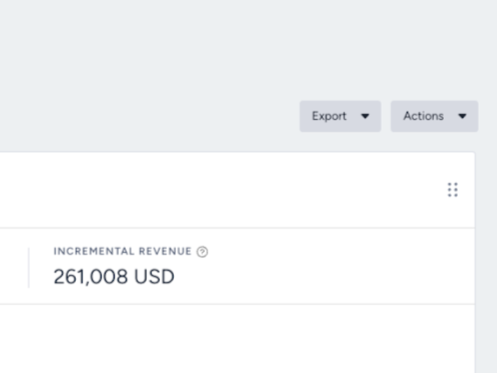
Incremental revenue
Revenue-by-channel bar chart
(2).png)
This section shows how all channels and campaigns perform together. You can review performance over your selected date range and compare channels quickly via the bar chart.
Recommended actions:
If campaign count is high but CR is low, optimize targeting/creative.
If a channel drives strong revenue, consider scaling it.
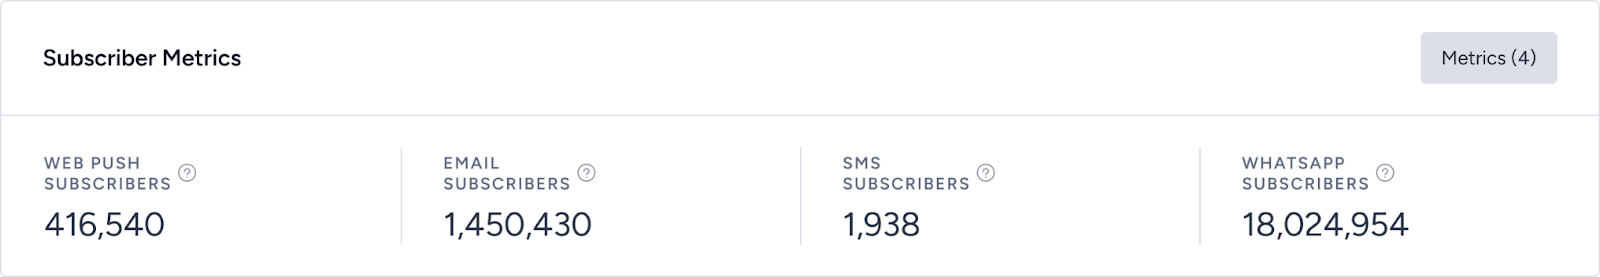
Subscriber metrics
Subscriber counts for Email, SMS, WhatsApp, Web Push, and other messaging channels (updated daily).
(2).png)
This section shows how large and reachable your audiences are today. You can compare audience sizes across channels to find growth or activation opportunities
Recommended actions:
If a channel has high subscribers but low revenue, activate this audience.
Use targeted campaigns to re-engage inactive groups.
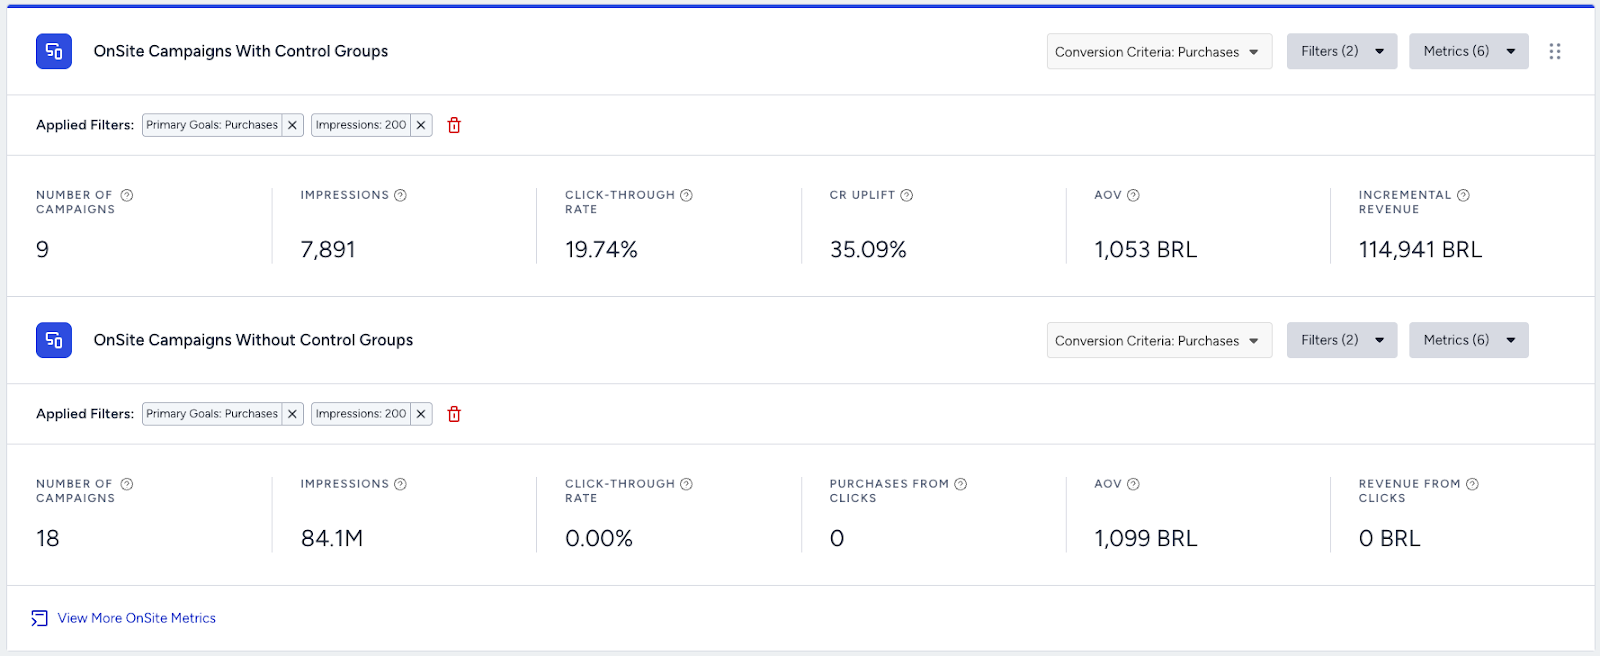
Product-level metrics
Customizable product cards for OnSite, Web Push, Email, SMS, WhatsApp, Architect, and Smart Recommender. You can choose up to 6 metrics per product. Each includes a View More link.
(2).png)
This section lets you drill down into specific product performance without leaving the page. You can select the metrics that matter most to your business and save your default view.
Recommended actions:
Use View More to access the deeper channel dashboards.
Identify top- or bottom-performing products and take action.
Customize and save
You can show/hide sections, reorder cards, and save your preferred metric layout.
This part helps you build a personalized view that matches your KPIs. You can click Save as Default to keep your preferred setup.
Recommended action: Standardize your team’s view by aligning on which metrics to always include.
Export and share
You can download performance summaries for reporting.
Exporting makes it easy to share insights internally. You can export key metrics for presentations, reviews, and planning.
Recommended action: Include snapshots in your regular performance check-ins.
AI summarize
You can quickly understand performance trends without manually analyzing every metric.
(2).png)
This section helps you get an instant summary of what’s improving, declining, or stable. You can use AI Summarize first to get the big picture, then drill into individual channel dashboards for deeper analysis.
Recommended actions:
Review performance for a new date range
Prepare for internal check-ins or planning sessions
Quickly validate whether recent changes had an impact
Interpret results
High campaign count + low CR
(2).png)
If the campaign count is high but the conversion rate is low, this might mean the campaigns aren’t resonating with the audience.
Recommended action: Revisit targeting, message, creative, or placement.
One channel generates the majority of revenue
(2).png)
If one channel generates the majority of revenue, it might signal a strong growth opportunity.
Recommended action: Scale efforts in that channel.
Low revenue + high subscriber count
This might signal an untapped or underutilized audience.
Recommended action: Launch targeted reactivation or engagement campaigns.
Revenue drop in a channel
(2).png)
A revenue drop in a channel might signal a possible segmentation, technical, or creative issue.
Recommended action: Check the channel dashboard and look for dips in impressions, clicks, or delivery.
Strong uplift in one product card
(2).png)
A strong uplift in one product card might signal that the product is performing above baseline.
Recommended action: Identify factors contributing to success and replicate in other channels.
Changes in revenue, conversions, or campaign volume
(2).png)
Such changes might mean you need to spot the key drivers behind them with the AI Summarize feature.
Recommended action: Quickly validate whether recent changes had an impact and identify which channels deserve attention first.
Tips for success
Check regularly
Make it a habit to review Overall Analytics after major campaigns, during monthly/quarterly reviews, or before planning new initiatives.
Monitor channels
Identify one channel with strong performance and one channel that’s under-performing.
Compare channels
Use the revenue bar graph and product cards to spot which channels are driving the most value and build your action plan.
Optimize quickly
If you notice a drop or spike in any metric, click through to the detailed dashboard for that channel to investigate further.
Save your view
Use the Save as Default button to keep your favorite metrics and filters ready for next time.
FAQs
Q: Why do we see a zero or blank card for a product?
A: It could mean no campaigns have run for that product in the selected period. Try expanding the date range or checking campaign filters.
Q: How often is the data updated?
A: Metrics reflect up-to-date data, but subscriber counts show current-day values, regardless of the date filter.
Q: Can we compare channels side-by-side?
A: Yes, the Revenue by Channels bar shows multiple channels together. Then use product cards for deeper comparisons.
Q: What if we don’t have access to a product card?
A: Product cards appear based on the products included in your contract and currently enabled for your account. If you’re interested in adding access to additional products, reach out to your Account Director to discuss options.
Q: Can we customize the metrics we see?
A: Absolutely. You can add or remove metrics for each product card (minimum one, maximum six) and save your preferences.
Q: How do we access detailed analytics for a specific channel?
A: Click the “View More” button on any product card to jump directly to that channel’s analytics dashboard.
Q: Where can we learn more?
A: Refer to the Overall Analytics page for a full breakdown of each metric.