your title goes here
Suggested Reading: For further details on app push stats, refer to App Push Channel Analytics.
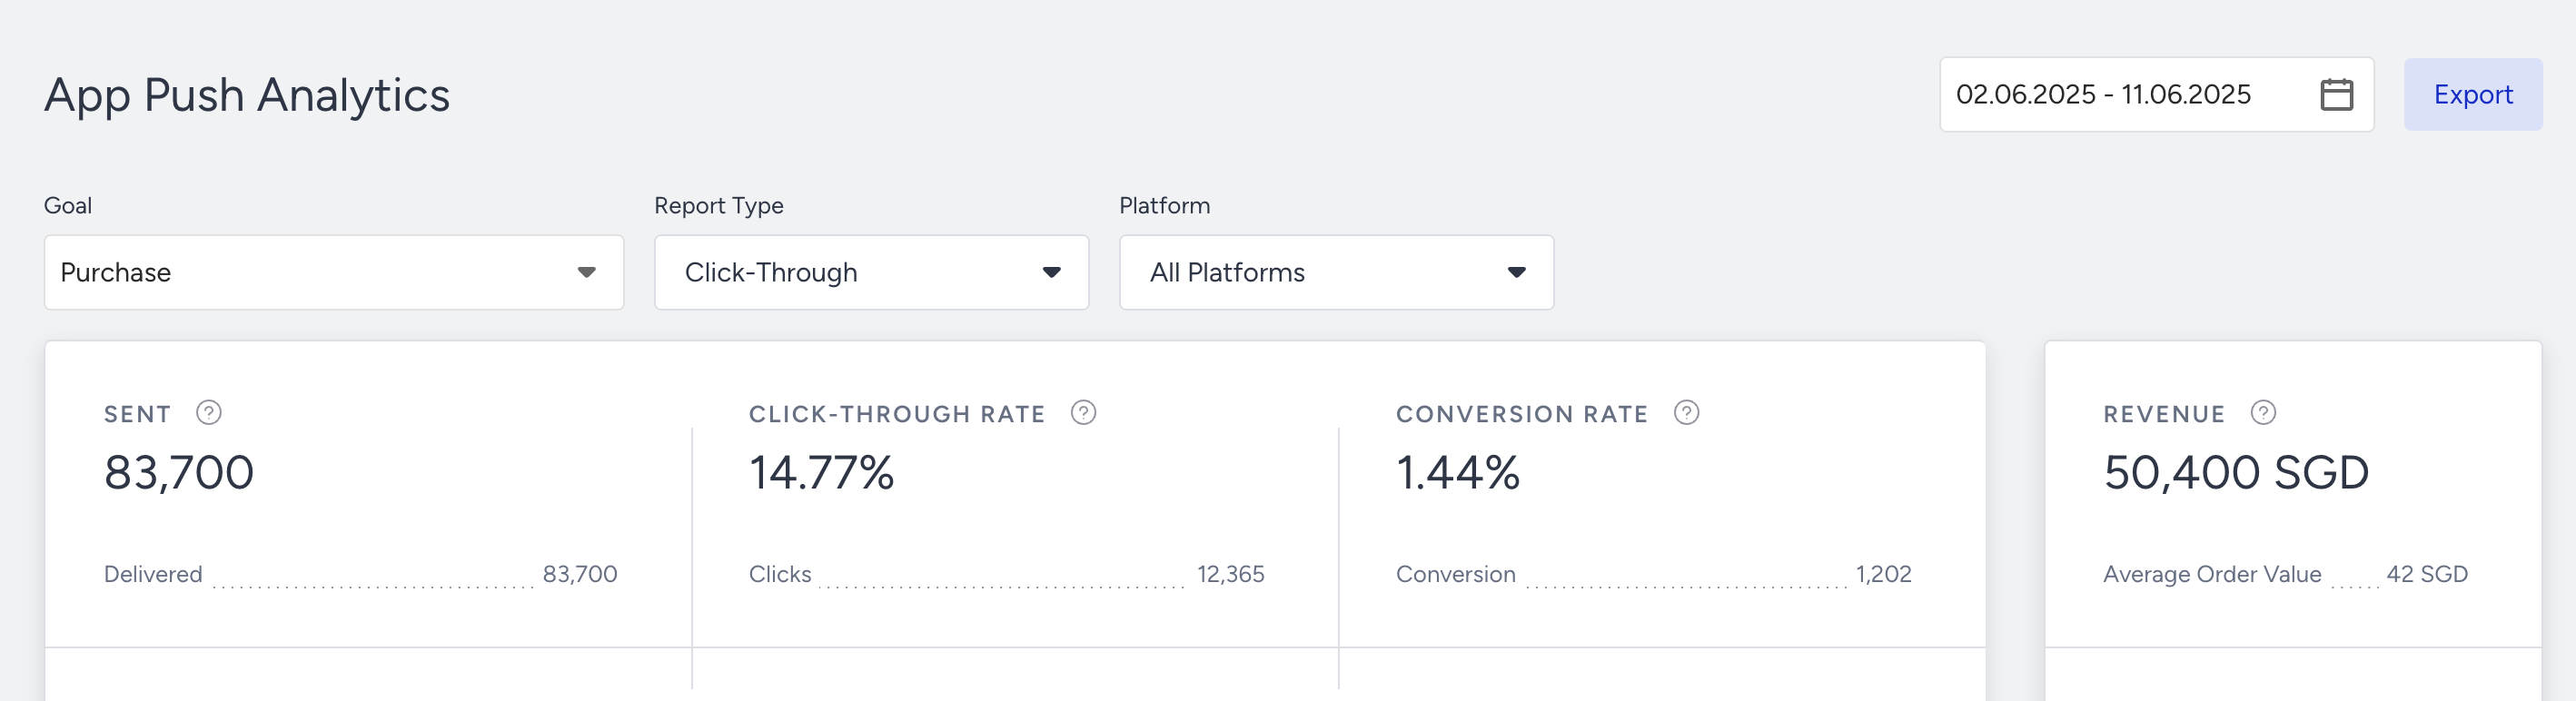
You can evaluate each app push (element) you add to your journey flow while it is running.
You can see Sent, Delivered, Click-Through Rate, Clicks, Conversions, Conversion Rate, Revenue, Average Order Value metrics, and their trends.
Live Stats
After you launch your journey, the Arrived and Reachable figures appear on the App Push element on the canvas.
.png)
- Arrived displays the number of users who have arrived at the App Push element.
- Reachable displays the number of reachable users on App Push.
- Dropped displays the number of unreachable users on App Push.
When two different users with the same Mobile Device Token enter a journey, they receive a push notification but not the same push as duplicated. If a user does not receive the duplicated notification, they will appear on Skipped (Duplicated). Each App Push element checks the mobile device token before sending any push notification.
(1).png)