NLP - AI Analysis reports enable you to observe the changes in success metrics for intents, entity detection, and utterances identified by the AI. This analysis focuses on key components, including the success rate of intents, the accuracy of entity detection, and the AI's ability to identify utterances. It is a crucial resource for evaluating and improving the assistant's performance. These reports help you understand how effectively the assistant operates over a specific period and how well it meets your needs.
In this guide, you will find answers to these questions:
How can I filter the results for the NLP-AI Analysis reports?
What are the graph displaying options for the NLP-AI Analysis reports?
Navigate to the NLP - AI Analysis reports
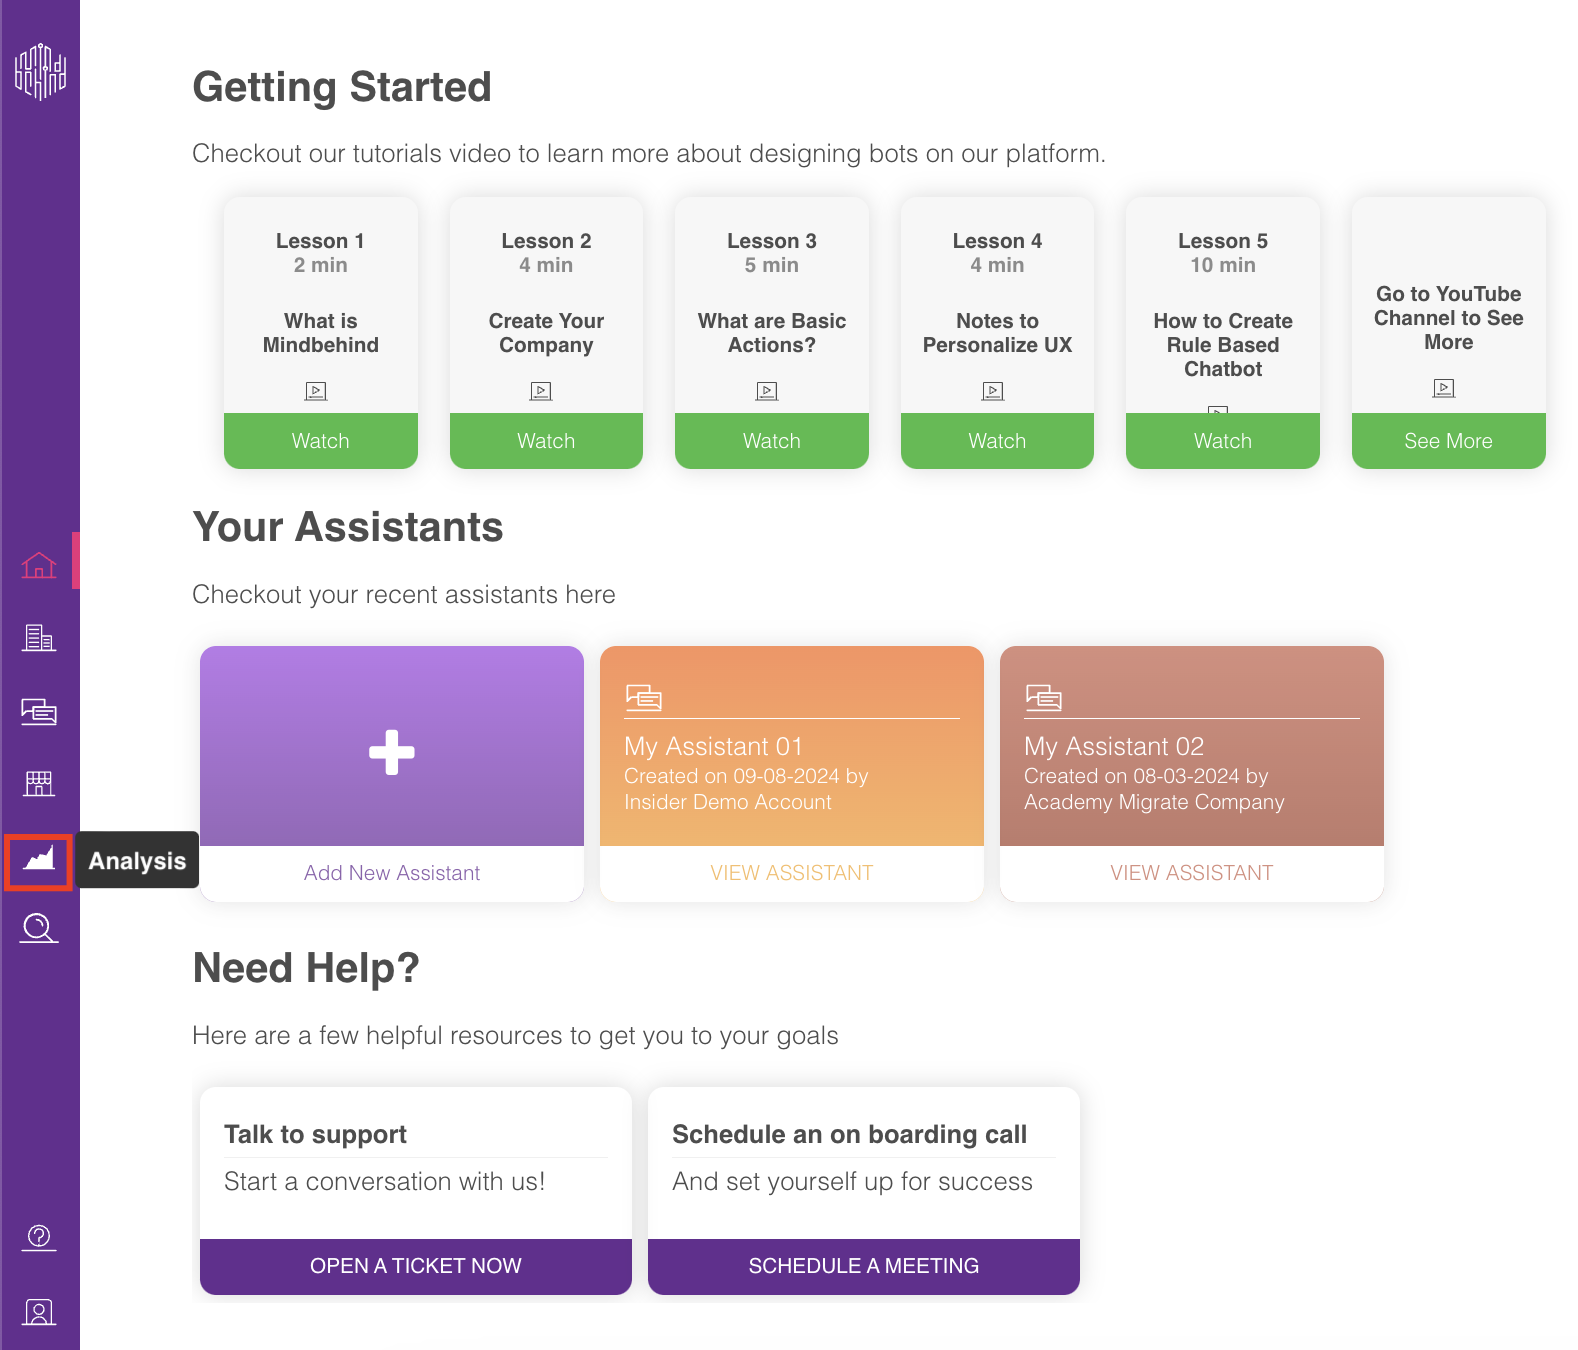
1. After logging in to your MindBehind Flow account, click Analysis on the navigation bar.
2. Click the NLP-AI Analysis box or the Explore button.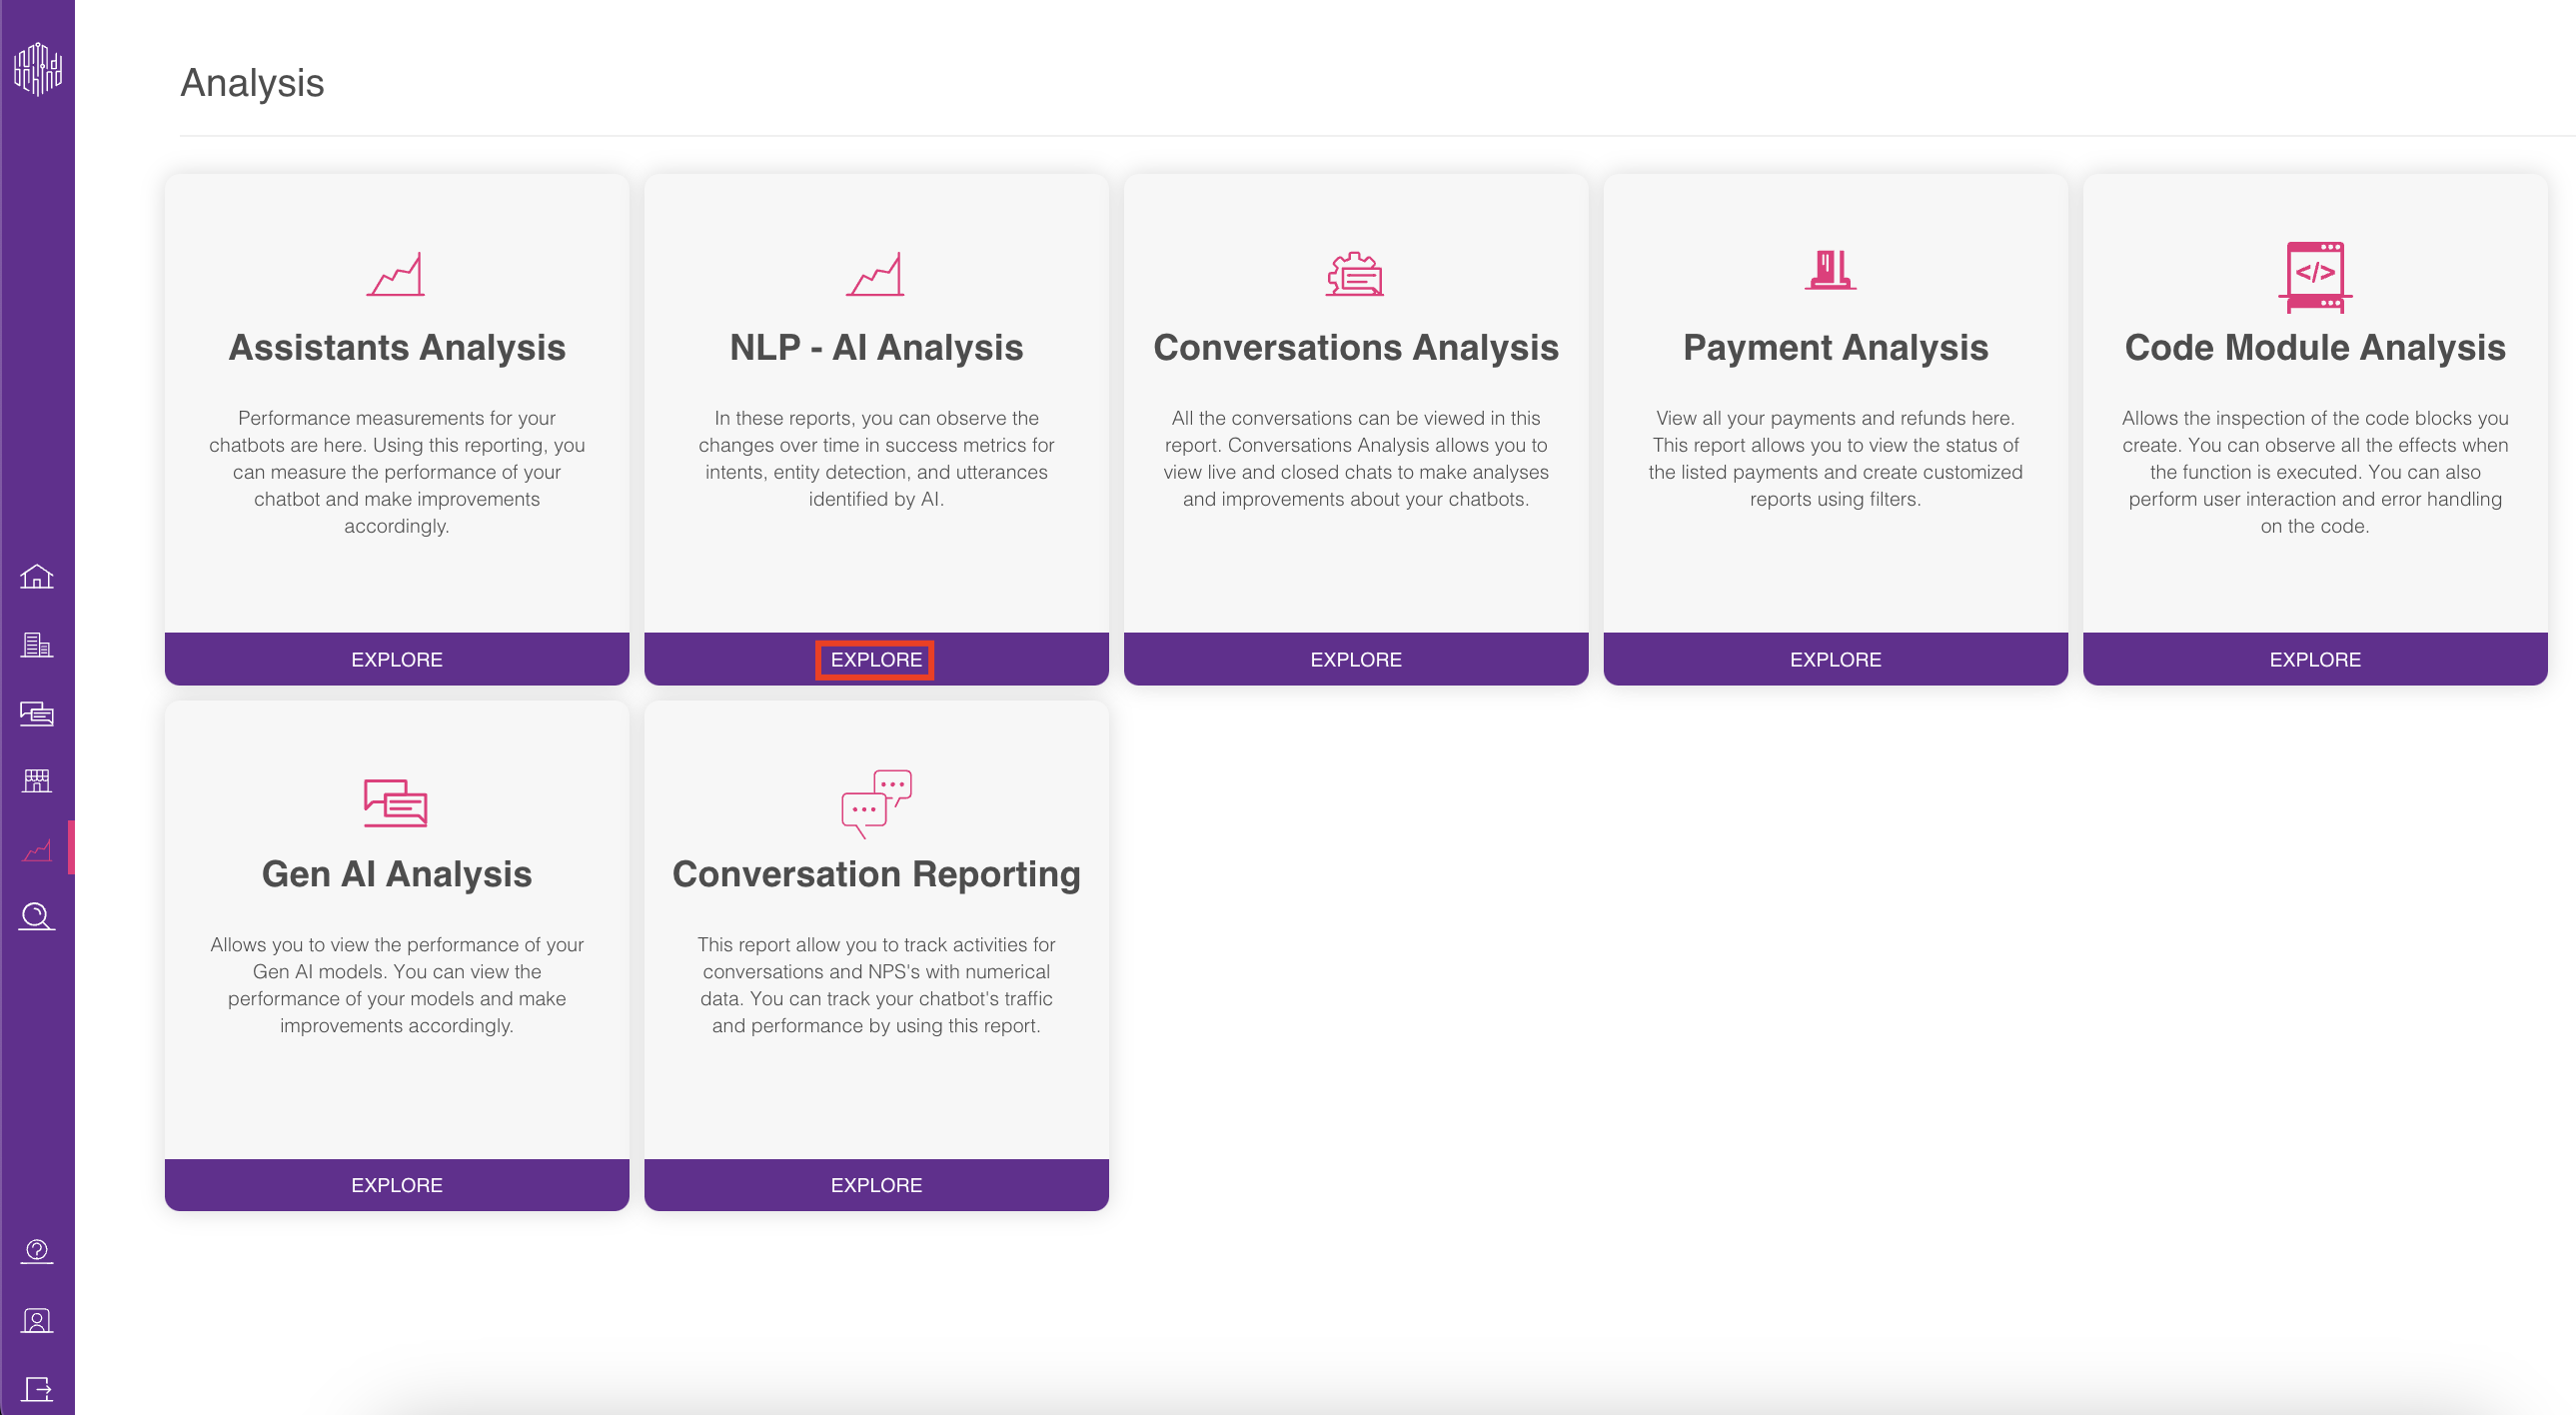
Filter results
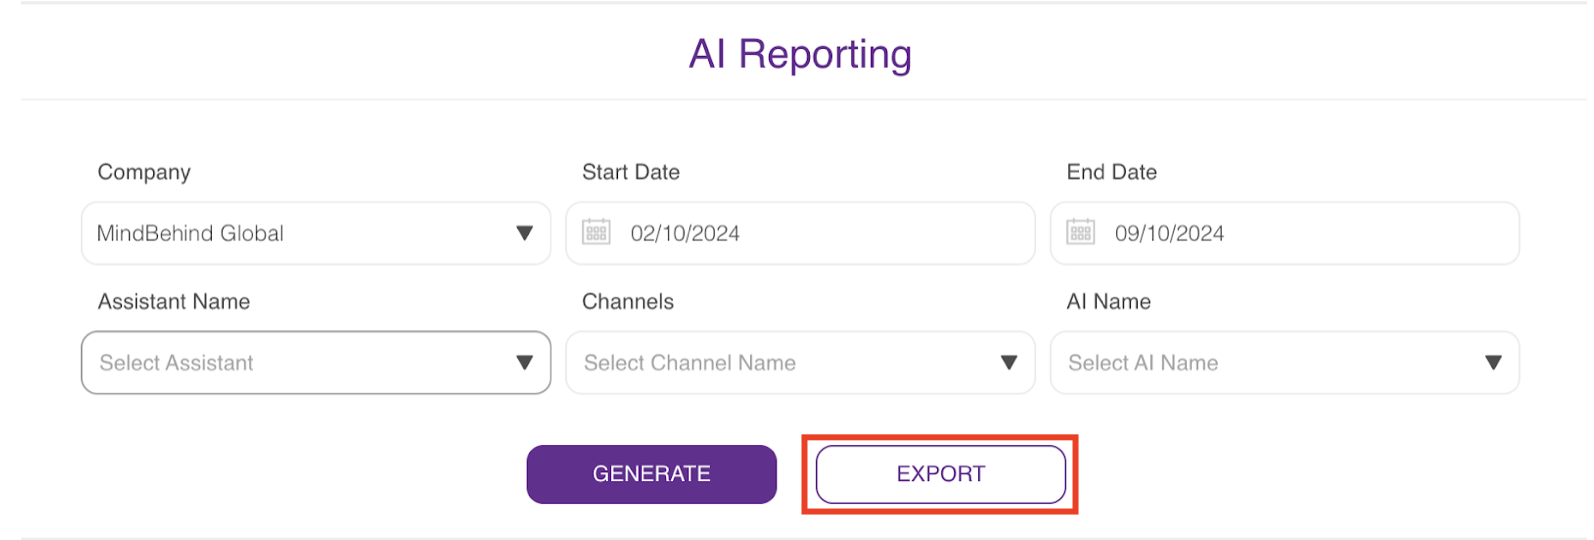
Filtering involves a set of rules designed to generate reports based on specified criteria. The available filtering options include Company name, Start and End dates, Assistant name, Channel name, and AI name.
Once you fill in the mandatory fields, the Generate button will become active. Click the Generate button.
Reports can only be generated for a period ranging from today to a maximum of two years ago.
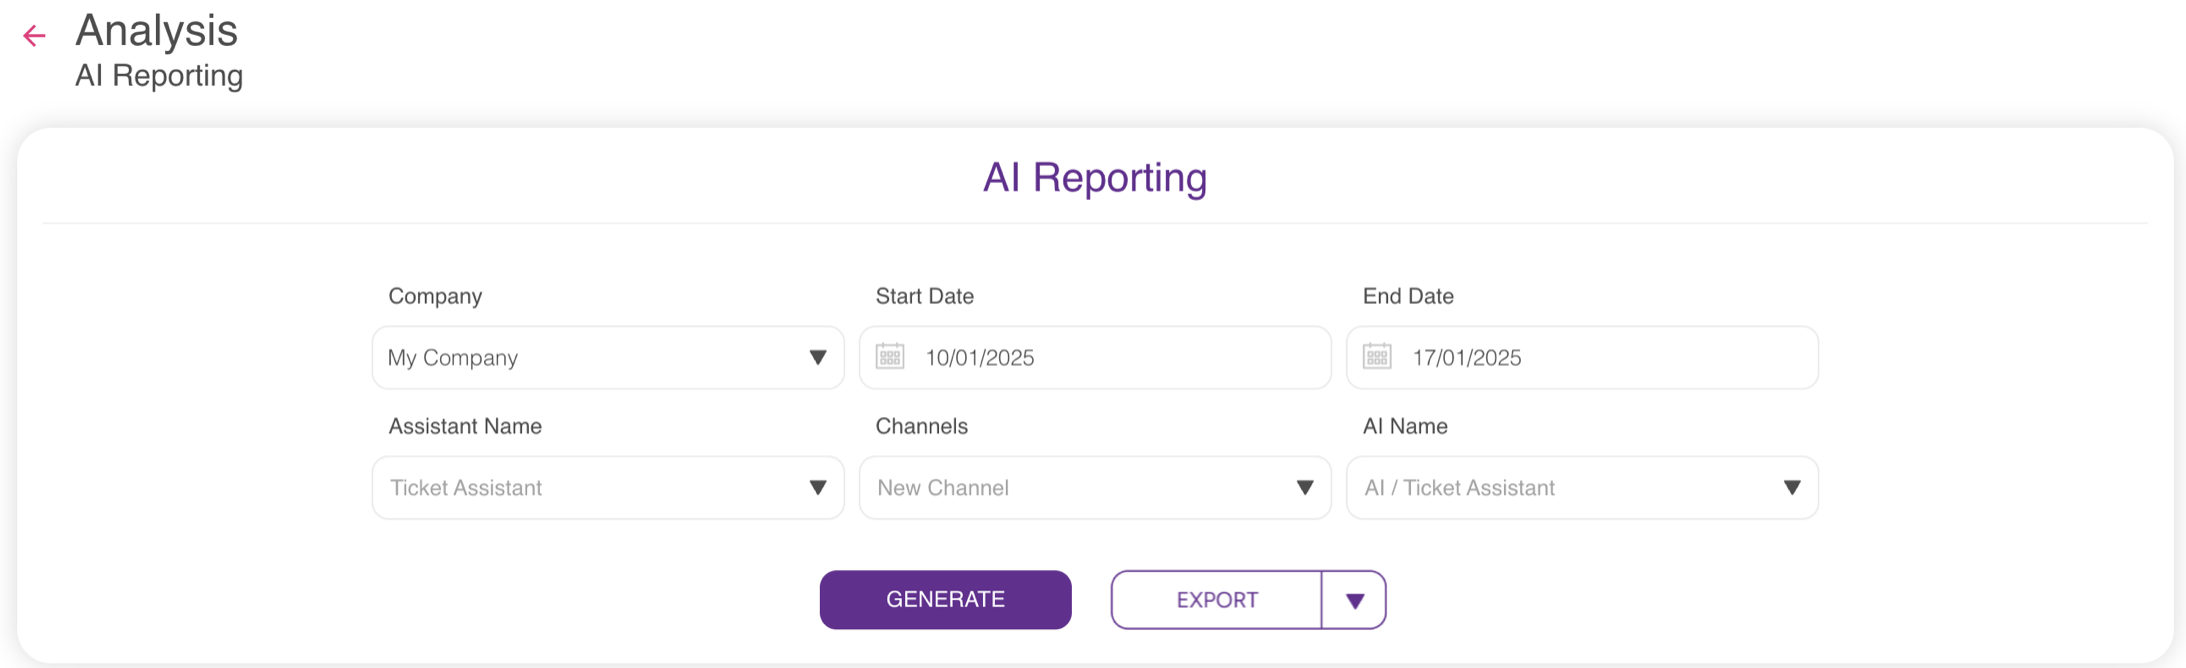
Company Name (Mandatory): It is the name of the company where the report will be generated. The company name can only be selected as a single value. You can only create reports from one company.
Start Date (Mandatory): This is the selected date when report generation begins in DD/MM/YYYY format. The start date must not be later than the end date.
End Date (Mandatory) This is the selected date when report generation ends in DD/MM/YYYY format. The end date must not be earlier than the start date.
Assistant Name (Optional): This selection allows you to specify assistant names for report generation. It is a multi-select component, and you can select multiple names.
Channel Name (Optional): This selection allows you to specify channel names for report generation. It is a multi-select component, and you can select multiple channel names.
AI Name (Optional): This selection allows users to specify AI names for report generation. It is a multi-select component, enabling users to choose multiple AI names. The AI models represent the company's integrated solutions, such as Dialogflow, CLU, or any other NLP system.
Graphs
You can access the analysis on unique users, AI conversations, AI messages, AI messages classification, AI reviewed messages, AI accuracy rate, and top intents in graphs to gain better insights on these topics.
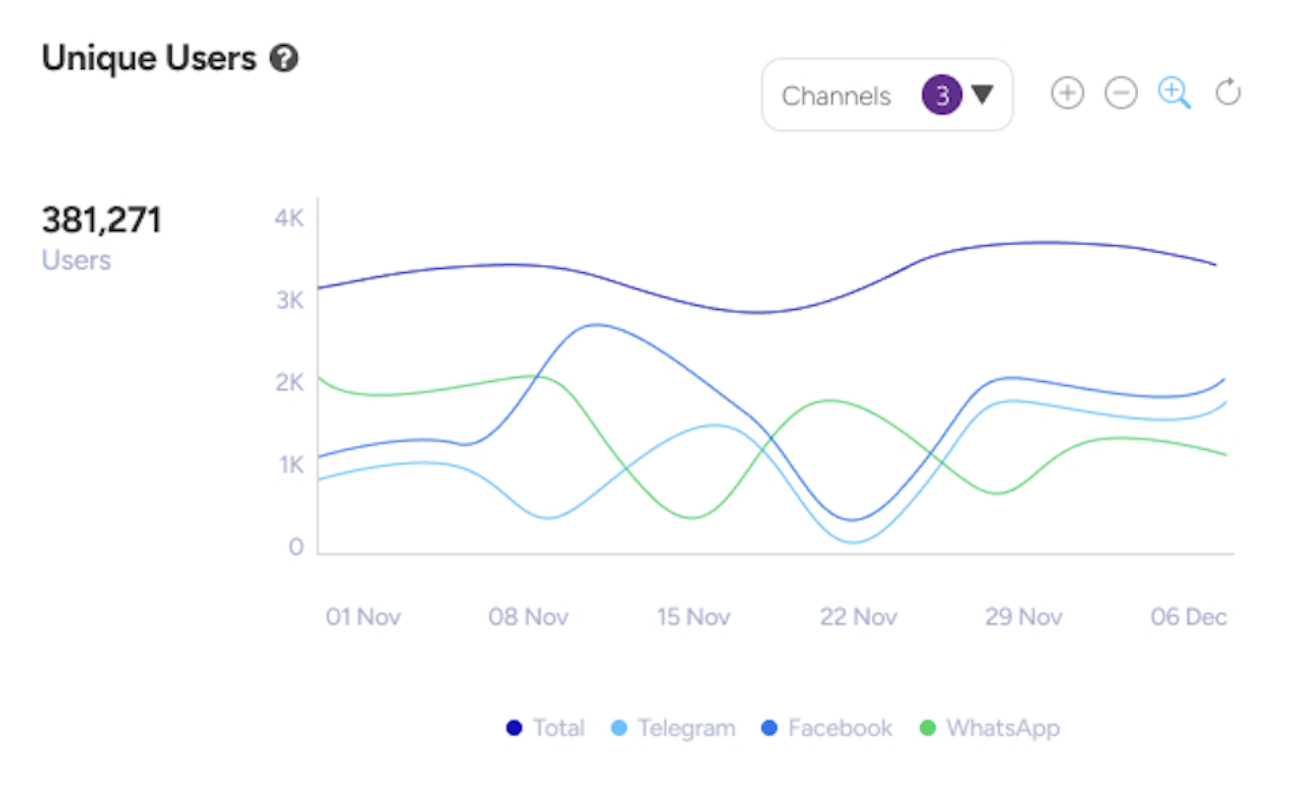
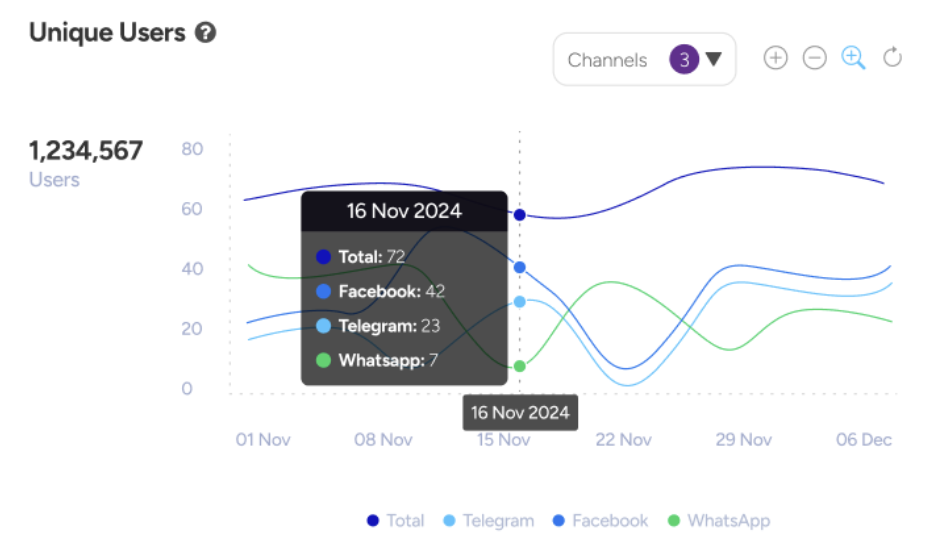
Unique Users
Unique Users refers to the distinct number of users directed to the AI Module. The graph also categorizes this data by channel type. The unique user IDs directed to the AI Module within the selected date range are counted.
AI Conversations
AI Conversations represent the total number of conversation sessions created within the AI Module. The graph also categorizes this data by channel types. It calculates the sum of all conversations initiated in the AI Module during the specified period.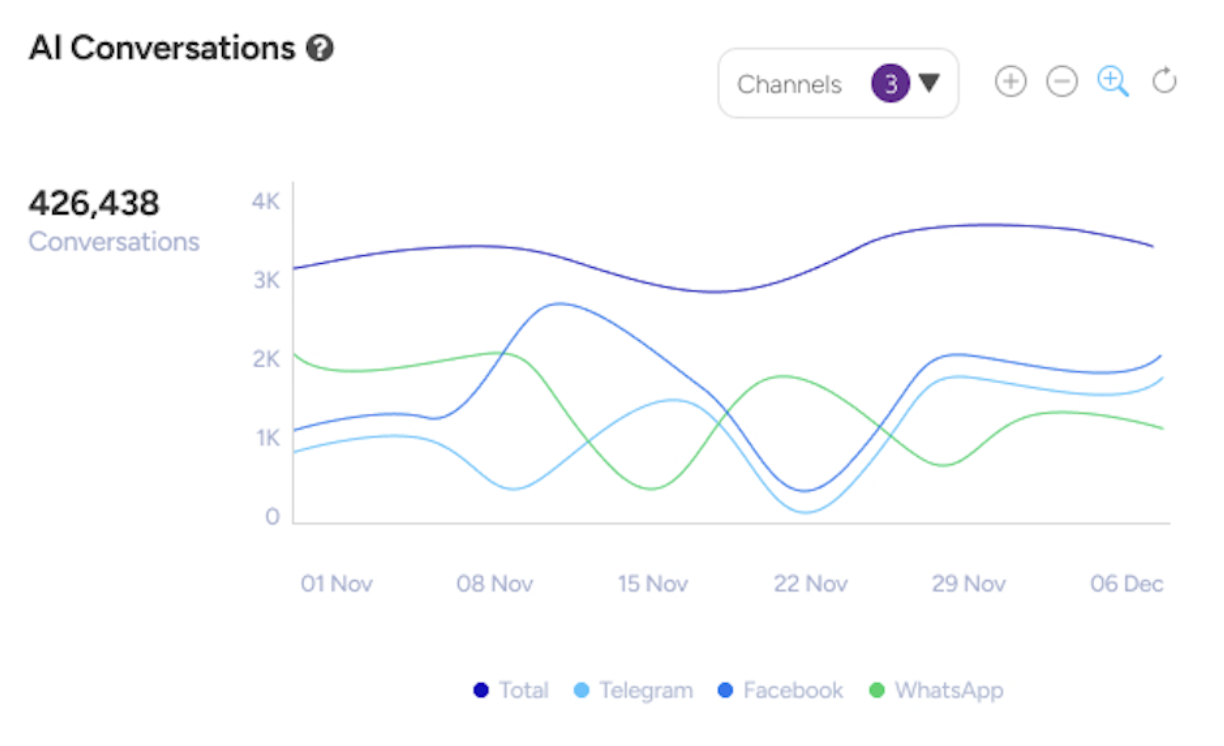
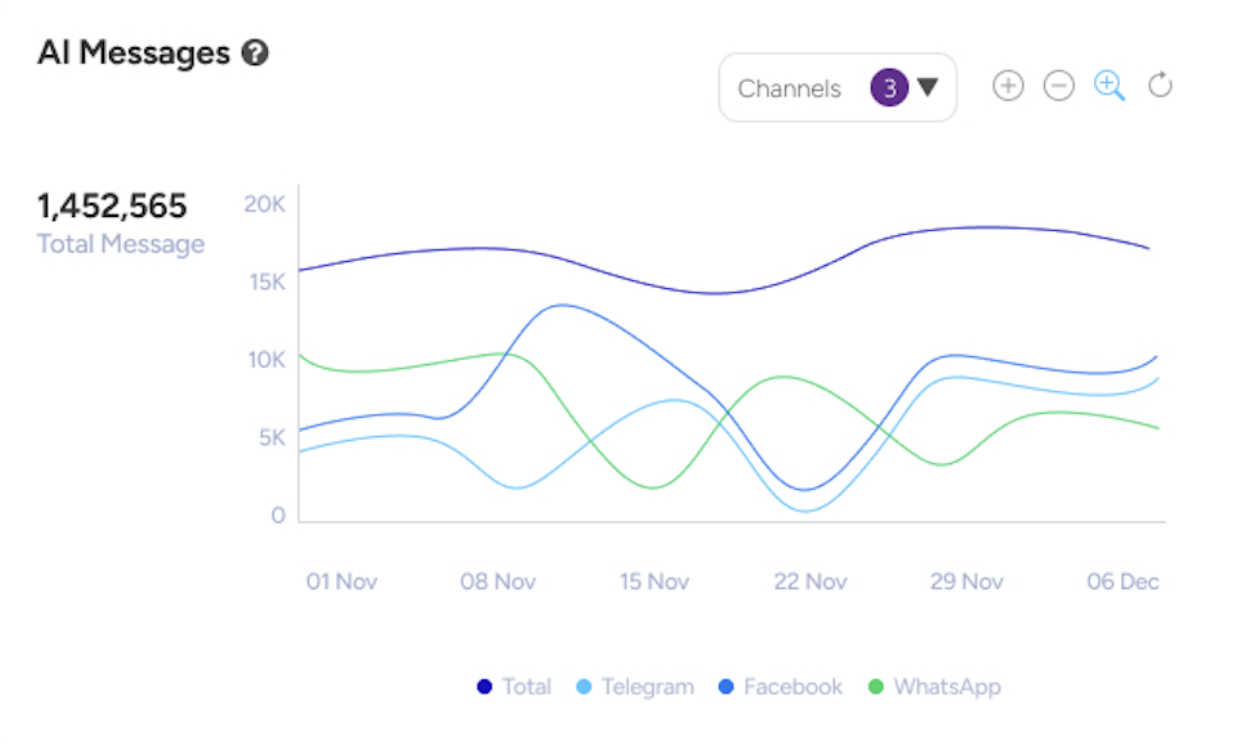
AI Messages
AI Messages represent the total number of interactions initiated when users are directed to the AI Module. Essentially, this reflects the number of AI calls triggered by user inputs. The graph further categorizes this data by channel types. It counts all instances where users are directed to the AI Module.
AI Messages Classification
The AI Messages Classification graph includes the total number of reviewed and unreviewed messages. Reviewed messages are those that have been evaluated and tagged by an AI conversation design expert. It categorizes and counts the total messages within the AI Module as either reviewed or unreviewed. 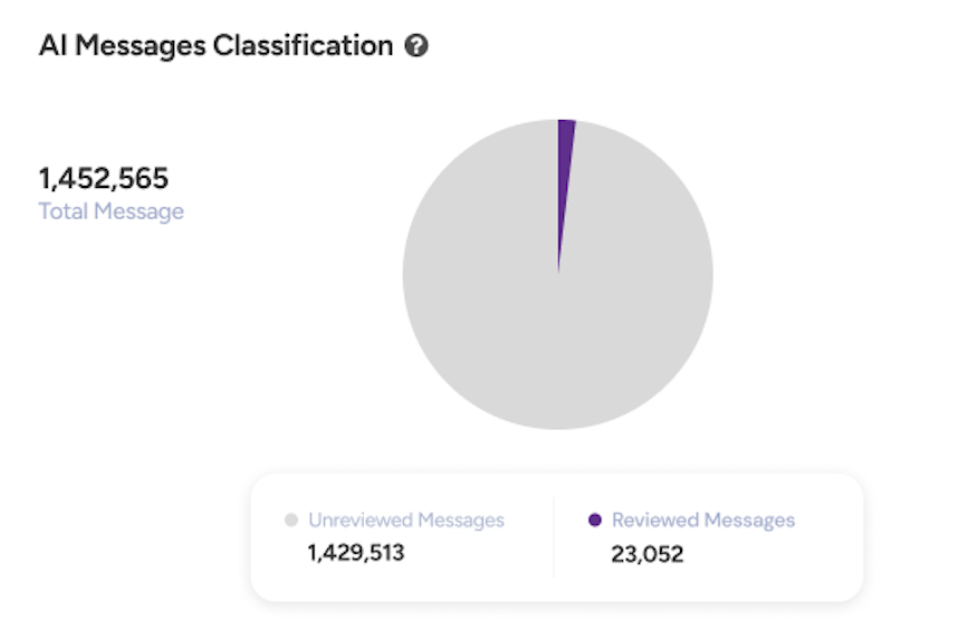
AI Reviewed Messages
Reviewed Messages Classification categorizes reviewed messages into identified, unidentified, true, false, and ignored. Reviewed messages are those evaluated and tagged by an AI conversation designer expert.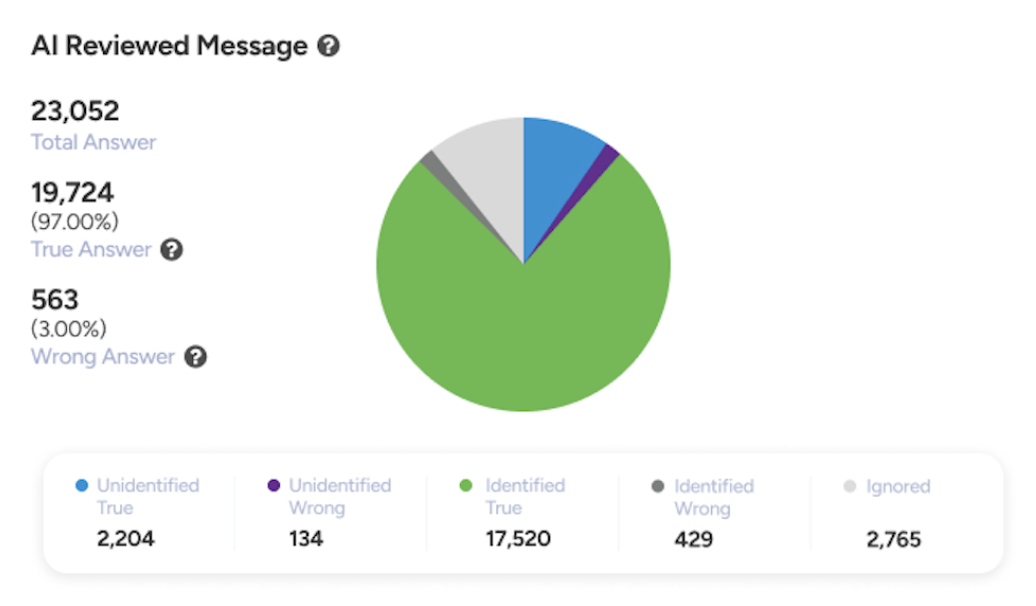
In this graph, you will see the following metrics:
Identified True: Messages correctly matched with an intent, representing the desired behavior of the AI.
Identified False: Messages incorrectly matched with an intent, representing undesired behavior of the AI. These messages are used to retrain the AI.
Unidentified True: Messages that have not been matched with an intent, which is the desired behavior of the AI. AI should not match an intent if the utterance is unrelated to any topic. Unidentified messages are directed to fallback, as there is no matching intent.
Unidentified False: Messages that have not been matched with an intent but should have been. This represents undesired behavior, as the AI should match an intent if the utterance is related to the topic. Unidentified messages go into fallback due to the lack of a matched intent. AI conversation experts retrain these unidentified false messages to ensure proper coverage in the future.
Ignored: Messages that the AI should not process, as they are outside the scope of its intended topics. Ignored messages are excluded from AI success rate calculations.
True Answer: The sum of Identified True and Unidentified True messages, representing instances where the AI behaved as desired.
False Answer: The sum of Identified False and Unidentified False messages, representing instances where the AI behaved undesirably.
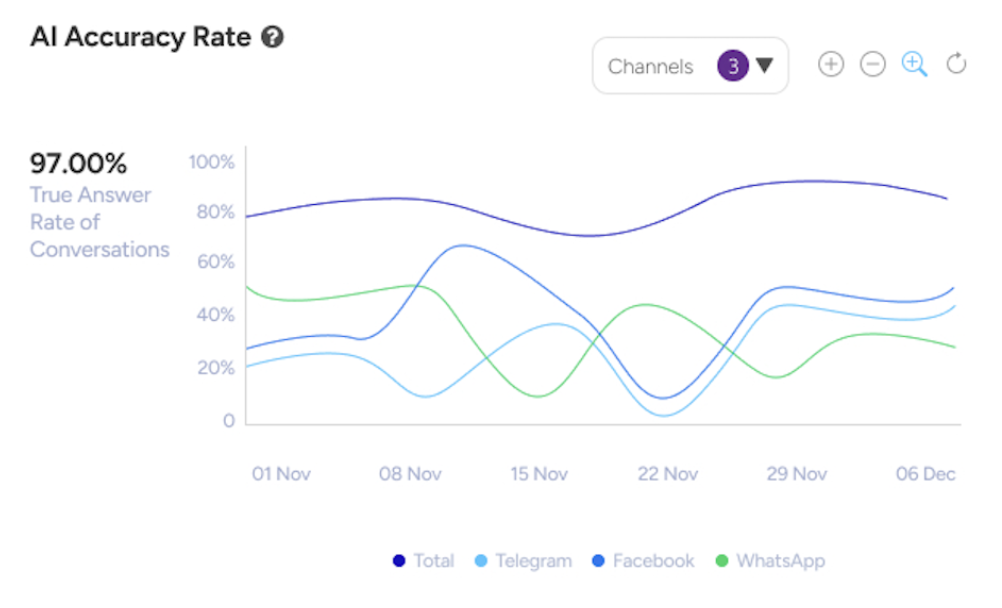
AI Accuracy Rate
AI Accuracy Rate measures the percentage of AI messages that meet customer needs and receive high ratings within the selected period. It calculates the sum of Identified True and Unidentified True messages, divided into all AI messages except ignored ones.
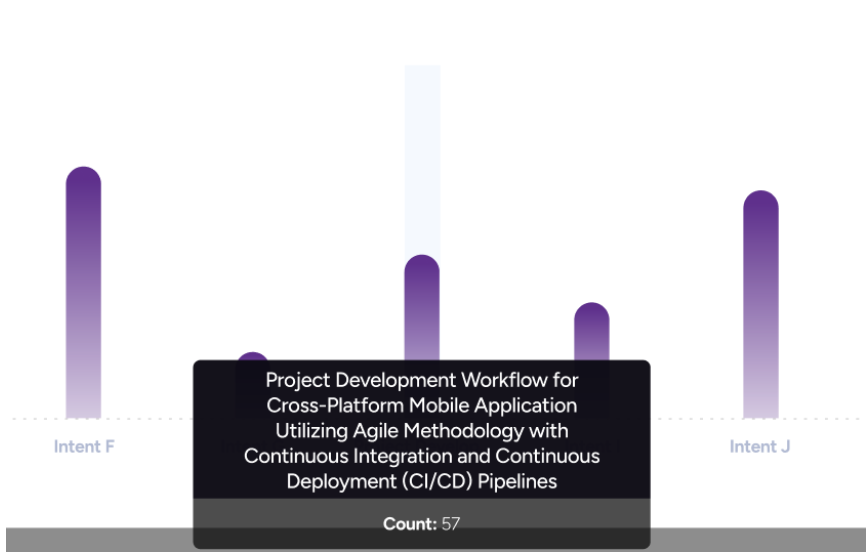
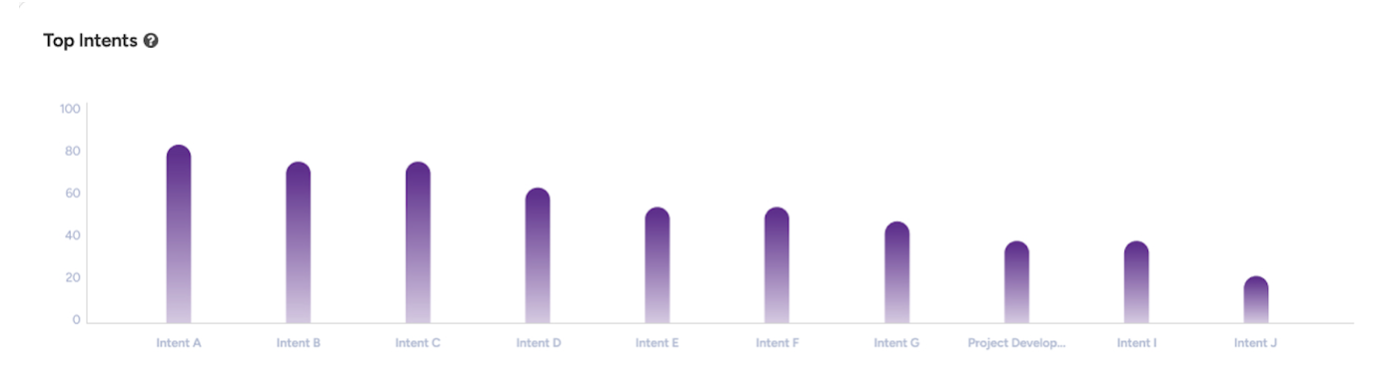
Top Intents
Top Intents highlights the 10 most popular data insights, helping to identify user intents based on their utterances during conversations. It analyzes and ranks intents from user utterances, displaying the top 10 based on frequency of occurrence.
Export XLS Raw Data
The XLS Export feature provides raw data generated from reports. Once the report is generated, the export button will be enabled. Once clicked, you will receive an email with a link to download the raw data.
Each row in the report represents a single AI message, indicating whether it matches an intent or not.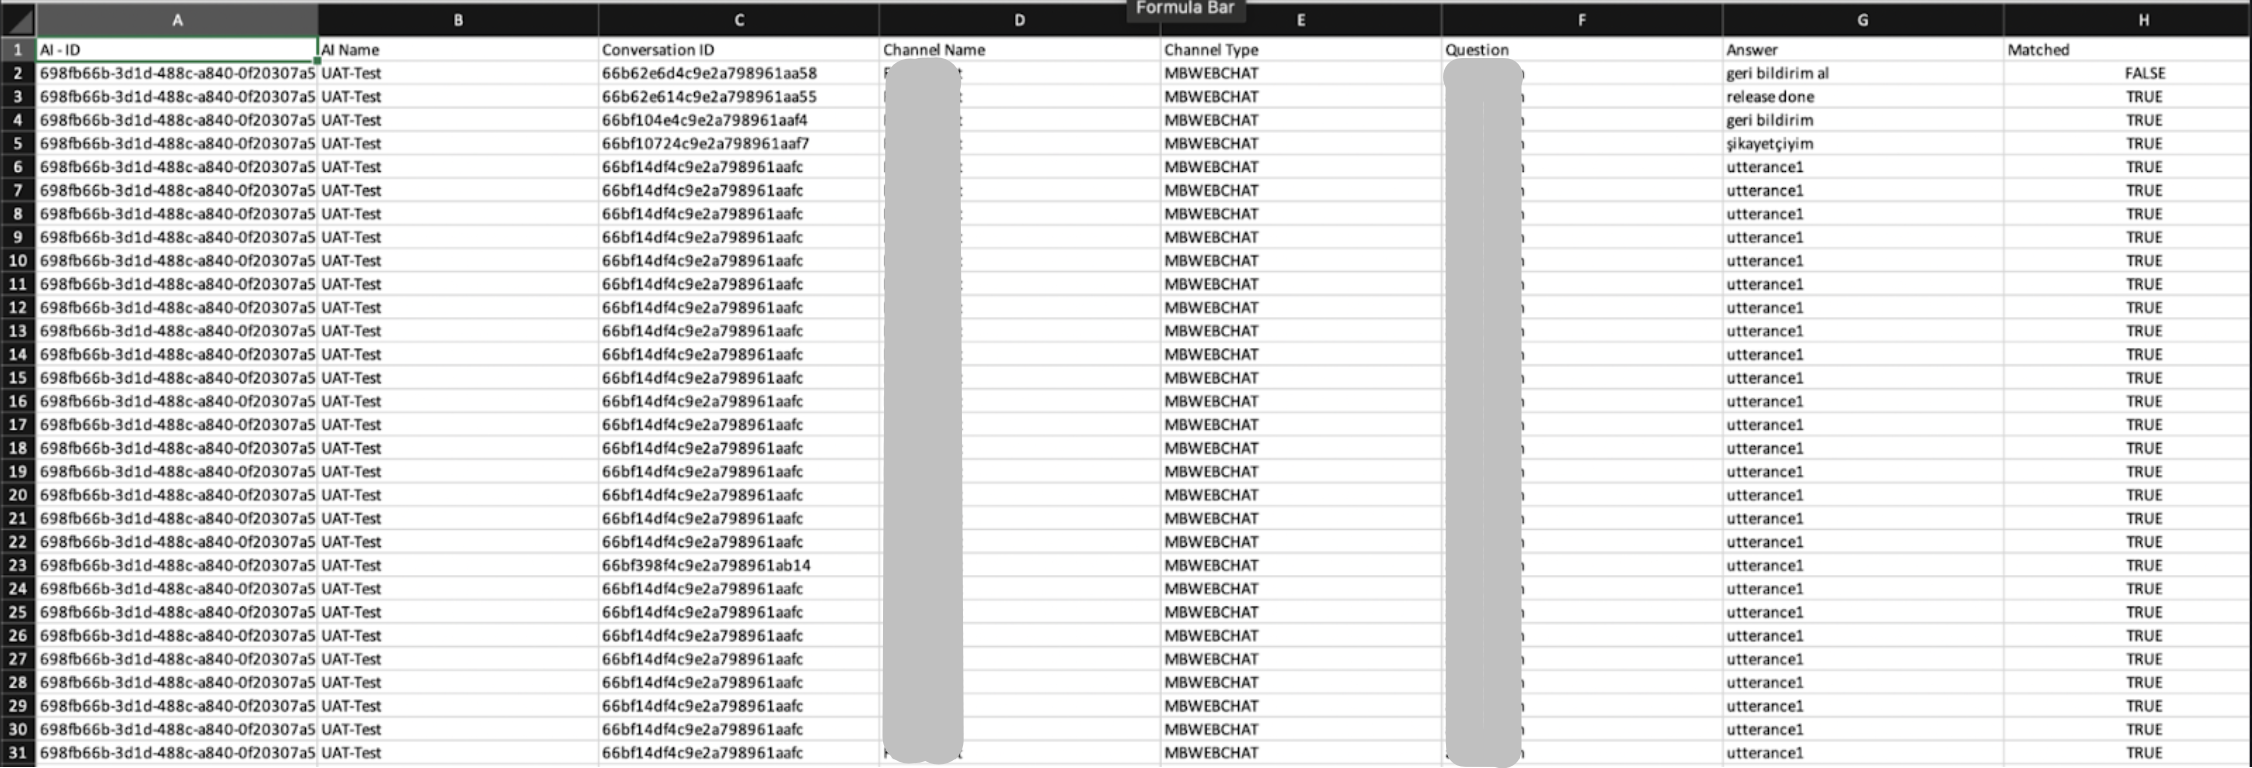
Additionally, the XLS report includes an extra sheet designed to reduce calculation time for intent detection ratios. This is a supplementary sheet within the downloaded file. 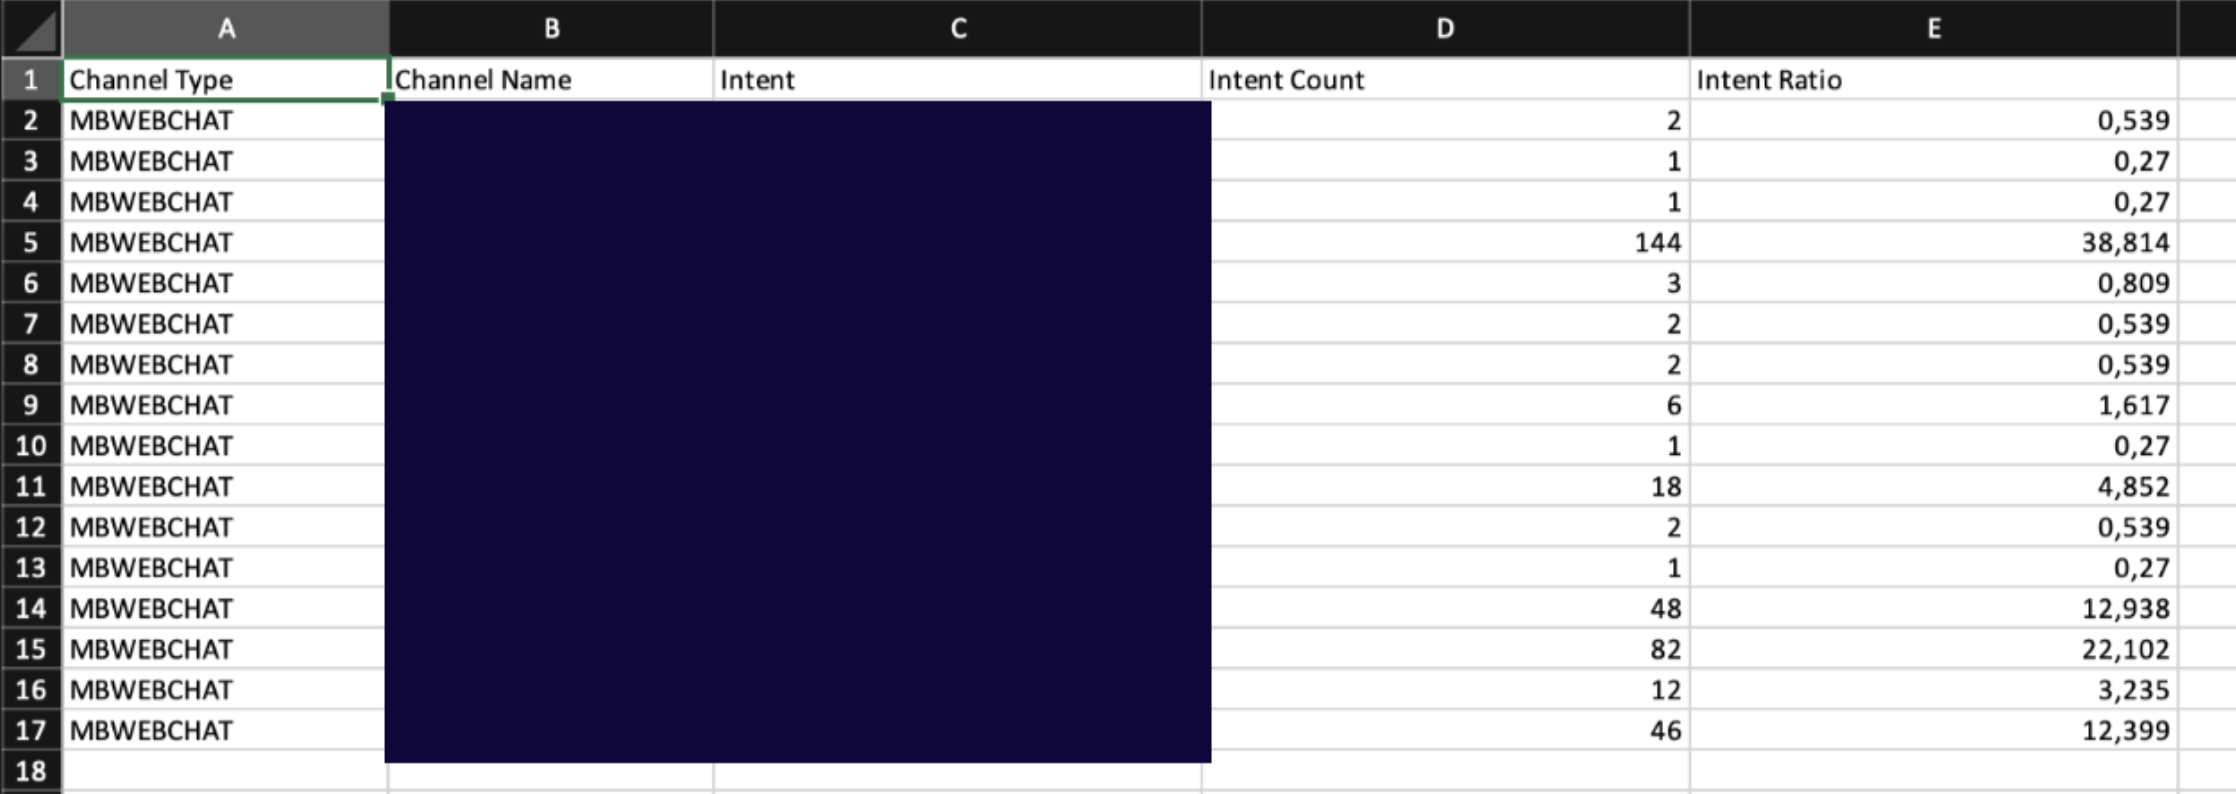
Graph Displaying Options
You have various display options for different charts in the graphs. These charts are:
Line Chart
Pie Chart
Column Chart
Line Chart
In the line charts,
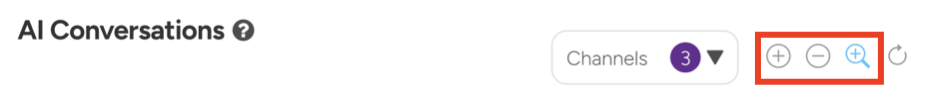
You can use the buttons on the top right of the line charts to zoom in and out. You can click the Refresh icon to see the initially generated version of the graph.
It is not possible to zoom into daily views since MindBehind does not support the hourly displayed data format.
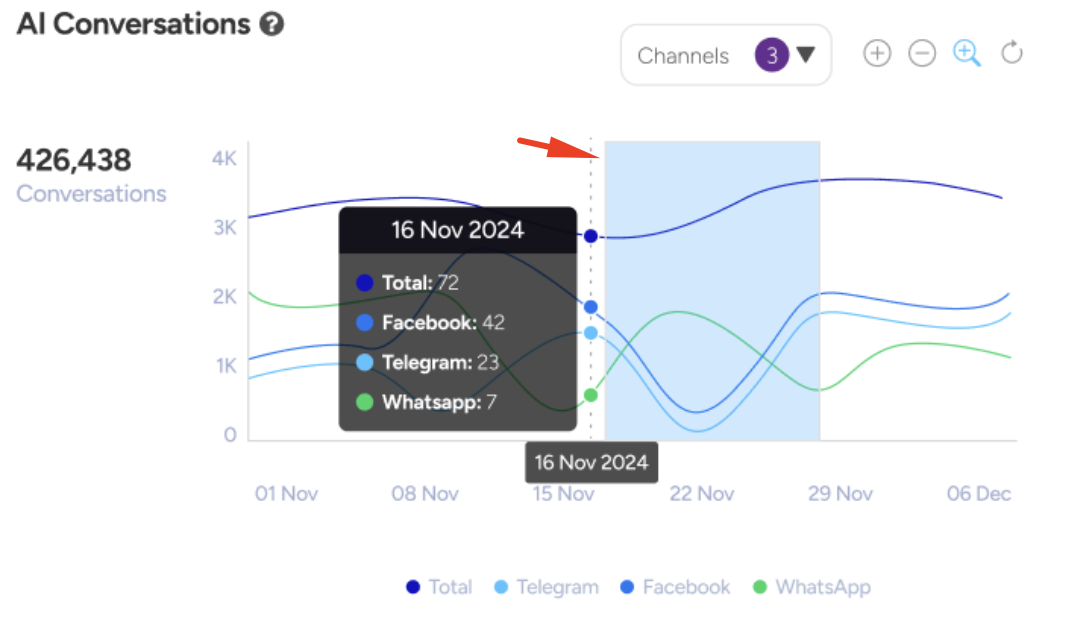
You can scan a specific area on the graph with your mouse to zoom in.
You can select and deselect channel types in the Channels dropdown list in line charts to better understand the changes in the values across channel types.
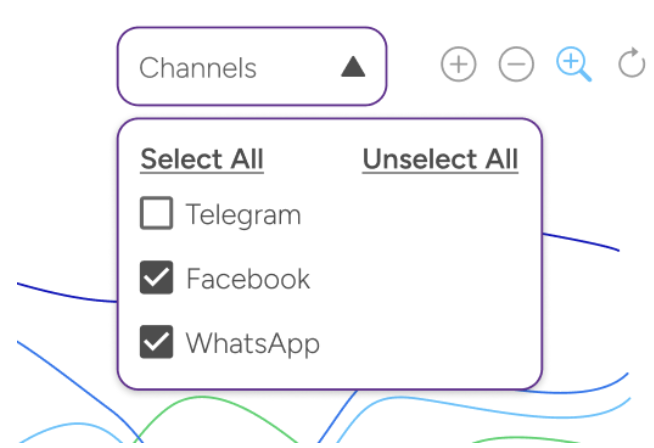
You can also use the buttons below the chart to select and deselect channel types.
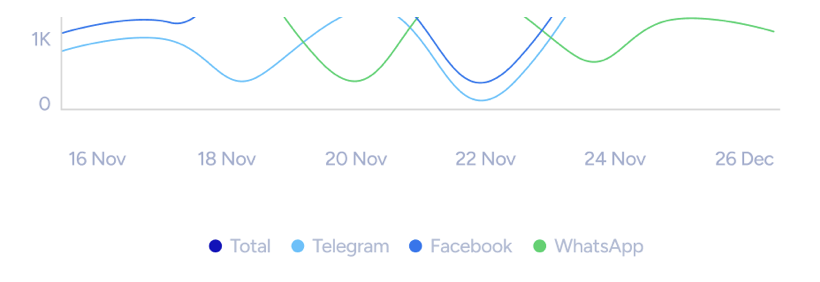
You can hover over the line charts to see the daily graph details across channels.
Pie Chart
To see the ratios of the displayed values on the pie charts, you can hover over the related field of the graph.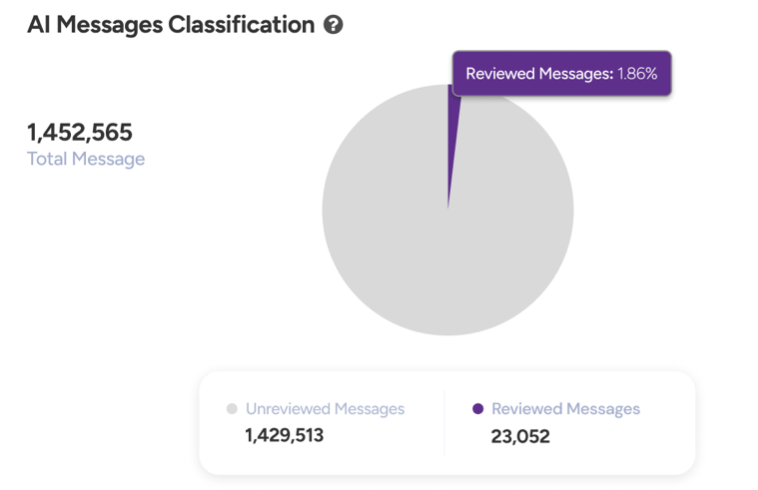
Column Chart
You can hover over the intent columns on the column charts to display the extended version of intent names and the number of their triggers.