Suggested reading: Event vs. Attribute
You can use the Attributes and Events page if you want to:
Insert a custom attribute, event, or event parameter through the InOne panel.
To verify the data after pushing events, attributes, or parameters data using any Insider One API.
To understand the trend of attributes, events, and/or event parameters' data ingestion with the ability to break the data down by its source and view it on a daily, weekly, and monthly basis.
Verify available customer attributes for mapping purposes while uploading a Static or First-Party segment.
Edit the details of any of the previously created attributes, events, or event parameters.
Pause or unpause the ingestion of data for an attribute, an event, or an event parameter.
Check your current usage of custom attributes or custom event parameters against your current panel allowance.
To access the Attributes and Events page, navigate to Components > Attributes and Events.
What are the attributes?
Attributes are properties or characteristics that describe an entity. In the context of user data, attributes typically describe users, products, or any other entities being tracked. Some attribute examples are:
Age
Gender
Location
User ID
Account creation date
Subscription type
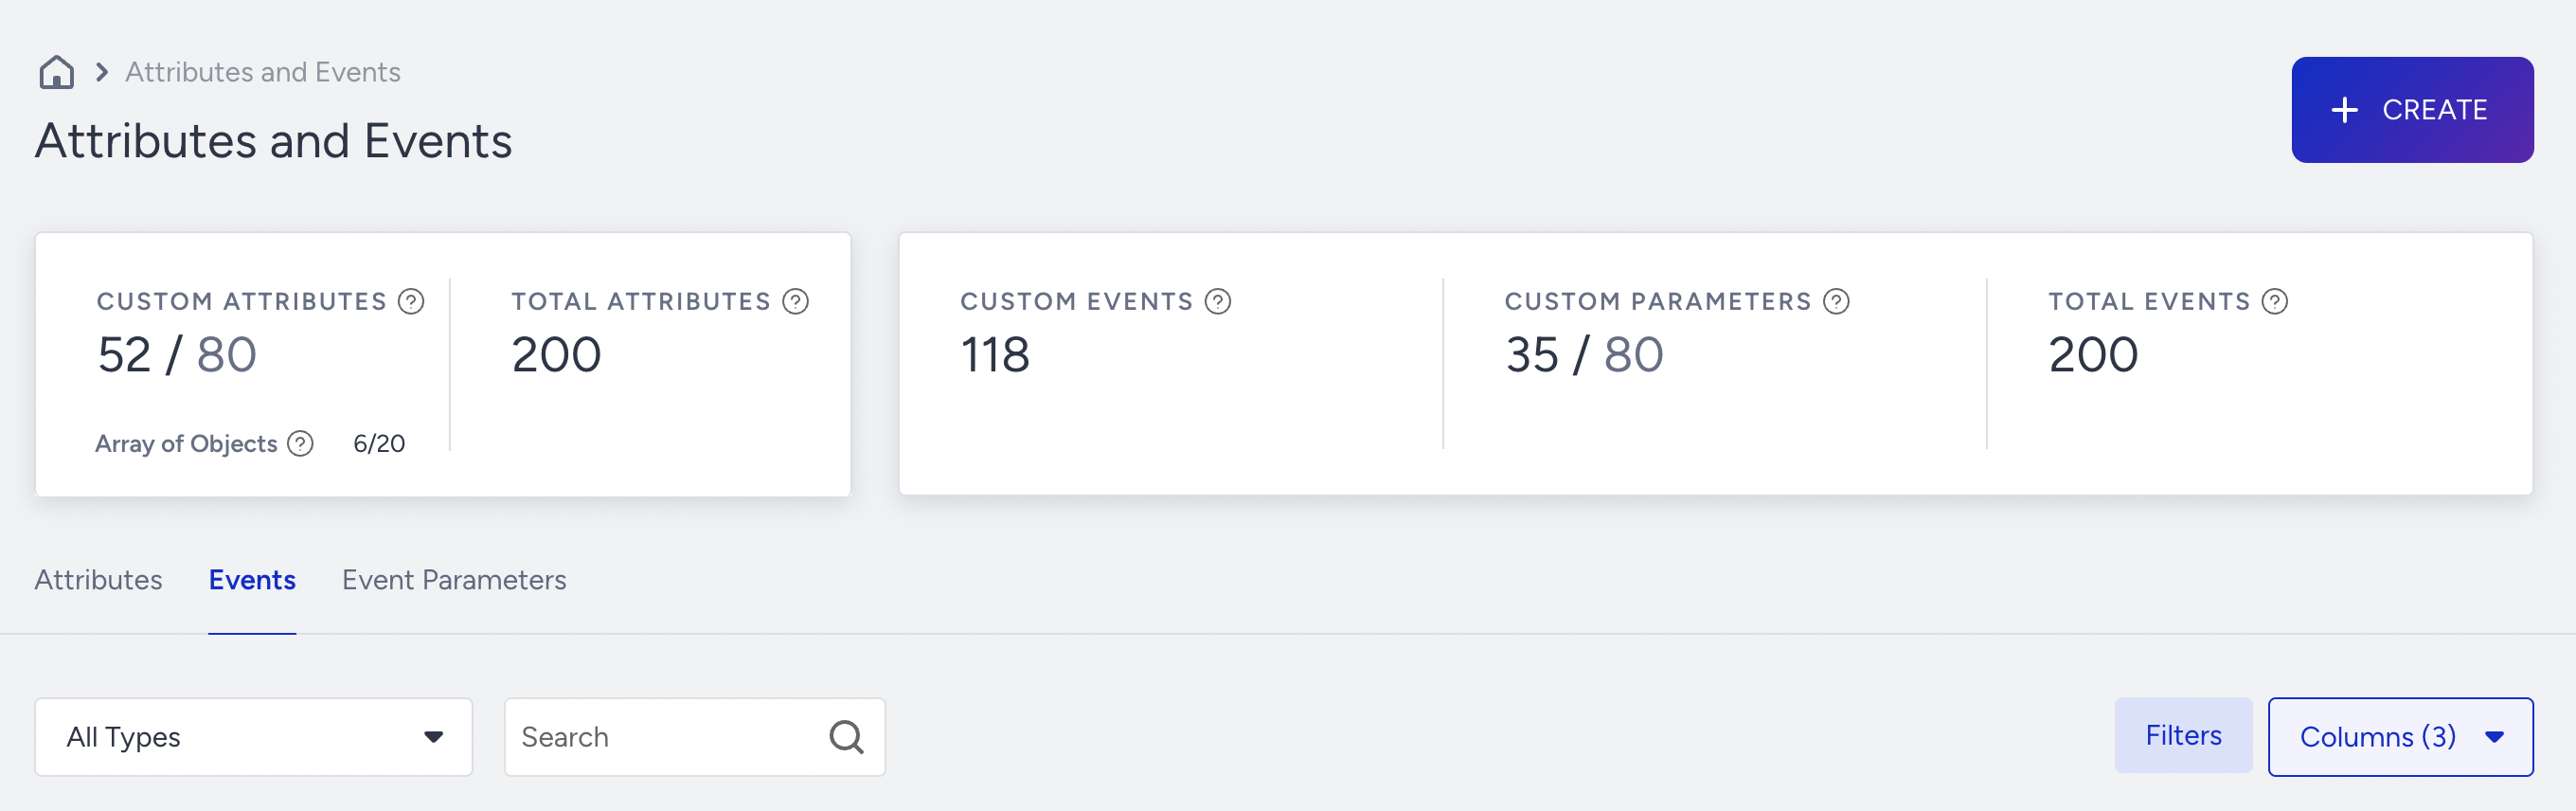
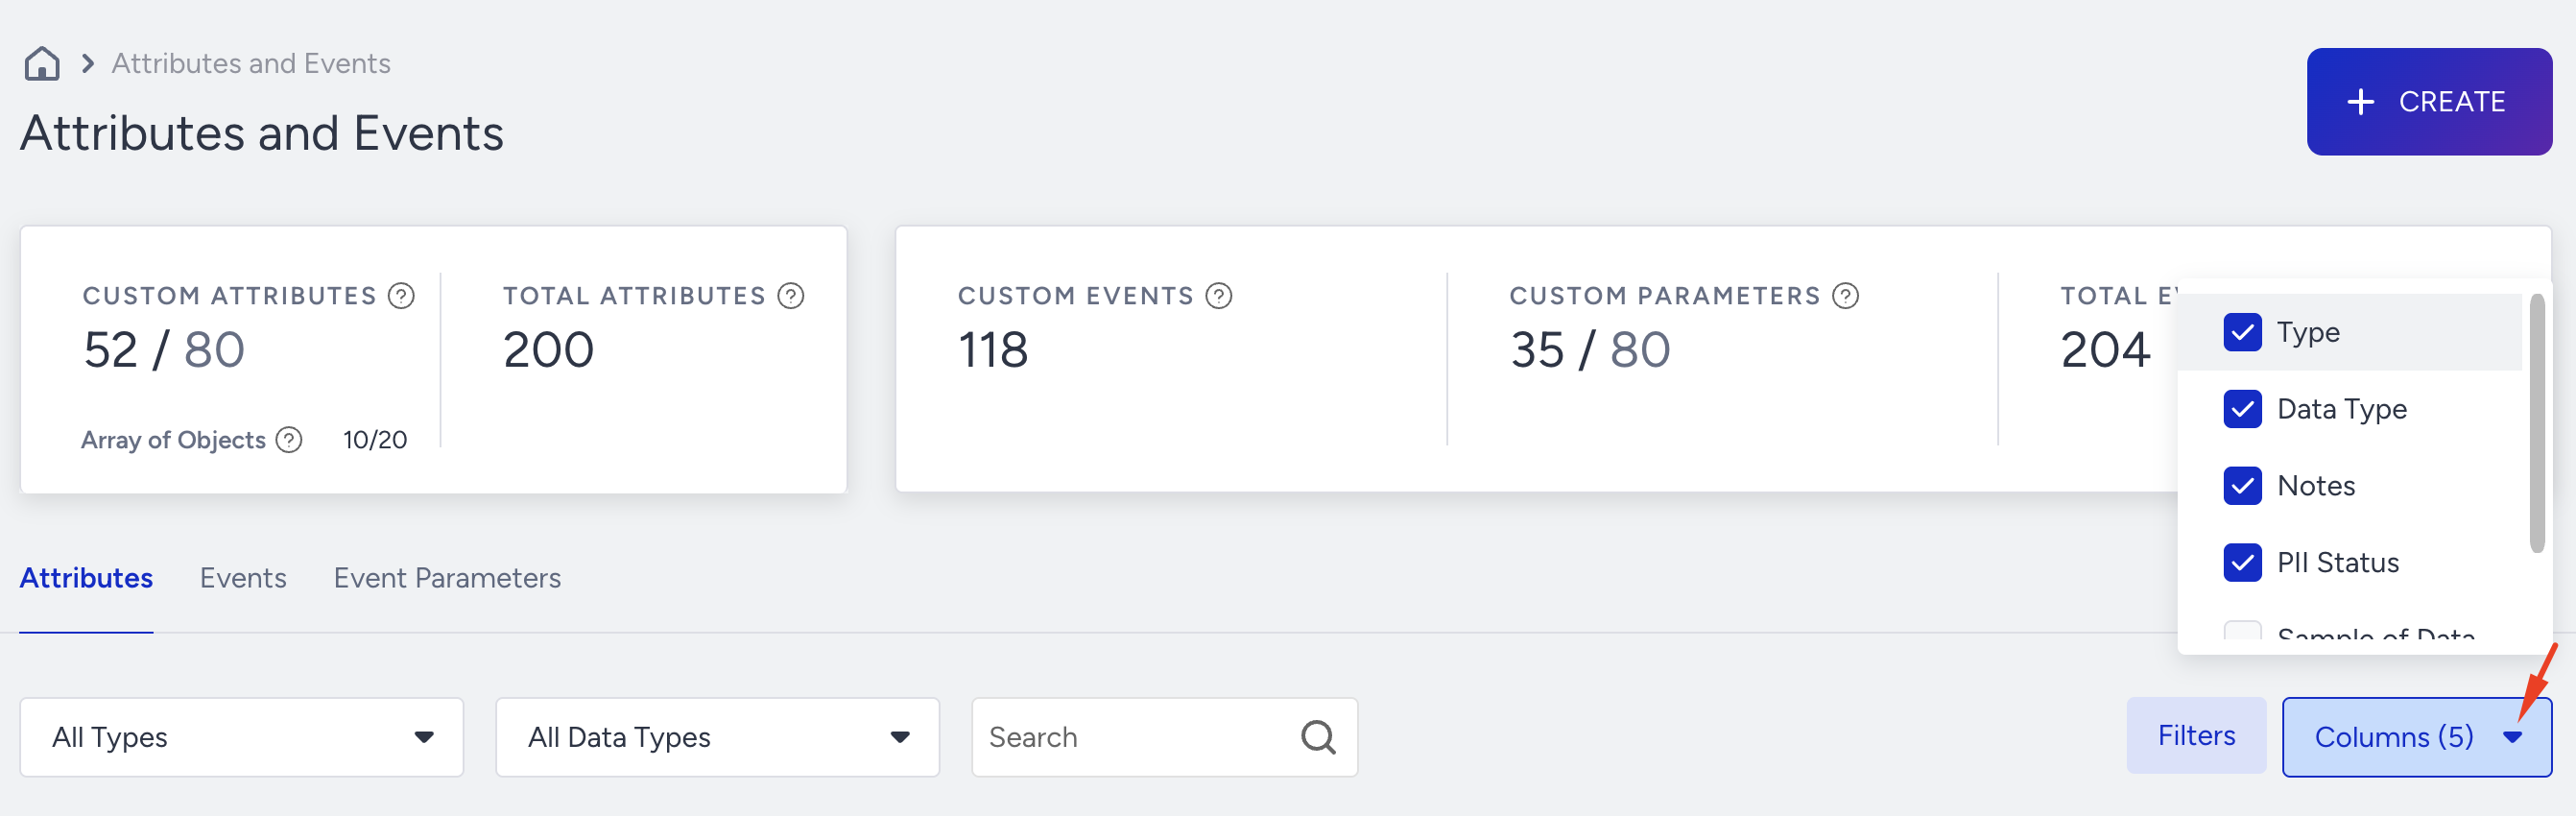
What are the attribute limits?
Landing on this page, you can see the limit for custom attributes and parameters, how many there are, and the number of attributes. You can have up to 80 custom attributes (excluding default attributes) by default. This includes all custom attributes from the mobile application, website integration, CRM integration, and email custom fields.

The total limit for custom attributes and event parameters varies by account.
What are the events?
Events are actions or occurrences that happen over time and can be tracked. These events are typically tied to user interactions with a product or service, providing valuable data on user behavior and engagement. Some event examples are:
Page views
Button clicks
Product purchases
Form submissions
Video plays
What are the event limits?
No limit is applied to the number of events. However, event parameters are limited. You can create up to 80 custom event parameters (excluding default ones). Multiple events can share the same parameters, and each event can include multiple parameters.
Note that 1 parameter name across different events counts toward 1 limit.
Example: You have an event parameter called store name, and you have 3 events:
Event A - Purchase, Event B - Add to Cart, Event C - Product Viewed
Event Parameter = Store name
This parameter will consume 1/80 of the limit, even though it is used in multiple events.
What are the event parameters?
Event parameters provide additional data for events recorded in Insider One systems. In the context of user data, event parameters are usually used to better describe an event.
Examples of Event Parameters:
Product Name is an event parameter that helps describe the Item Added to Wishlist event, as it brings information regarding what the product is related to the 'Item Added to Wishlist' event.
Reason is an event parameter that helps explain an Email Bounce event, as it provides information about why the email bounced.
Variant ID is an event parameter that describes an App Push Open event and provides information about the campaign variant the user saw.
The Attributes and Events page
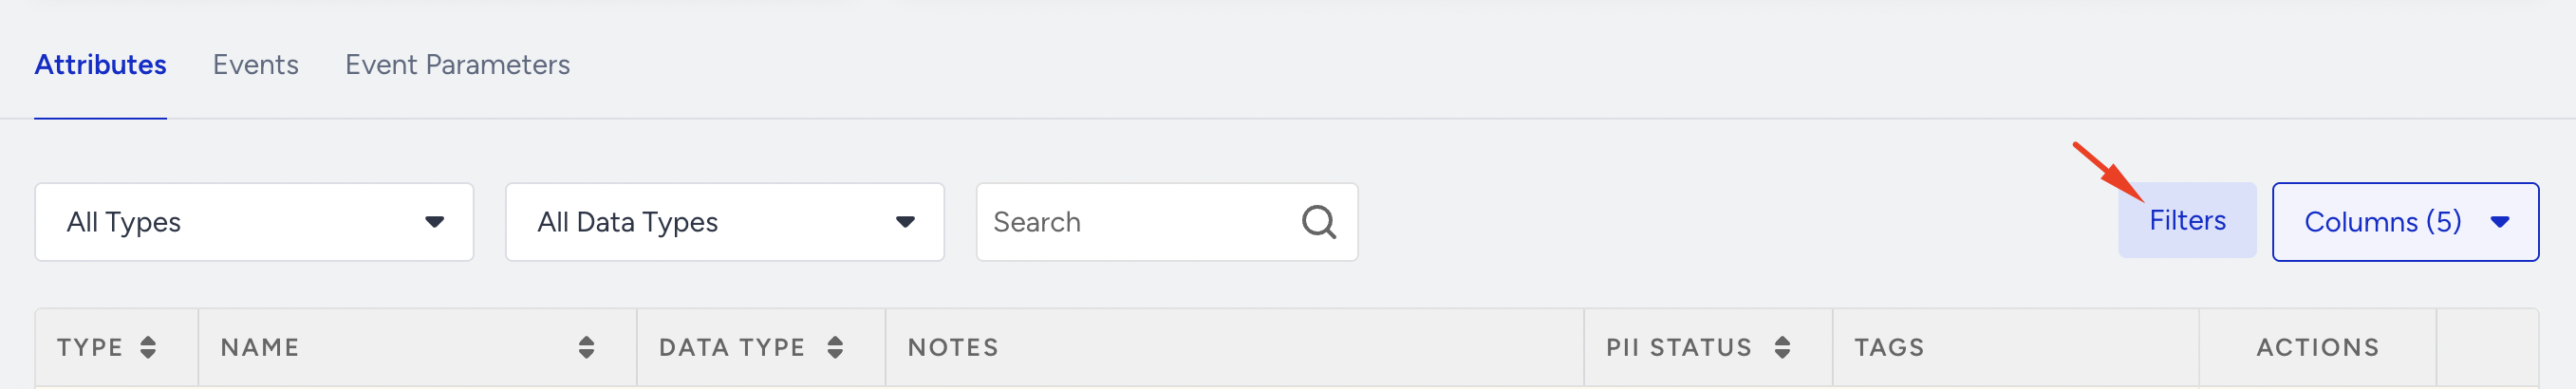
You can easily switch between events and attributes using the tabs at the top.
You can filter listed attributes based on their types, data types, or the keyword you enter in the Search bar.
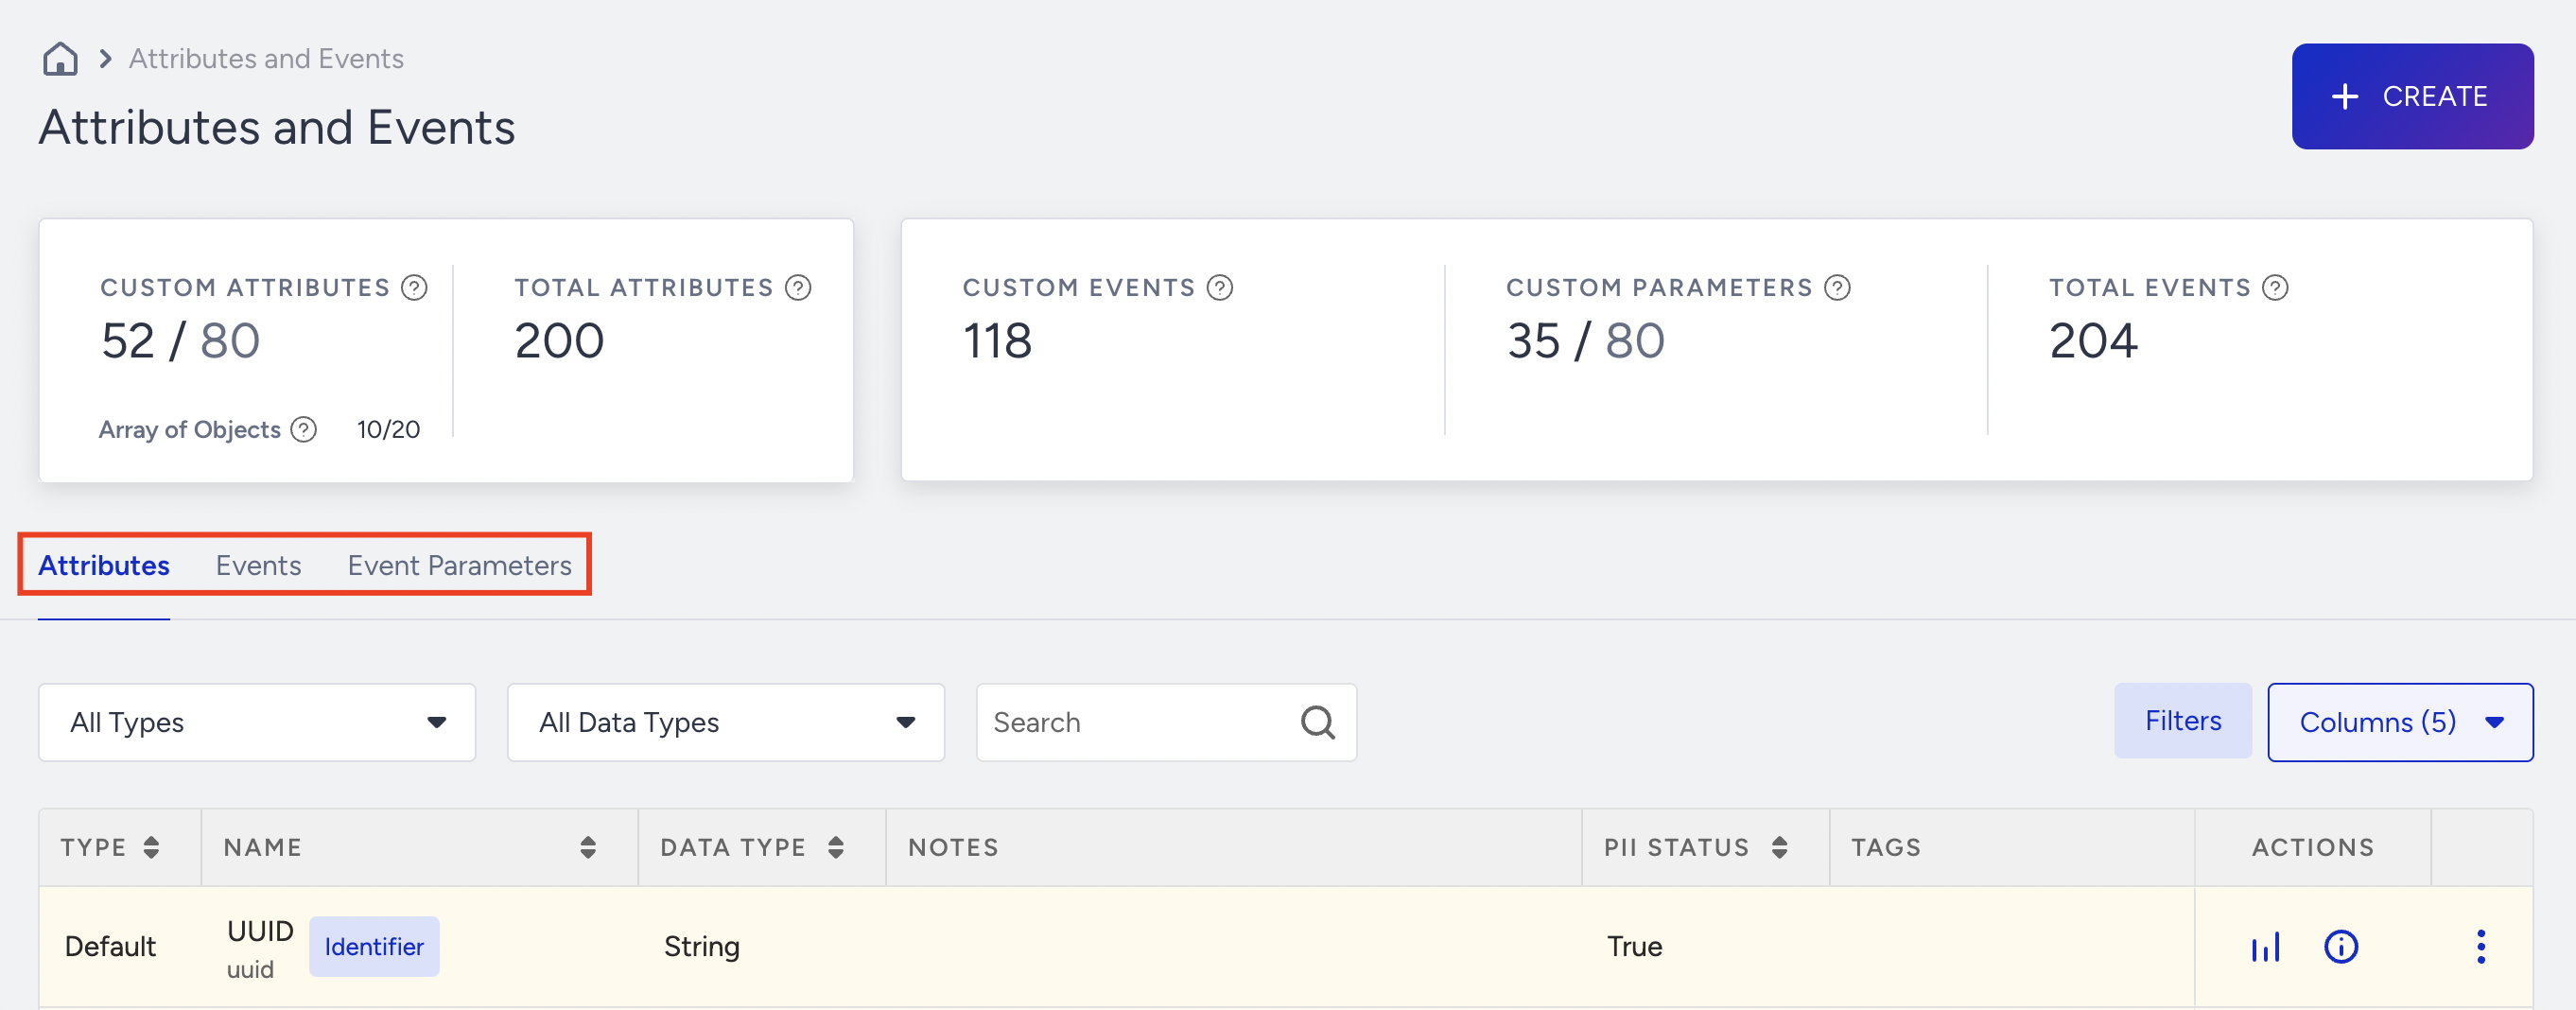
This listing page displays attributes along with the following information:
Type: Displays if it is a custom or default attribute. Custom attributes are automatically collected, while custom ones need to be fired by you.
Name: Displays the name of the attribute
The first line item shows the Display Name (Example: Device Model). It’s the Human-Friendly Name you use as a Label in Segmentation; you can change it.
The second line item displays the System Name (Example: mo). It’s the technical name defined during data creation. Once you have defined the system name, you cannot change it.
Data type: Displays the value type (e.g., Array of Objects, Boolean, String, String Array, Date, Number, Number Array, URL)
Notes: Displays the notes written while creating.
PII Status: This is a boolean value that signifies whether a specific attribute is a Personally Identifiable Information. It’s important to note that panel users with PII Access: False will be unable to view this information (in User Profiles, etc.).
Tags: Display the tags assigned to find, filter, and group attributes.
Actions: You can take two actions per data point: Overview and Information.
Overview: This page lets you see the total count of data ingested, as well as the trendline for the collection of the attribute/event/parameter being examined.
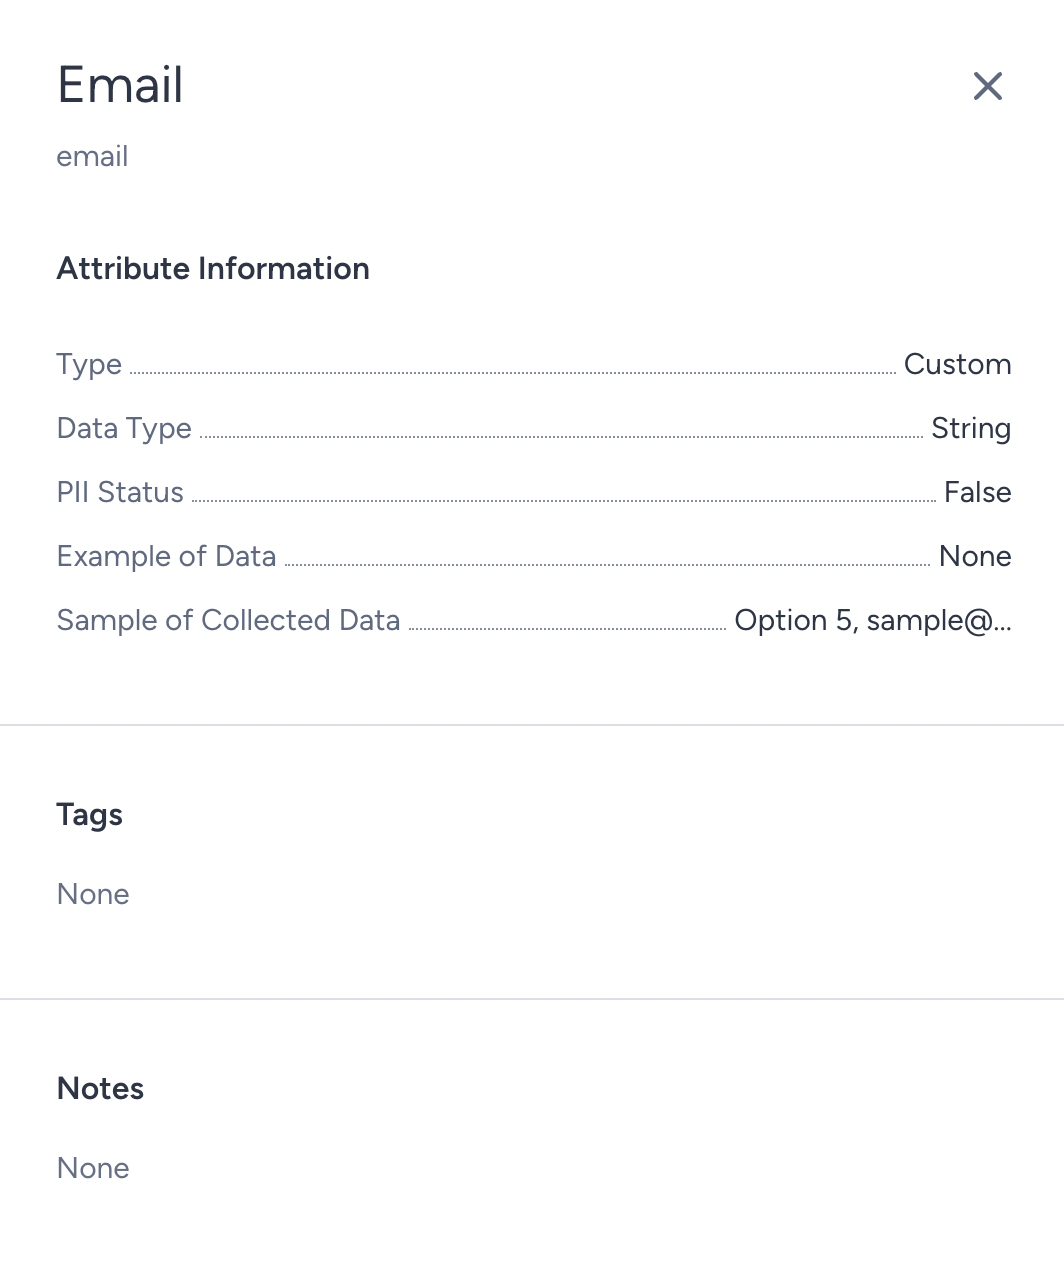
Information: Via this button, you can access all the details and information about your currently selected attribute, event, or parameter:
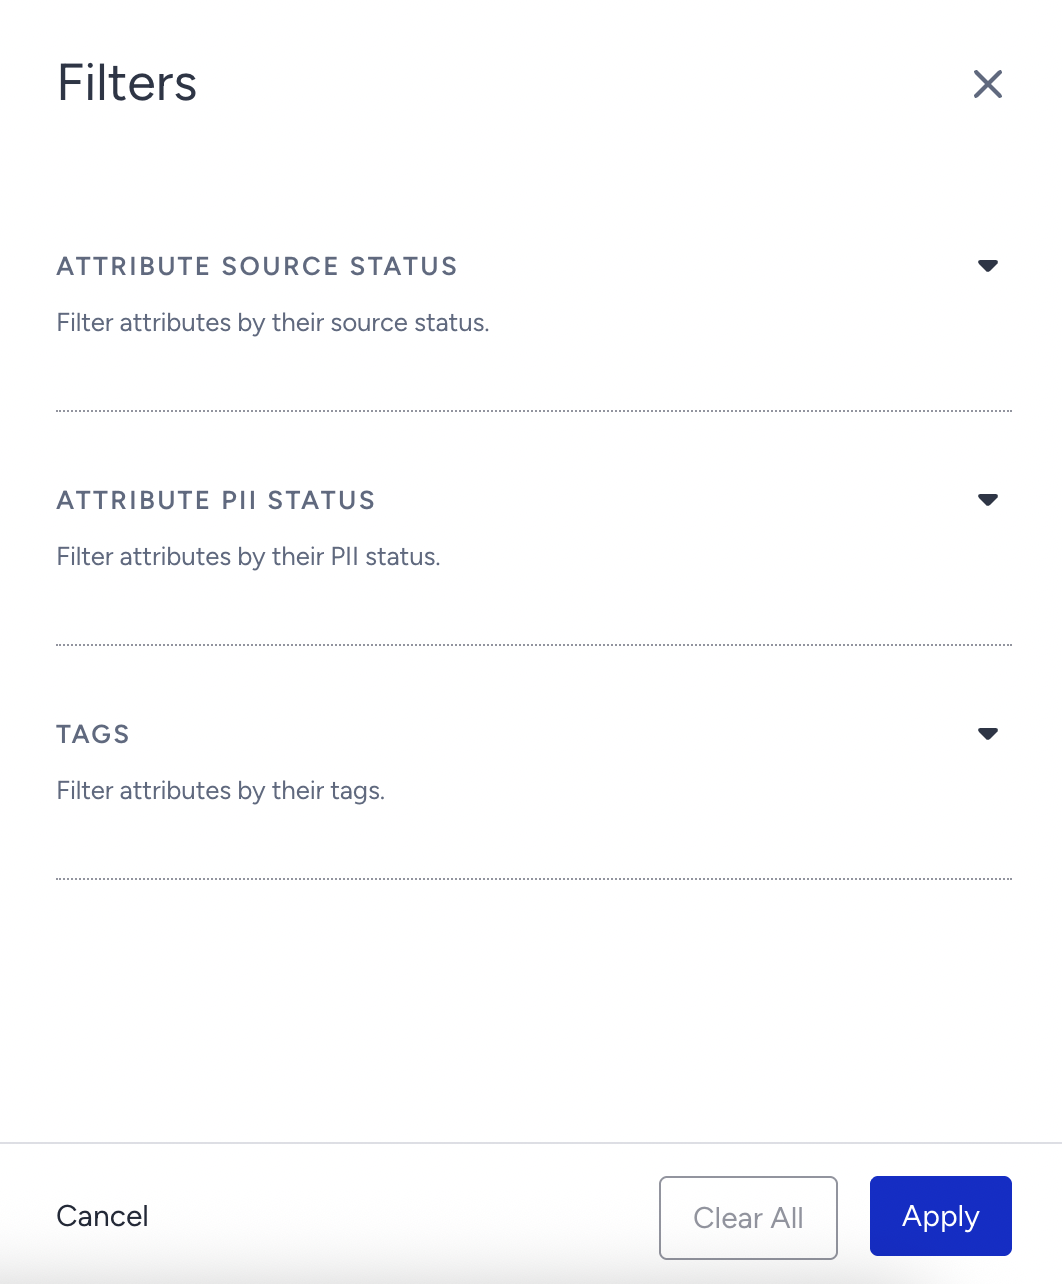
To apply a broader filtering, click the Filters button.
You can filter attributes and events by their Source, PII status, and tags.
Thanks to the Columns button, you can customize the columns on the listing page.
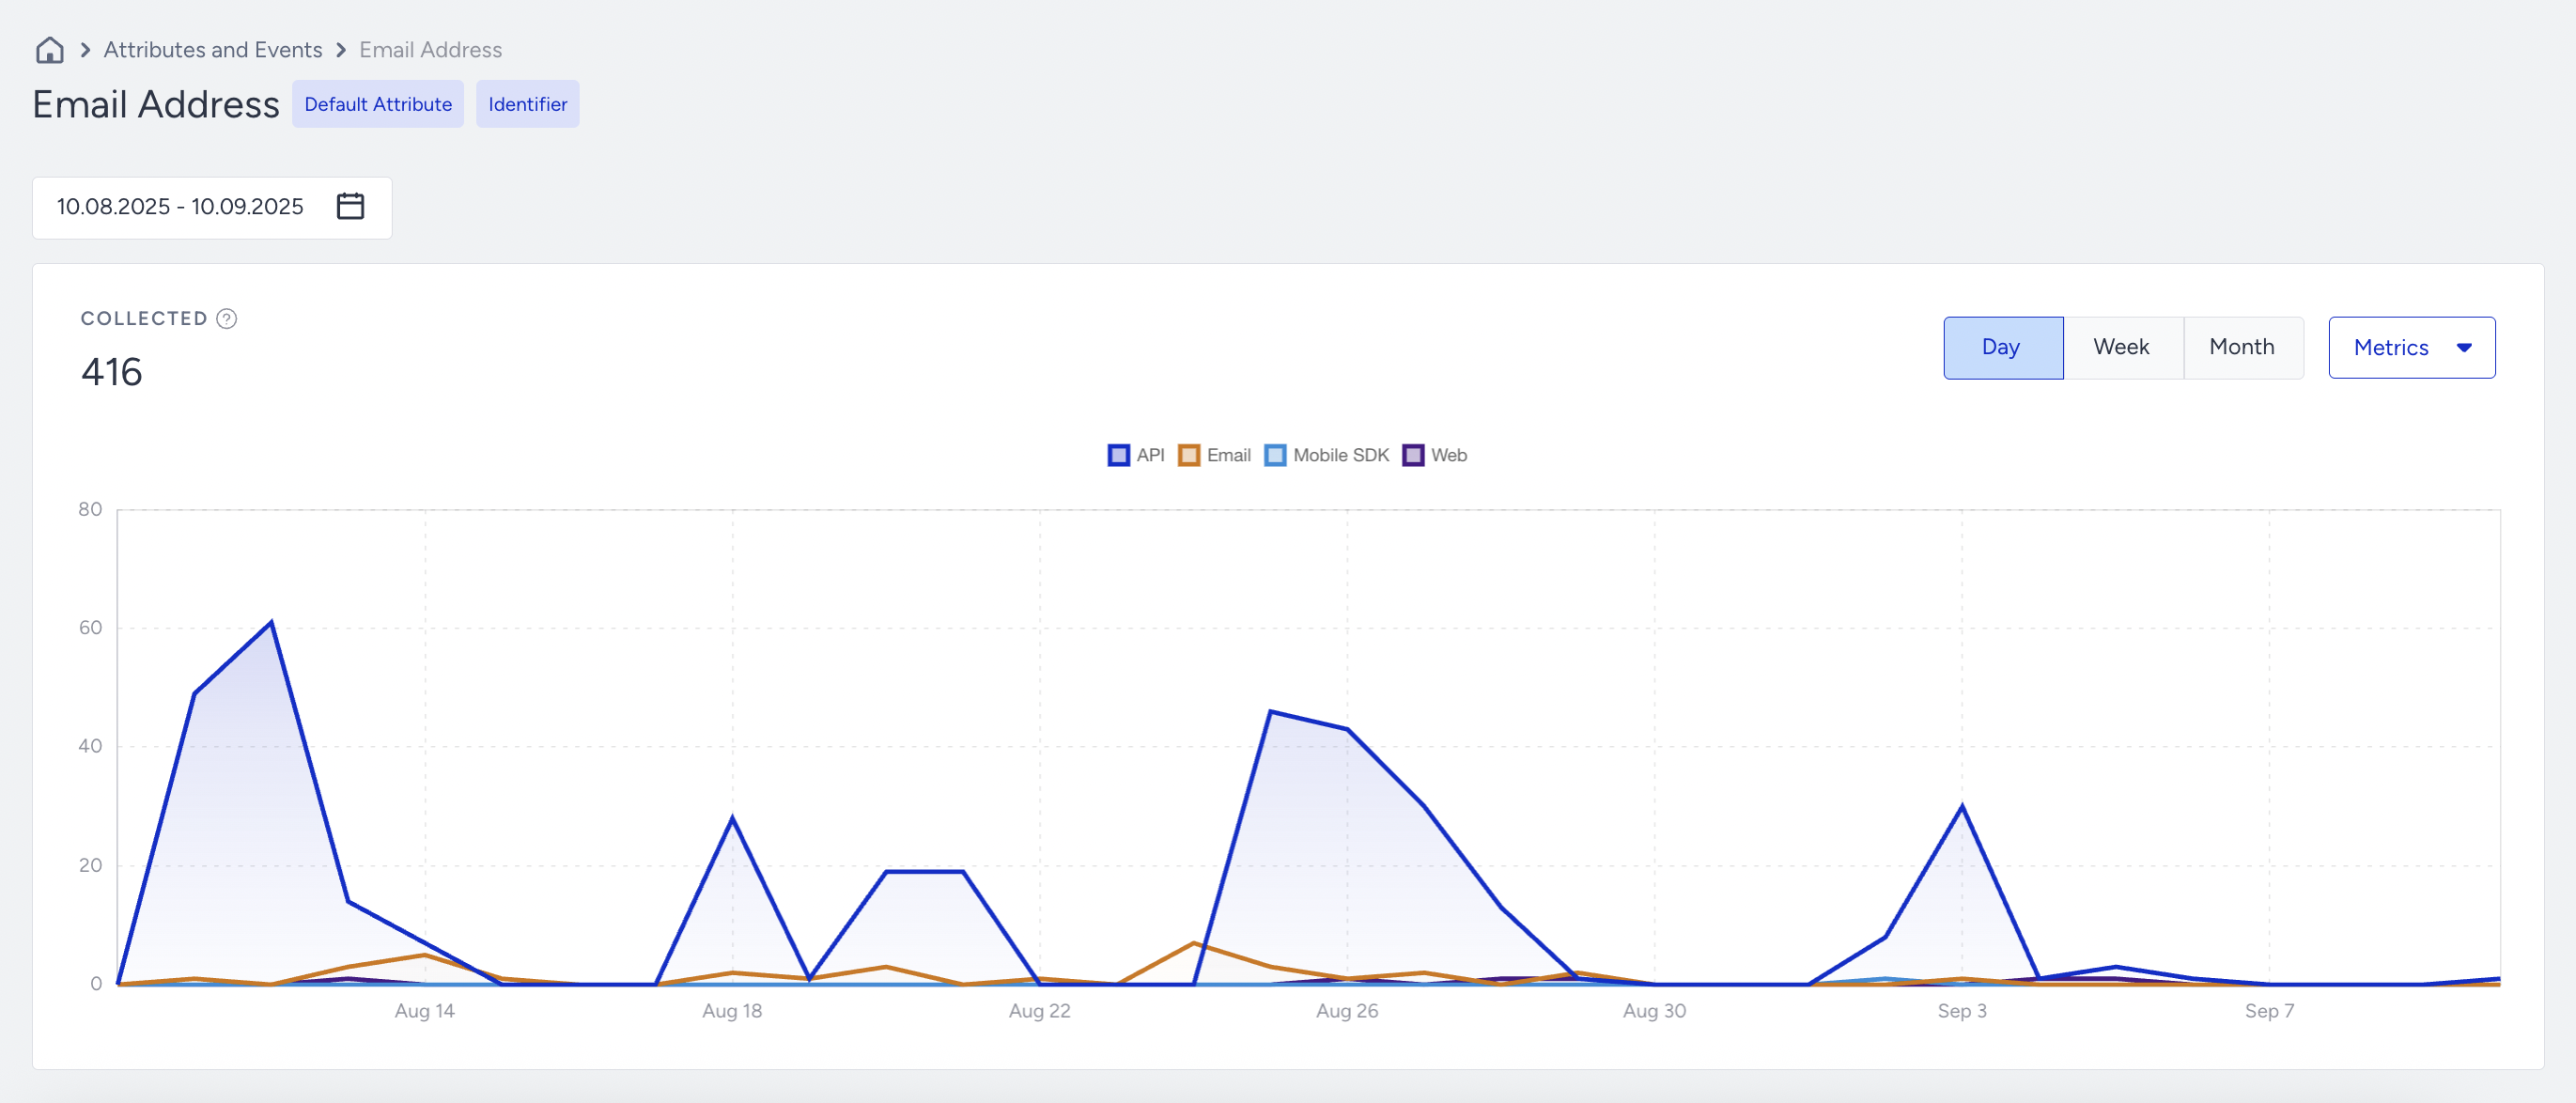
Attributes, Events, and Event Parameters Data Analytics
You can view the analytics page, including the trend line, when you click the Analytics button next to an attribute, event, or event parameter.
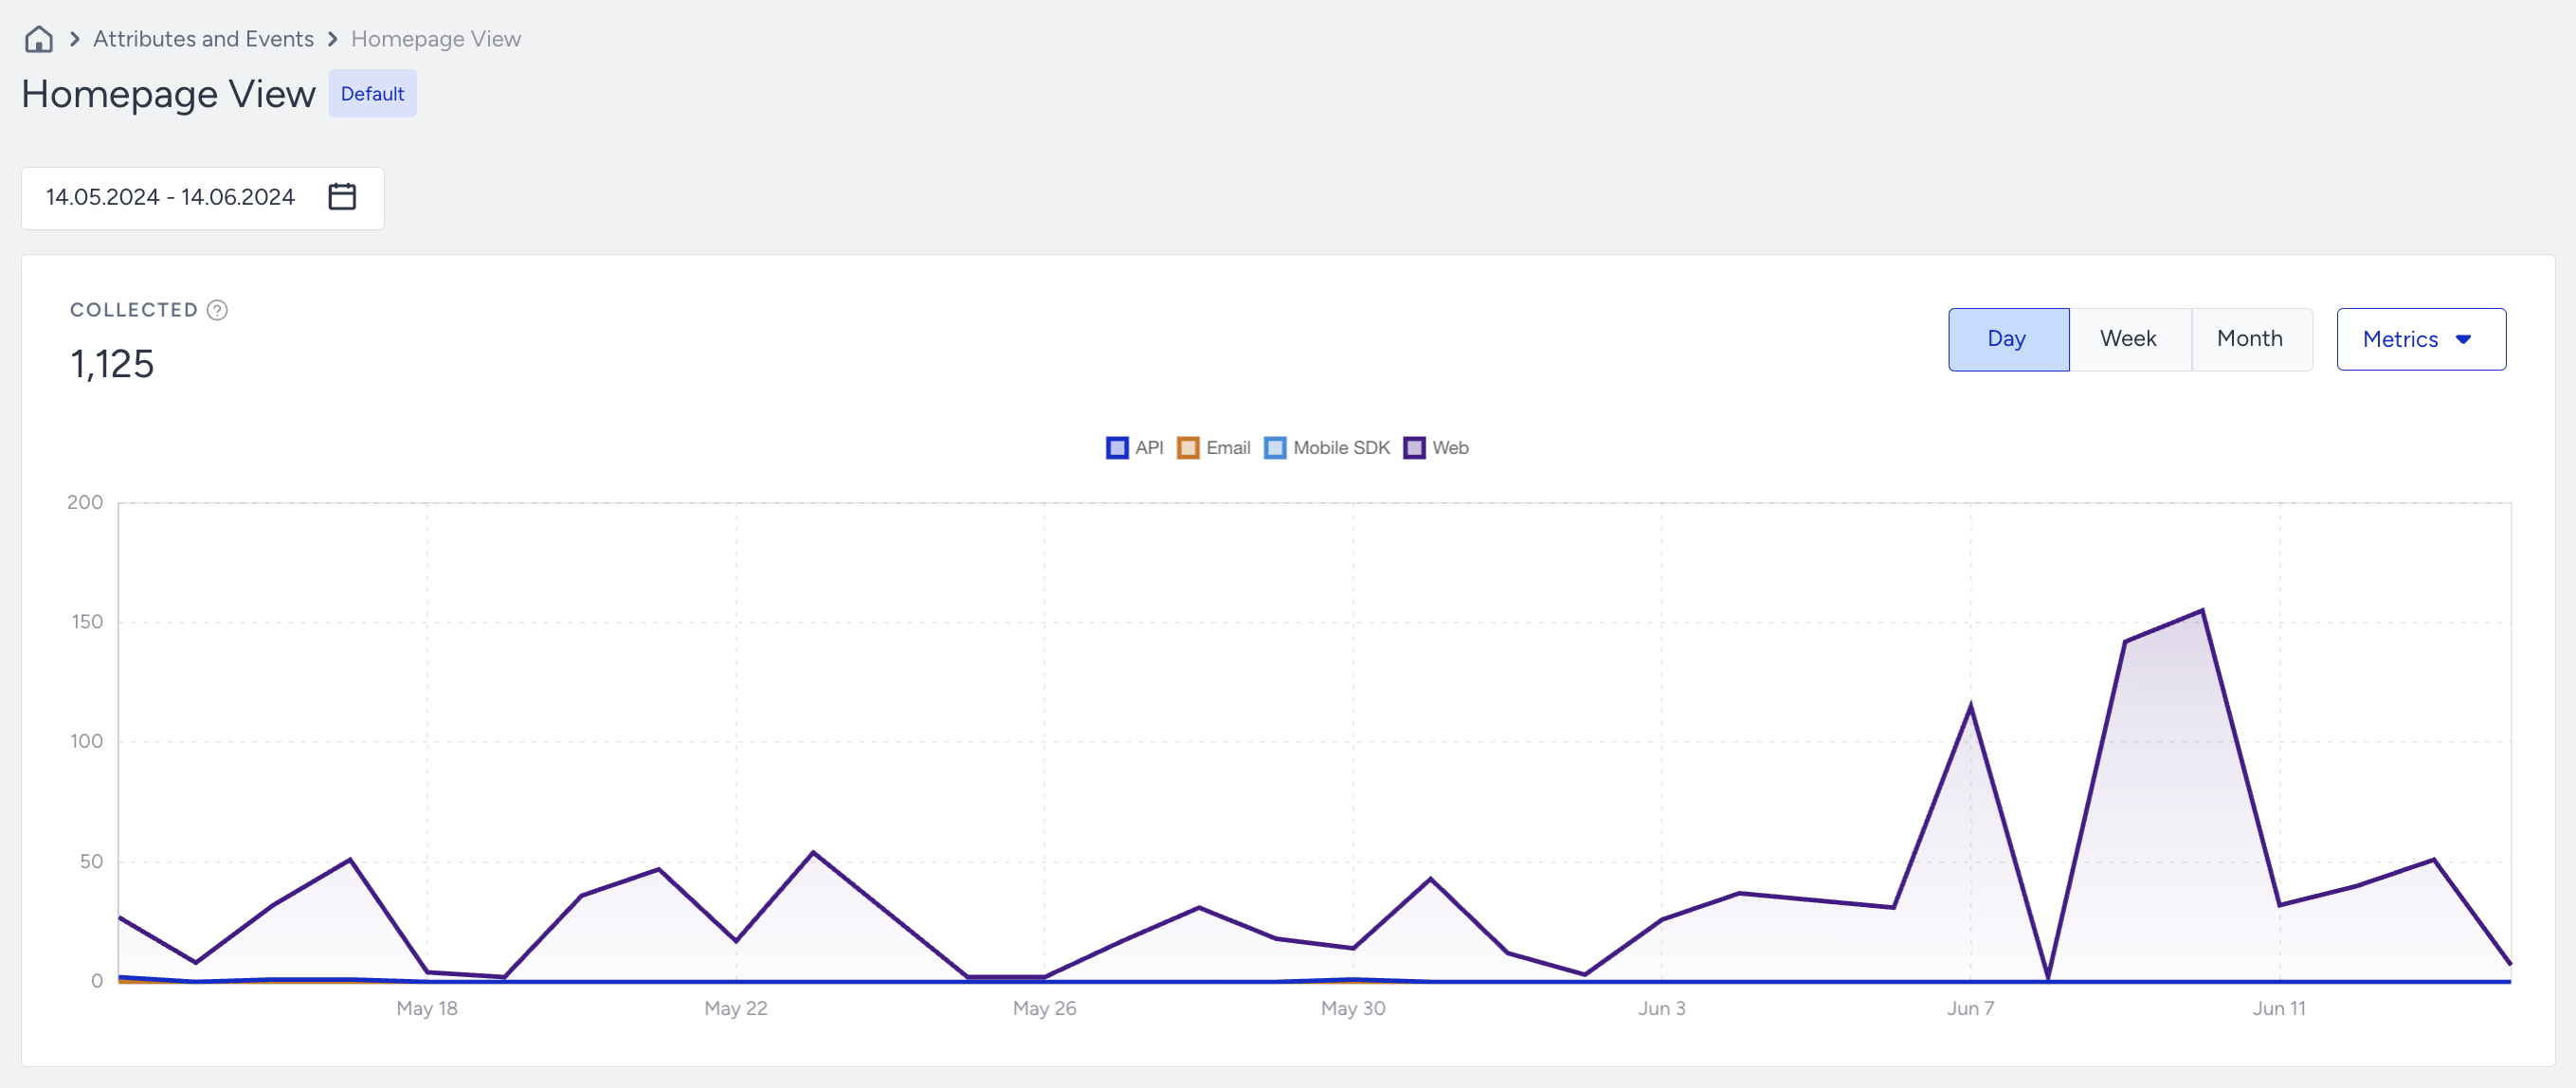
For every type of data (attributes, events, or parameters), you can see the ingestion over time (whether on a daily, weekly, or monthly basis).
The Collected number reflects the total number of instances collected data for the corresponding attribute/event/parameter within the period examined.
The Metrics dropdown allows the panel user to filter incoming data by source.
The Day/Week/Month selection allows you to change the view depending on your desired time breakdown (Web, Mobile SDK, Email/CRM, API).
Note that the displayed data is the total number of ingested data at that period range, but not the events that happen at that moment Examples to illustrate how we are counting the data ingestion
If today is 1 January 2025, and you send an event with 1 Dec 2024 time-stamp today, Insider One will record +1 ingested data count for 1 January 2024 here.
If you send an Upsert API request and change the attribute value today, Insider One will record +1 ingested data count for the period of today.
If you send an Upsert API request and send same value (example: same name) today, Insider One will record +1 ingested data count for the period of today.
If you send a delete request and delete an attribute today, Insider One will not record any ingested data, because deletion is not same as data ingestion.
The data you have seen here is not limited by the relevant Event TTL. Insider One counts these metrics daily, stores them, and showcases the results as a trend line. If you have events with a 3-month TTL, you can see trends from over 3 months ago. Insider One has stored these logs indefinitely since the first date of data ingestion.