Suggested readings: Transactional Analytics Dashboard, Transactional Email Channel Analytics, Transactional SMS Channel Analytics
Journey Analytics provides detailed performance reporting for a single transactional journey. It allows you to analyze delivery, engagement, and conversion metrics for that journey within a selected time range.
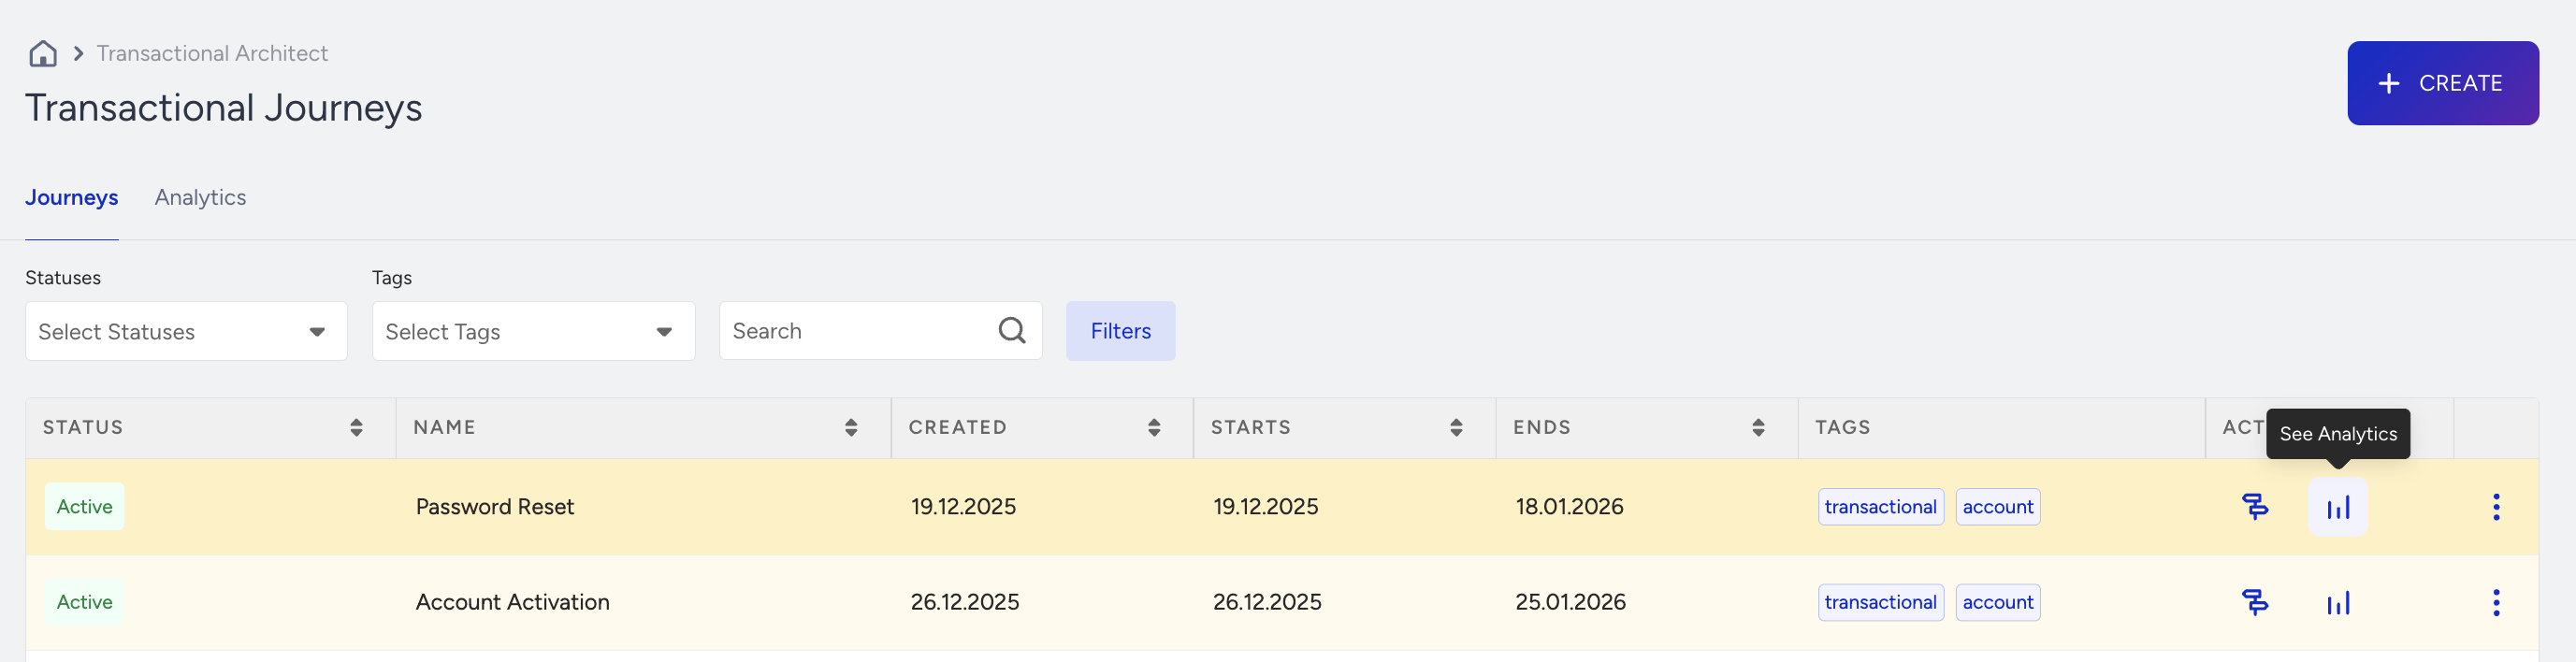
Click the See Analytics button of a journey on the listing page to access the Journey Analytics.
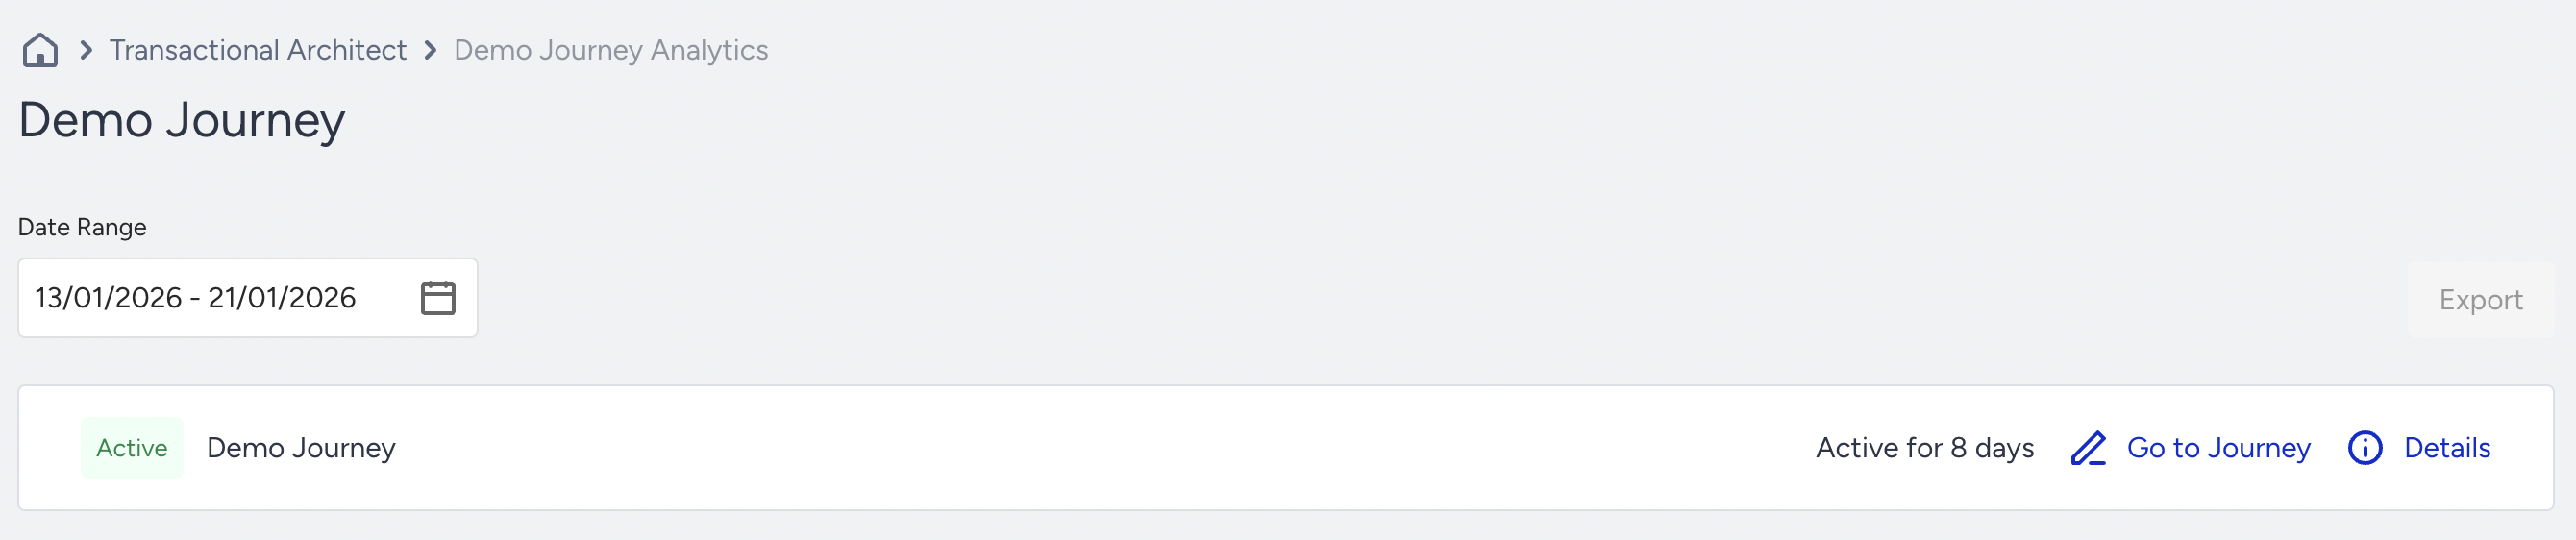
Time range and filters
At the top of the page, you can select a time range to view analytics for a specific period. All metrics, charts, and tables on the page update based on the selected date range. Journey Analytics reflects data only for the selected journey and does not aggregate data across multiple journeys.
Conversion Tracking Availability
By default, conversion tracking is disabled for transactional journeys.
The following metrics are not calculated or displayed unless it is enabled:
Conversion
Conversion Rate
Revenue
Average Order Value
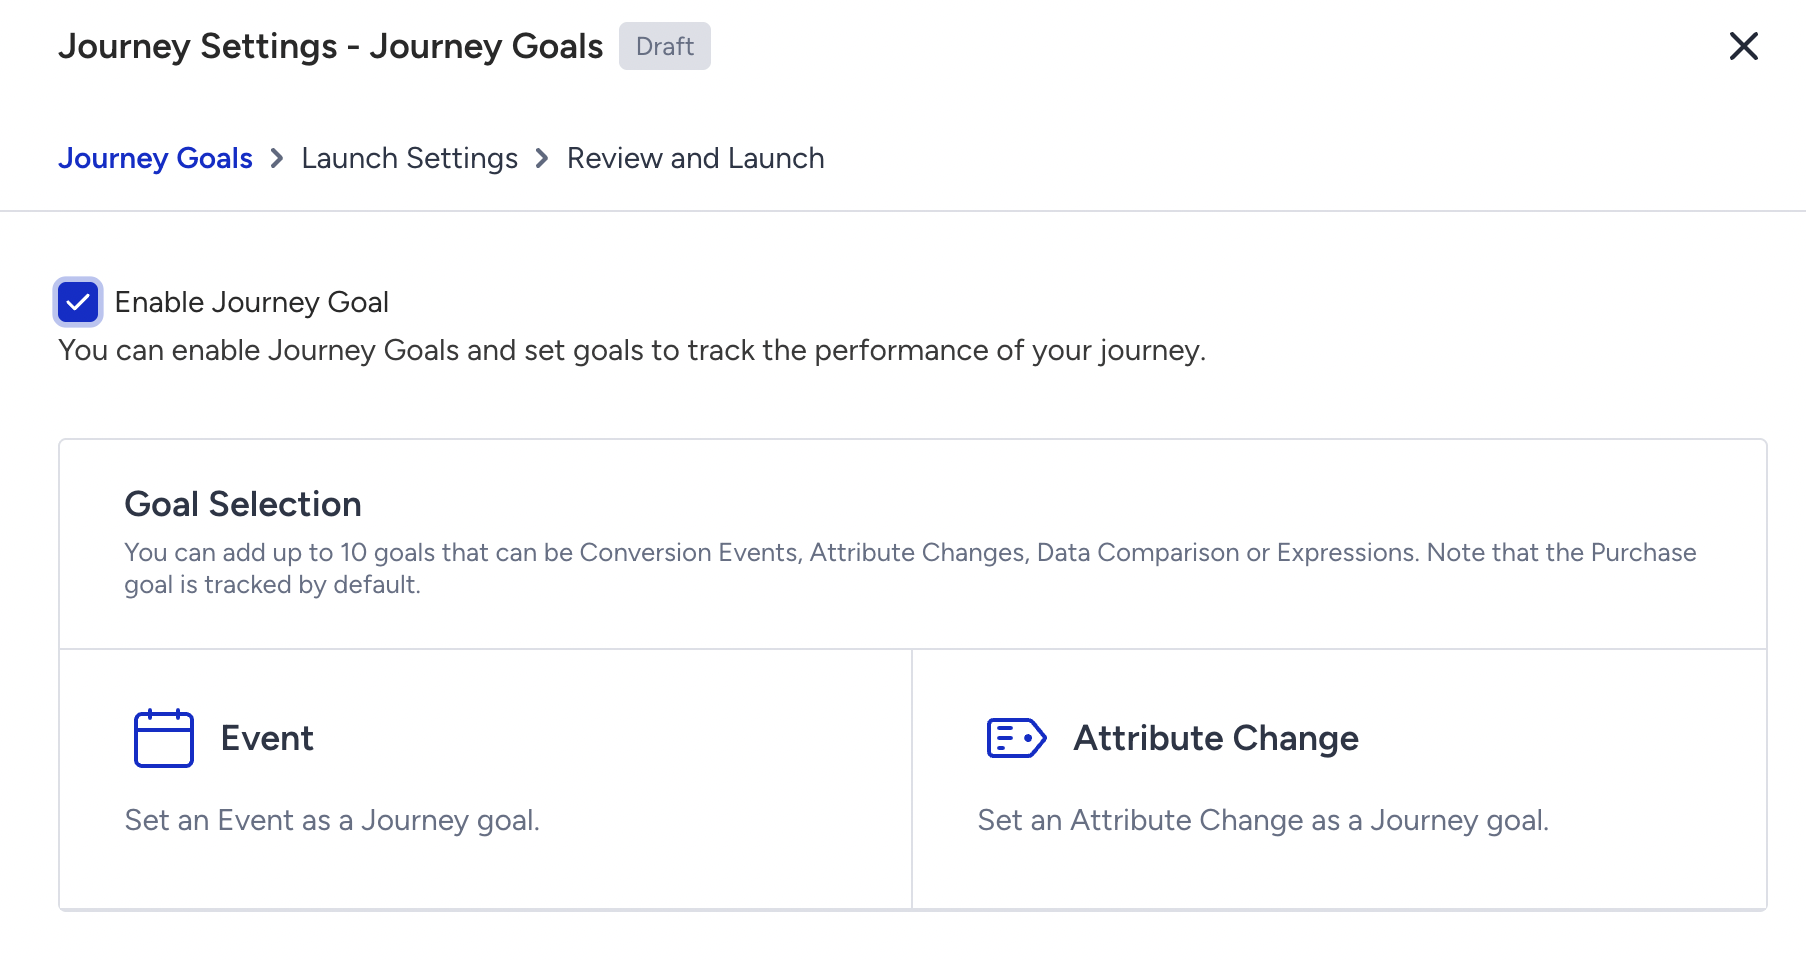
To enable conversion tracking:
Go to the Launch modal.
Open the Goals step.
Check the Enable Goal Tracking box.
If Goal Tracking is enabled and no specific goal is selected, Purchase is tracked as the default conversion goal.
If you want to track a goal other than Purchase, you must select a custom event or attribute-based goal and define the conversion duration.
Journey details
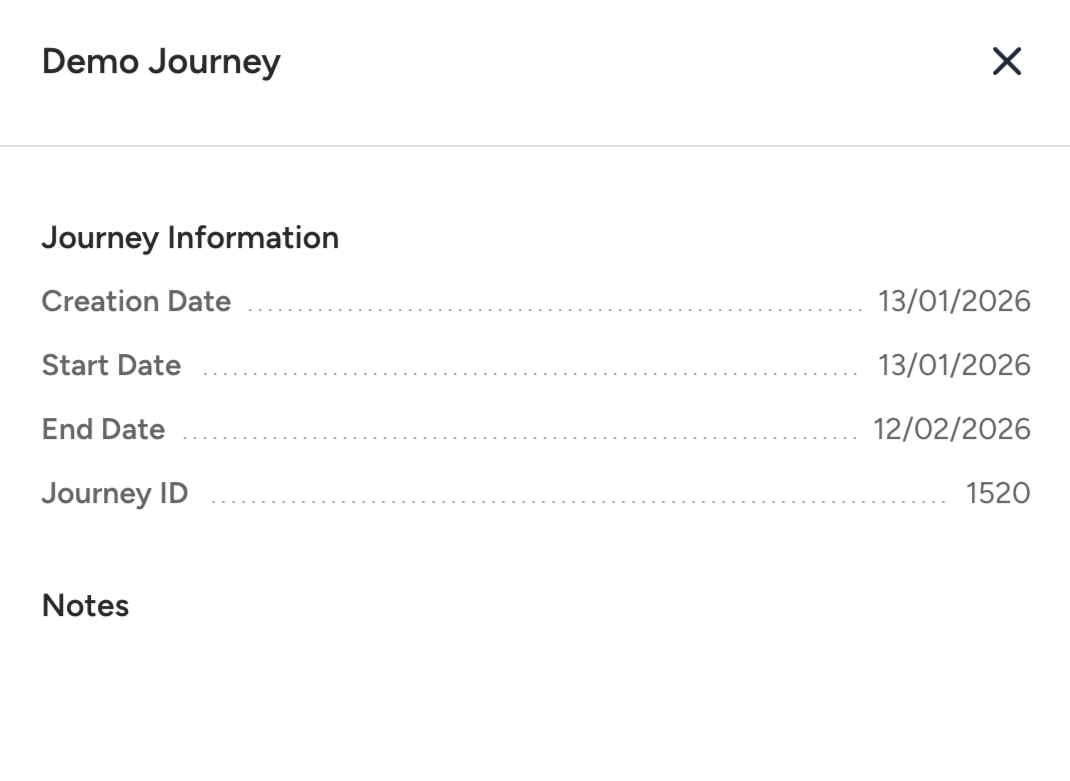
You can click Details at the top of the page to view journey-level information, including:
Journey ID
Creation date
Start date
End date
Journey status
This panel provides contextual information and does not affect analytics calculations.
Live Stats
Live Stats display high-level user flow metrics for the selected journey.
The following metrics are shown:
Entered: The number of users who entered the journey.
Dropped: The number of users who were dismissed due to channel reachability issues.
Drop Rate: The percentage of dropped users compared to entered users.
Completed: The number of users who completed the journey by reaching the final element.
Complete Rate: The percentage of completed users compared to entered users.
Exited: The number of users who exited the journey due to exit criteria.
Sent: The total number of messages addressed to users across all channels in the journey.
Delivered: The total number of messages successfully delivered.
Delivery Rate: The percentage of delivered messages compared to sent messages.
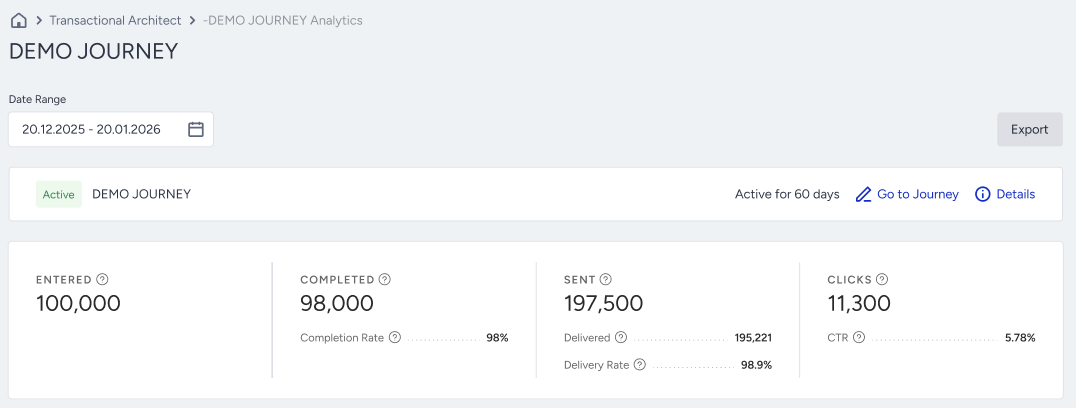
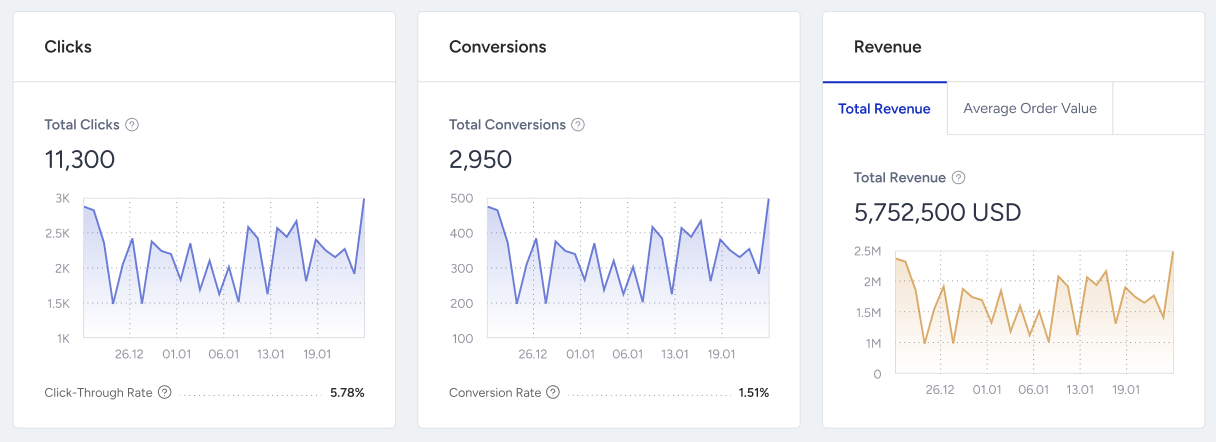
General Stats
General Stats provide aggregated engagement and conversion metrics for the journey.
The following metrics are displayed:
Total Clicks: The total number of clicks across all channels in the journey.
Total Conversions: The total number of completed conversion goals across all channels. It is displayed only if conversion tracking is enabled.
Total Revenue: The total purchase value attributed to the journey. It is displayed only if conversion tracking is enabled.
Average Order Value (AOV): Revenue divided by the number of purchases. It is displayed only if conversion tracking is enabled.
Each metric includes trend indicators based on the selected date range.
Failed Request Breakdown
The Requests Breakdown section provides visibility into the API requests that trigger the transactional journey. It helps you analyze the health and reliability of journey entry over time.
This section focuses on the execution of journey entry requests, not message delivery.
Requests Breakdown Chart
The chart displays the volume of API requests over the selected time range.
You can view the following metrics:
All Requests: The total number of API requests sent to trigger the journey.
Successful Requests: The number of API requests that were successfully processed and accepted by Transactional Journeys.
Failed Requests: The number of API requests that failed validation or processing and did not trigger journey entry.
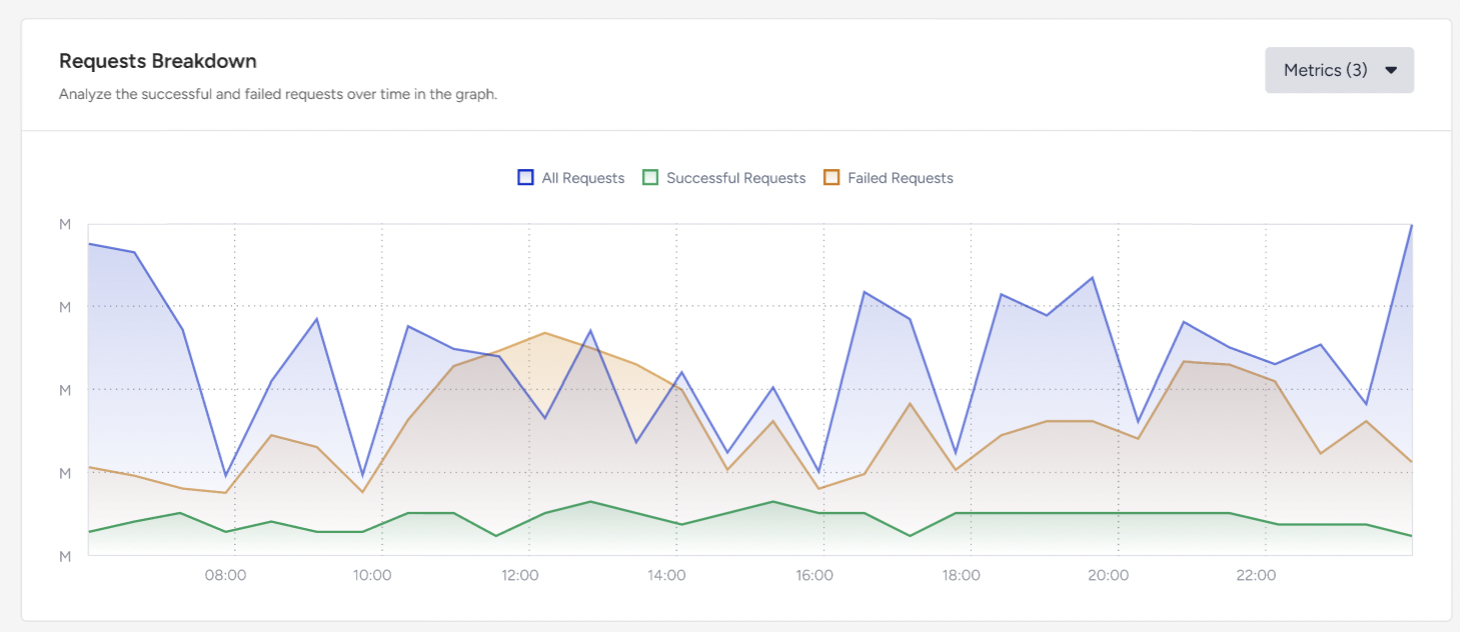
You can use the Metrics selector to toggle each metric on or off to focus on specific request outcomes. The chart can be viewed in daily, weekly, or monthly resolution depending on the selected time range.
Failed Requests Table
Failed Requests represent API calls that did not result in a journey entry. If the request fails, no user can enter the journey, and no message can be sent.
The Failed Requests table provides a breakdown of failed API requests by failure reason.
For each failure type, the table shows:
Description: A human-readable explanation of the failure reason.
Request Count: The total number of failed API requests with this failure reason.
User Count: The number of unique users affected by these failed requests.
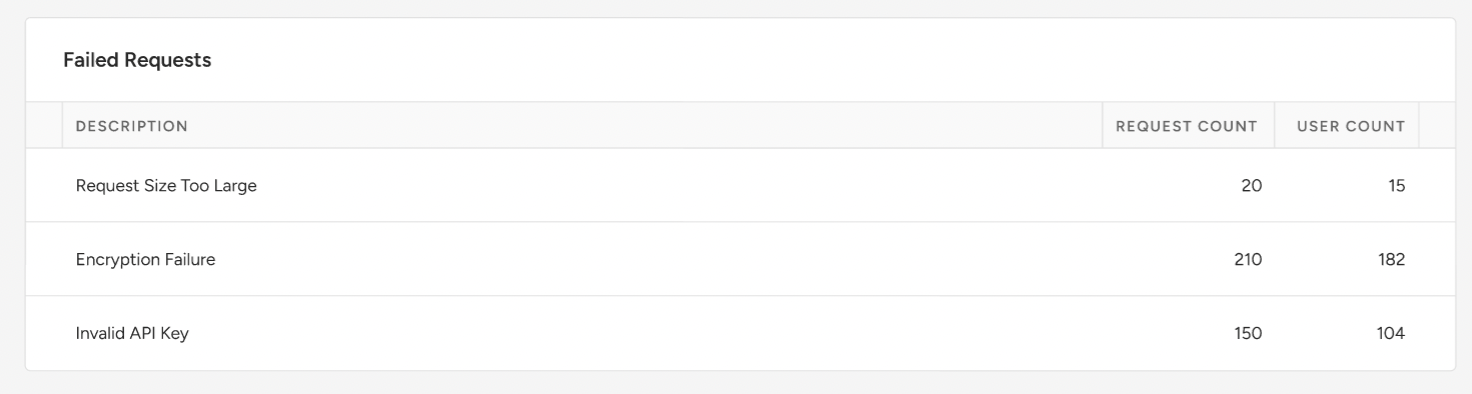
Common failure types
Below are some examples of failure reasons:
Invalid API Key: Requests rejected due to missing or invalid authentication credentials.
Request Size Too Large: Requests exceeding the allowed payload size.
Encryption Failure: Requests that could not be decrypted or validated securely.
Internal Errors: Represents requests that failed due to unexpected system-level issues during processing.
Internal errors occur after the request is received and validated.
They are not caused by payload structure or authentication.
They do not result in journey entry or message sending.
Invalid Request Schema: The request payload does not match the expected schema for the journey. It might be due to:
Missing required fields
Incorrect data types
Mismatched dynamic attribute structures
Invalid nesting depth in dynamic content
Invalid Request Format: Occurs when the request body cannot be parsed correctly. It might be due to:
Malformed JSON
Invalid content structure
Corrupted request body
Unauthorized: Failures occur when the request cannot be authenticated due to:
Missing authentication headers
Invalid or expired API keys
Incorrect partner credentials
Invalid Target Journey: Indicates that the request references a journey that:
Does not exist.
Is not Active.
Is not accessible by the authenticated partner.
Rate Limit Exceeded: Indicates that the request exceeded allowed rate limits.
Batch Size Exceeded: Occurs when the number of users included in the request exceeds the allowed limit.
Idempotency Conflict: Indicates that the request was sent with an idempotency key that was already used.
Total Channel Metrics
Total Channel Metrics compares performance across channel types used in the journey.
For each channel type, the following metrics are shown:
Number of Channels: How many times the channel appears in the journey flow.
Sent: Number of messages addressed via that channel.
Delivered: Number of messages delivered via that channel.
Delivery Rate: Delivered messages divided by sent messages.
Clicks: Total clicks via the channel.
Opens: Total opens for Email messages.
Conversions: Conversions attributed to the channel. It is displayed only if conversion tracking is enabled.
Revenue: Revenue attributed to the channel. It is displayed only if conversion tracking is enabled.
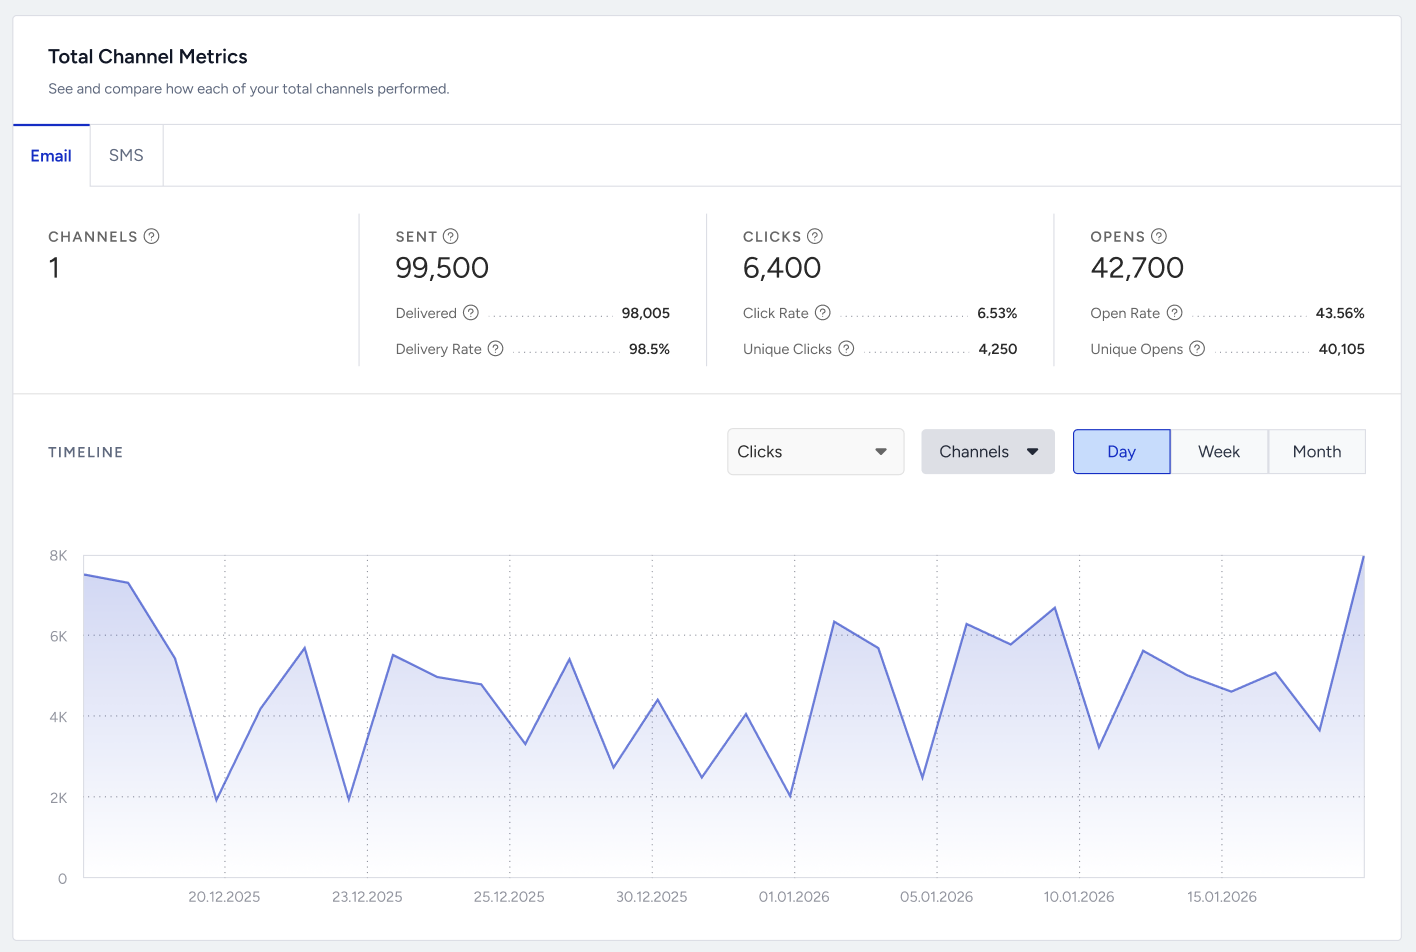
You can select a channel and metric to view its timeline trend and compare it with other channels.
Channels Details
Channels by Layers analyzes channel performance based on journey layers.
A layer represents the sequence of user interactions. This section helps measure how metrics change as users receive multiple messages.
For each channel and layer, you can view:
Sent
Delivered
Delivery Rate
Clicks
Opens
Conversions
Revenue
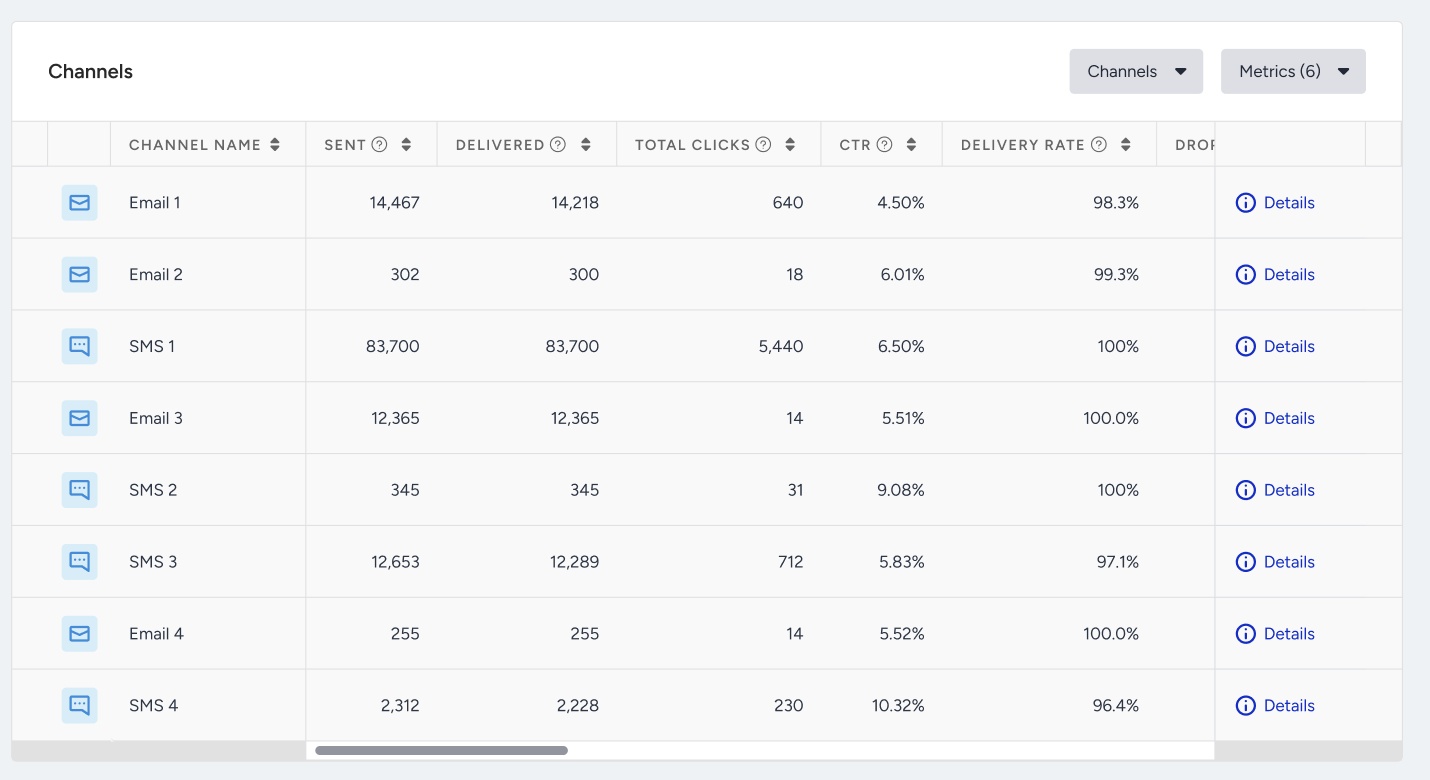
You can add or remove metrics from the table and scroll horizontally to review all available data.
Export
You can click the Export button to export Journey Analytics.
The exported file reflects the selected time range, including all visible metrics and tables. It is downloaded in XLSX format, and the exported data matches what is displayed on the page.