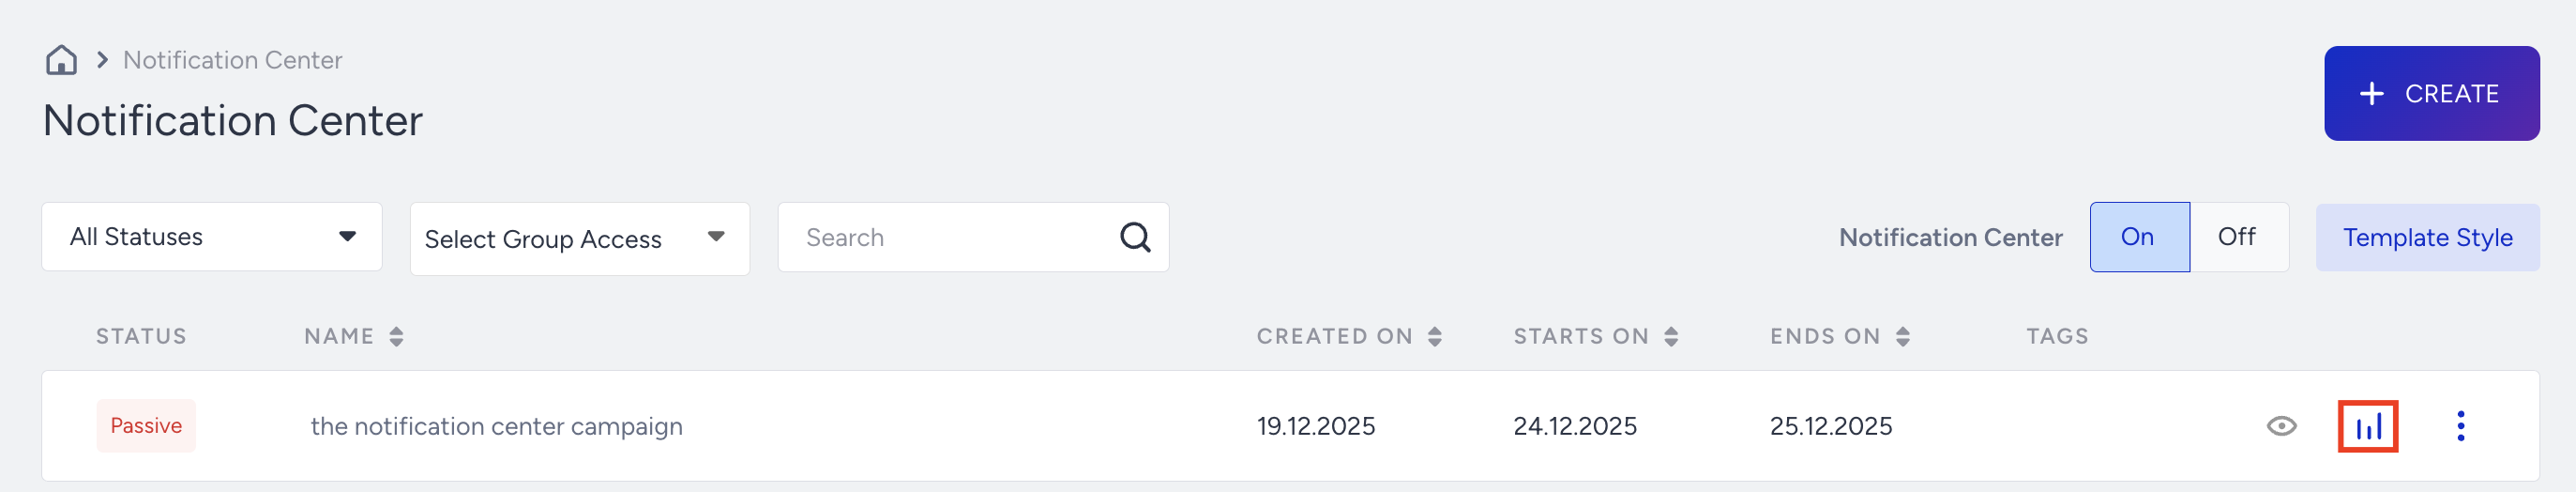
You can view your Notification Center analytics, evaluate their performance, and keep track of clicks separately. Click the Analytics button next to the campaign whose analytics details you want to view to proceed.
Selecting a time range with the date picker in the top-right corner of the page lets you filter performance metrics. You can view metrics by goal.
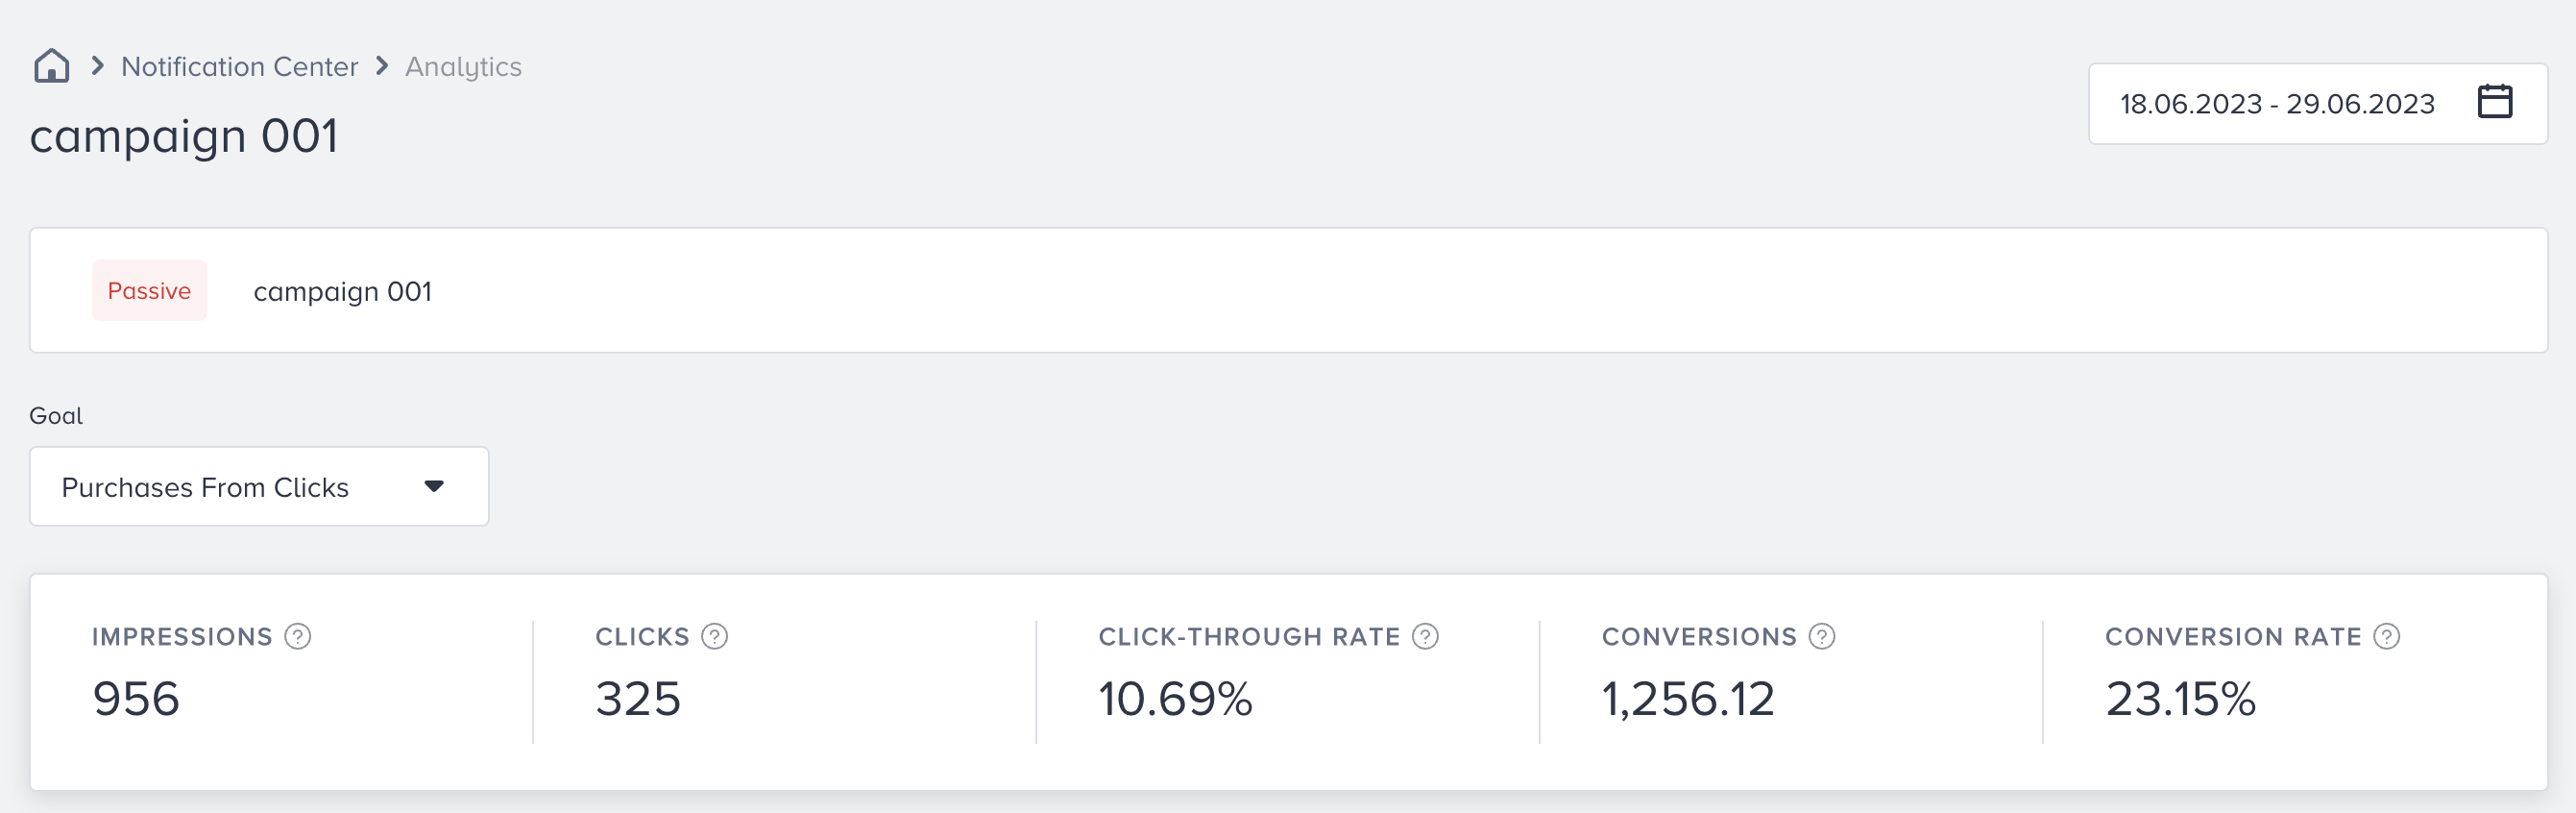
Narrowing down your results with the date picker, you can see the following metrics:
Impressions: The number of times that the users viewed your campaign.
Clicks: The number of times that the users interacted with your campaign.
Click-through Rate: The percentage of clicks to the impressions.
Conversions: The number of successful primary goal accomplishments.
Conversion Rate: The percentage of conversions to the impressions.
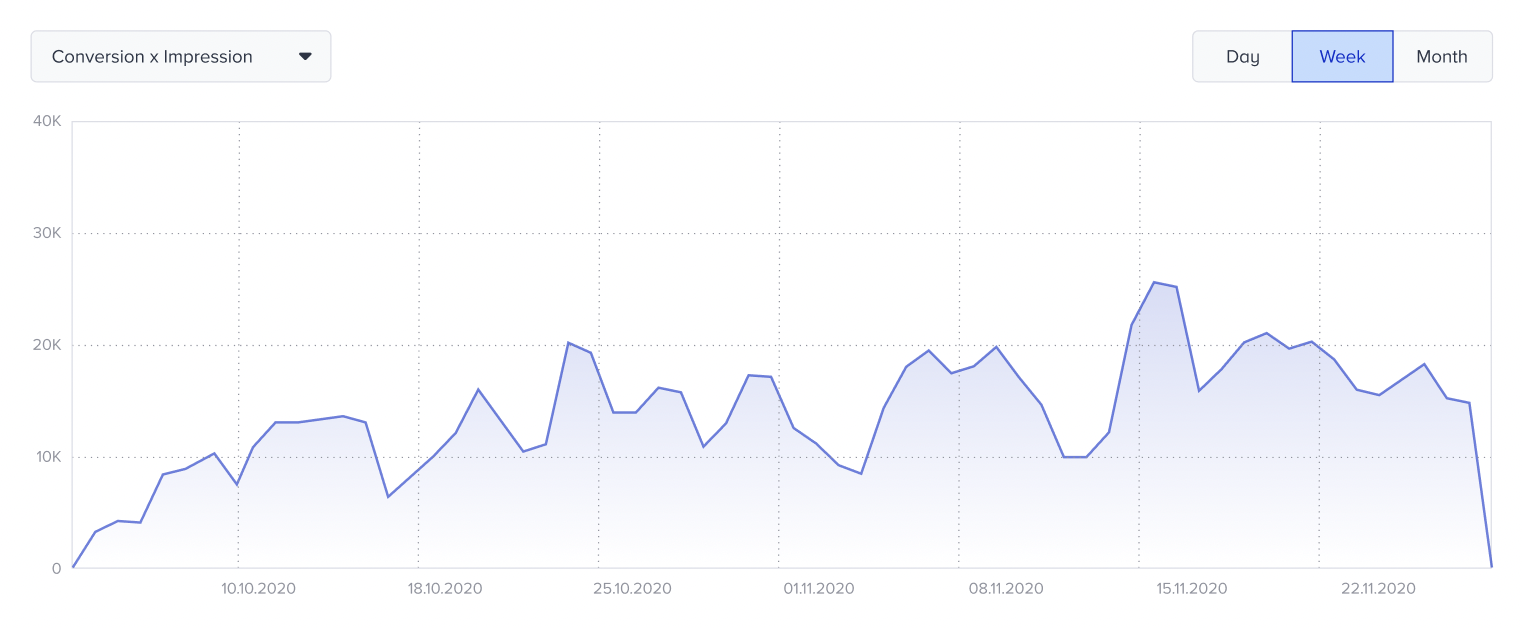
The charts section displays daily, weekly, or monthly "Conversion x Impression" or "Click" details as a line chart, based on your goal and time range selection.