AI Reporting Assistant is a chat-based analytics assistant available in the MindBehind Live reporting panel. You can ask questions in plain language and receive charts, tables, and short written summaries based on your account's chatbot and live support data.
Use AI Reporting Assistant to explore reporting data, compare performance, analyze conversation content, and review metrics without building reports manually.
This guide explains how to access AI Reporting Assistant, ask reporting questions, interpret its responses, and work with the available reporting capabilities.
Access AI Reporting Assistant
AI Reporting Assistant is available to users with the Admin and Department Admin roles. Users with the Agent role cannot access the assistant.
Admins can access the reporting data available to their account.
Department Admins can access data only for the departments they are authorized to view.
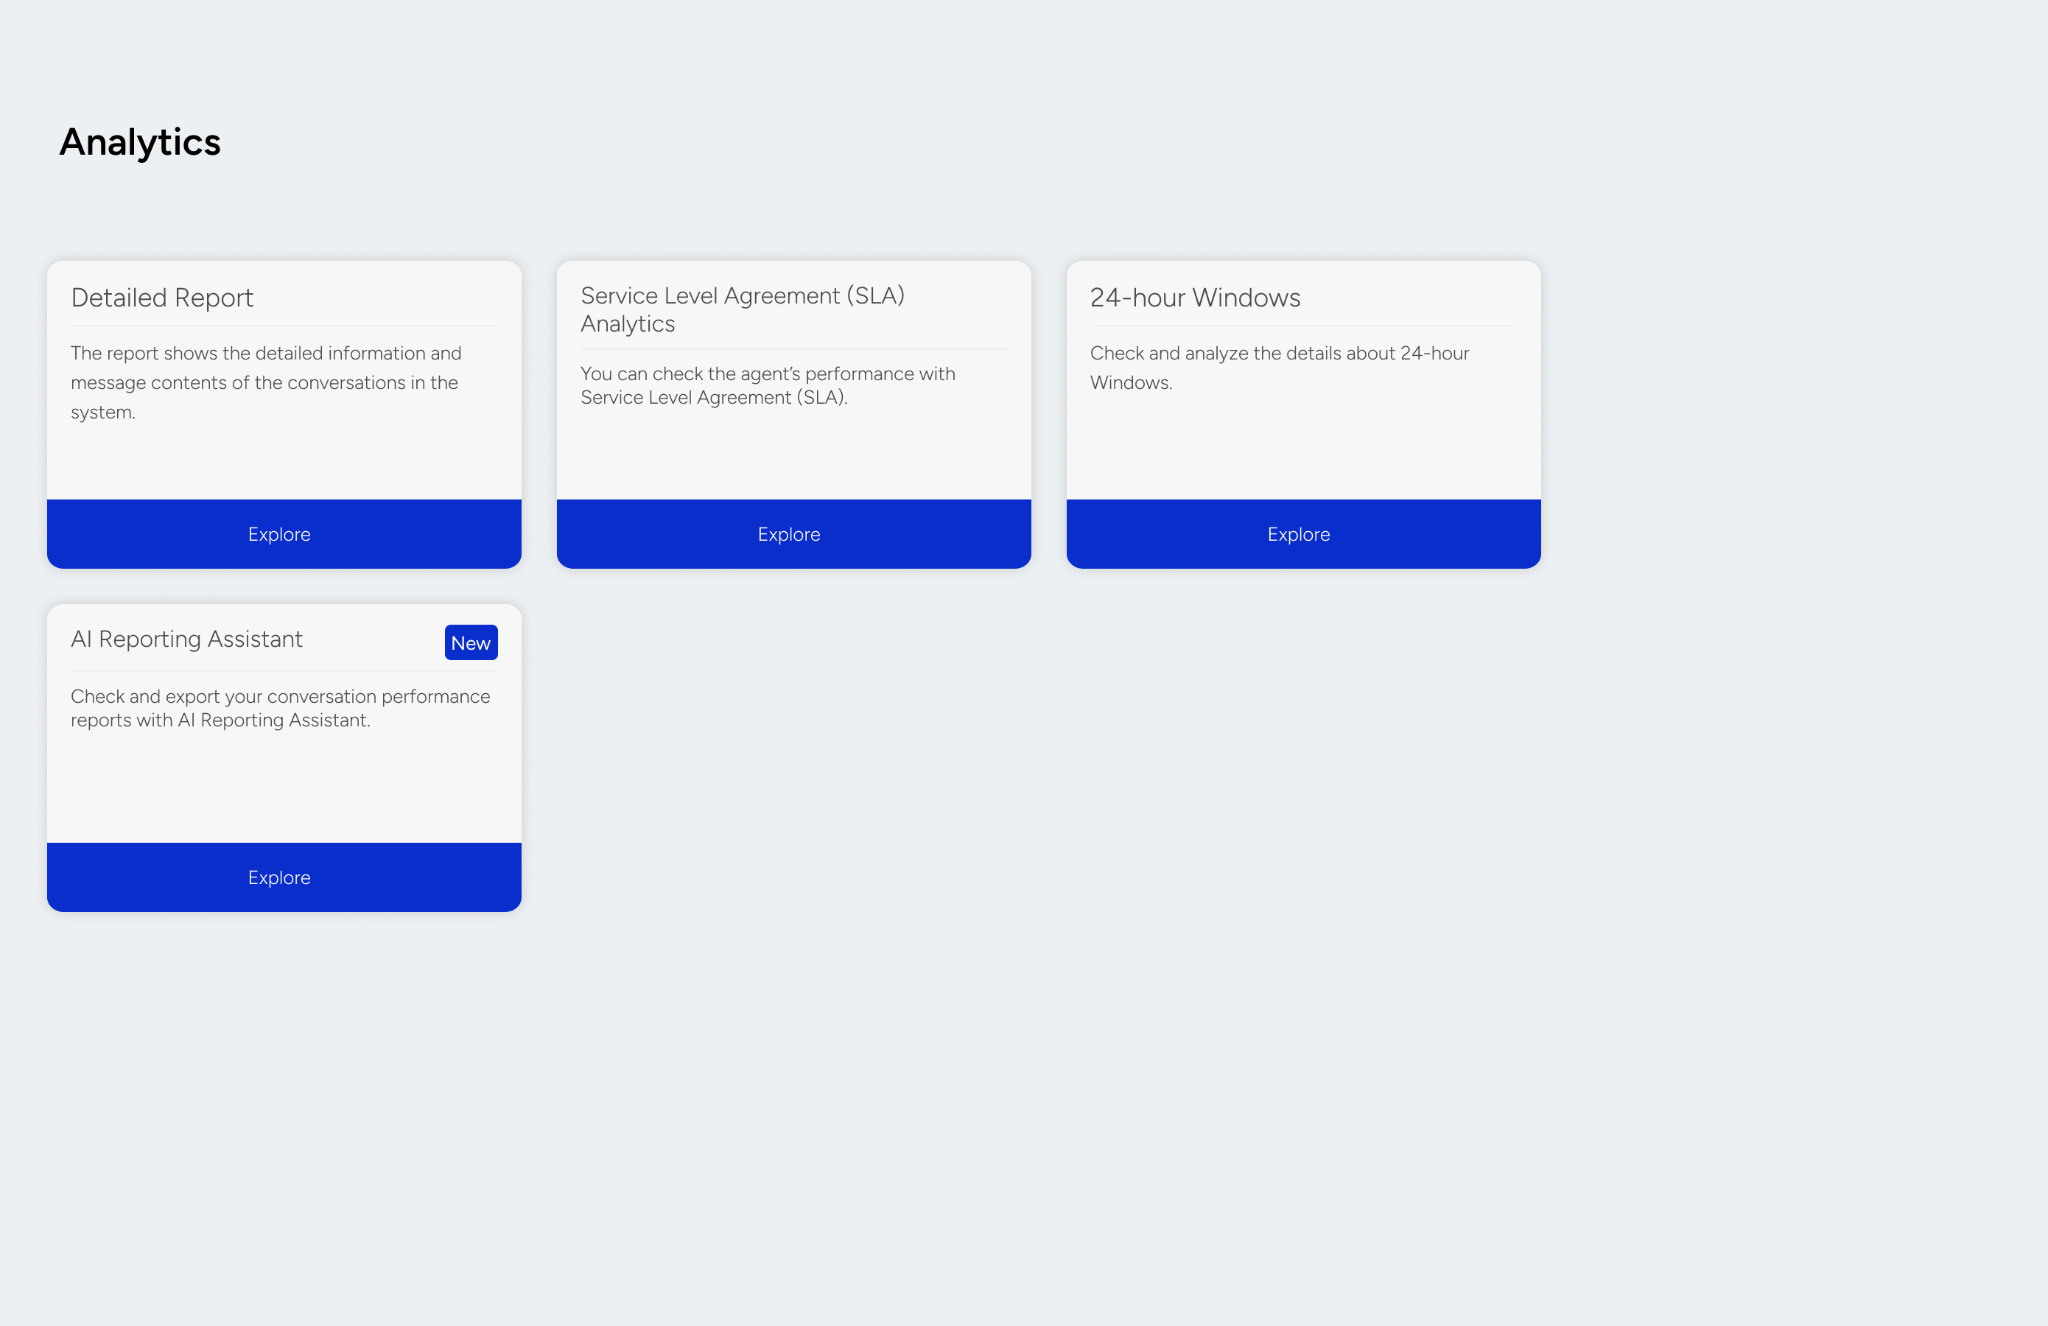
To open the AI Reporting Assistant, navigate to MindBehind Live > Analytics and select the AI Reporting Assistant card.
When you open the assistant for the first time, suggested questions appear to help you get started. You can select one of these suggestions or enter your own question.
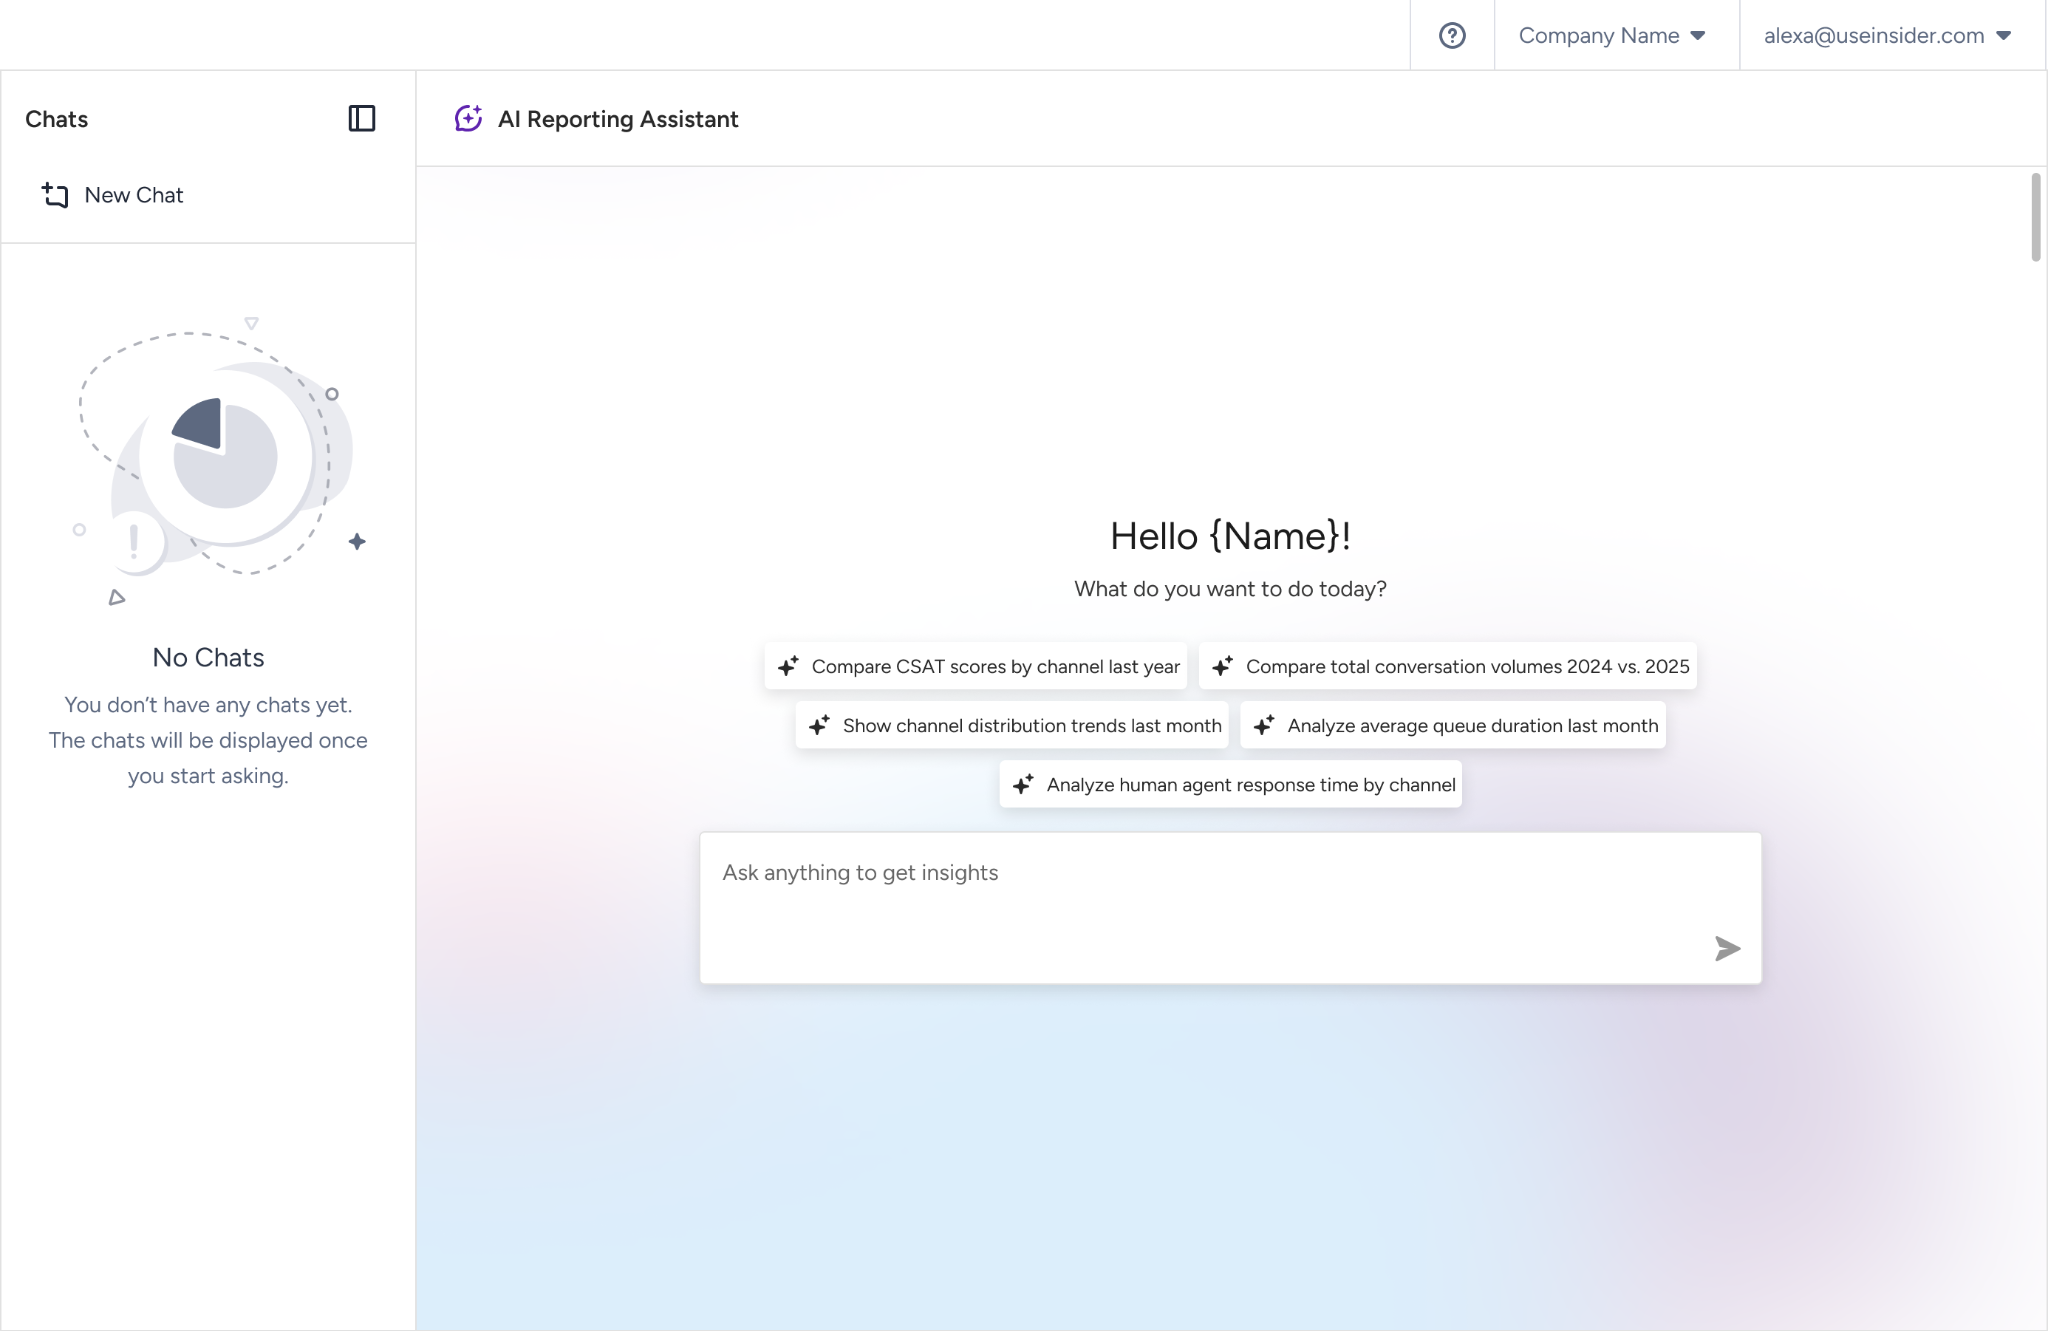
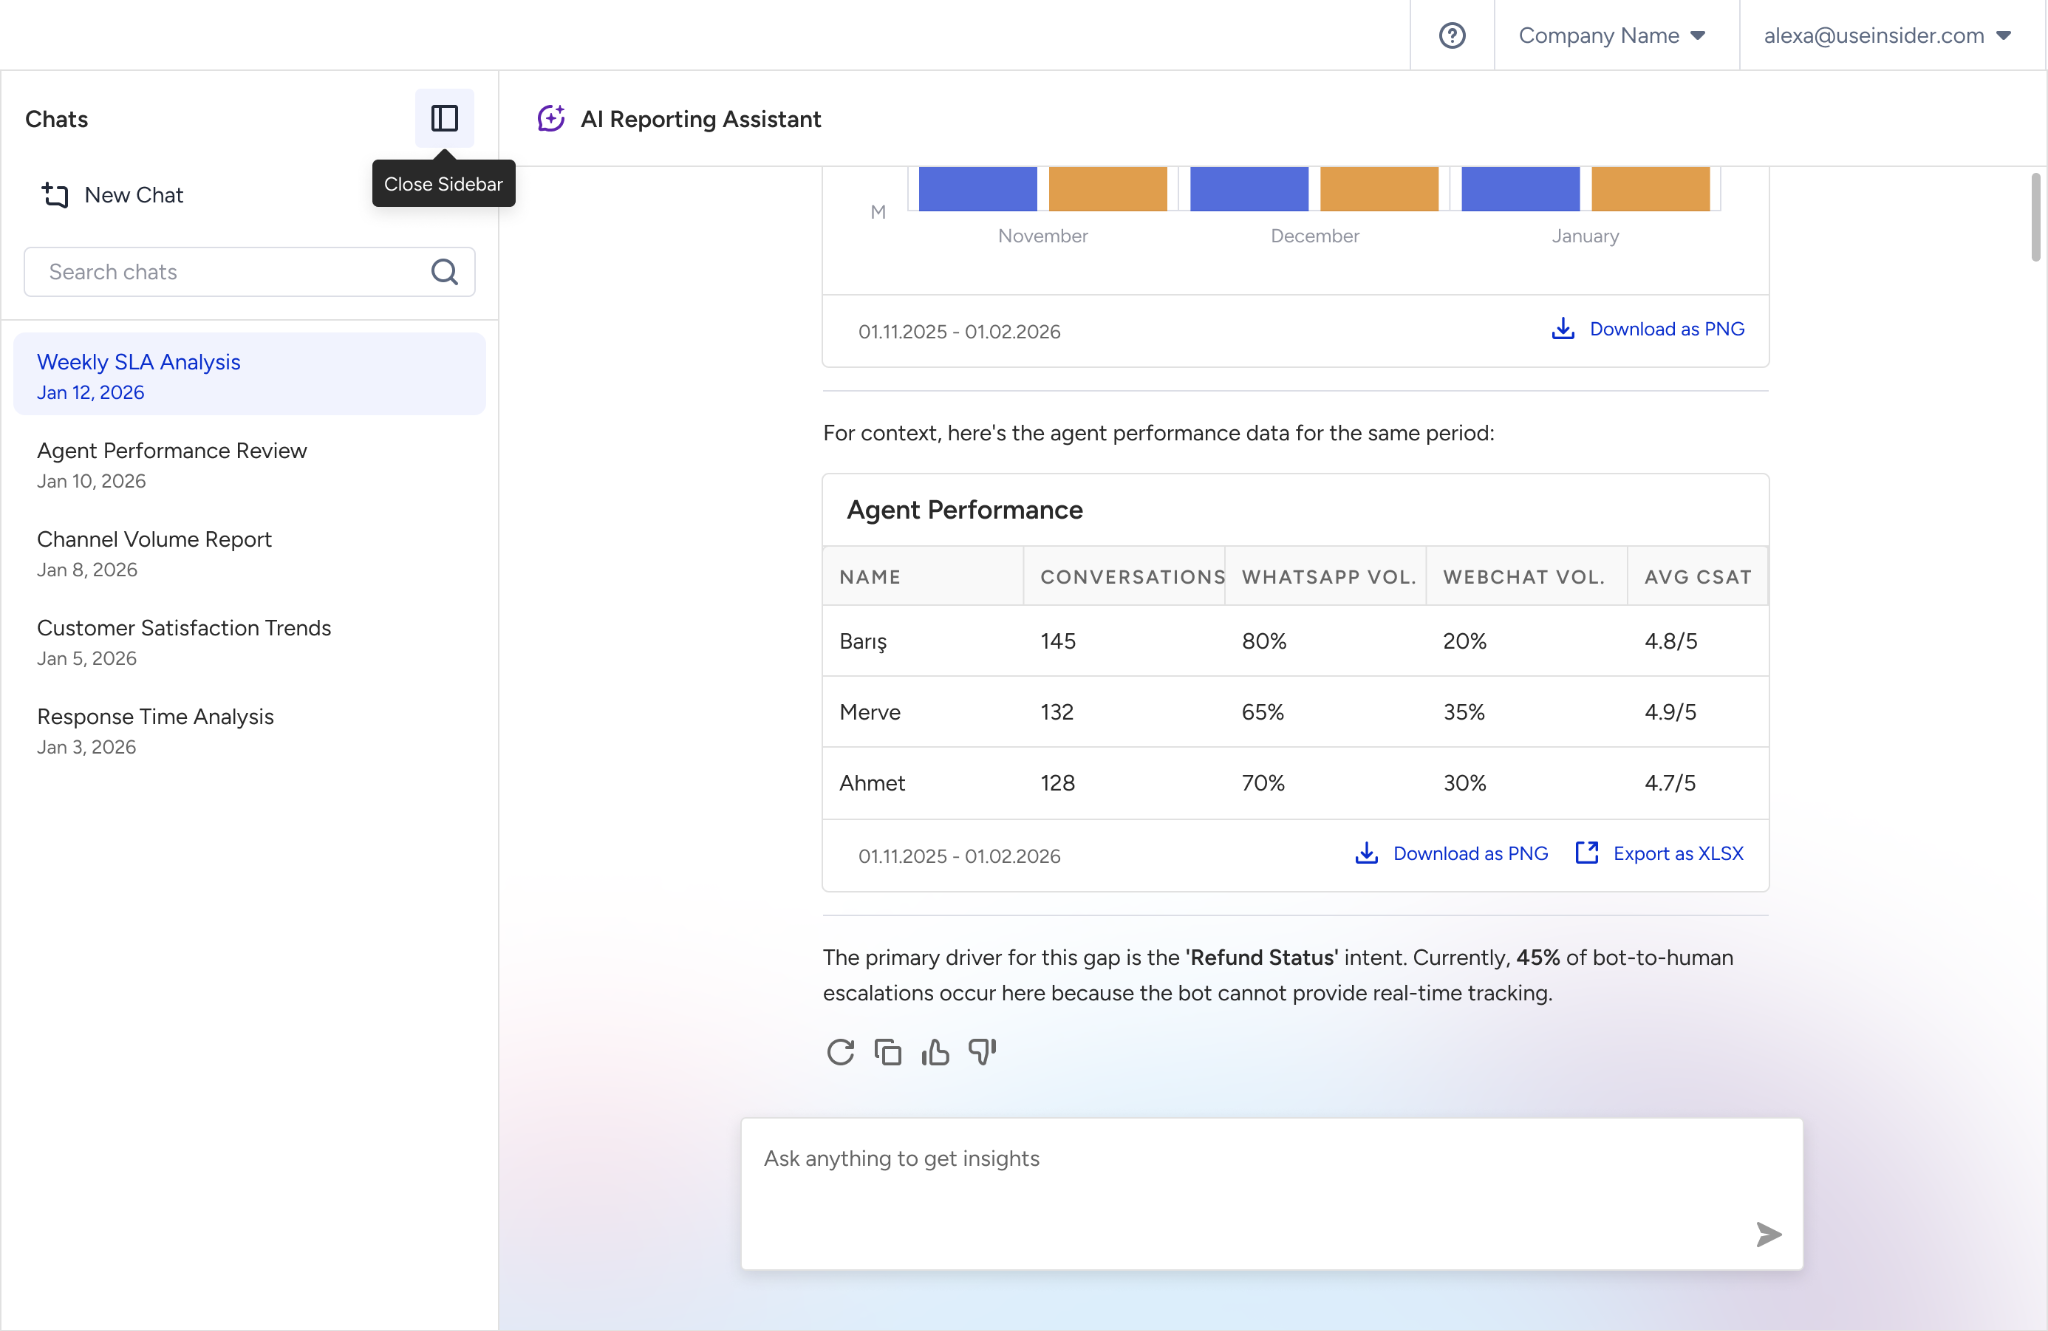
Your conversations are saved automatically. From the sidebar, you can reopen previous conversations, rename them, or delete them.
Ask reporting questions
You can ask questions in any language. The examples below provide guidance, but you do not need to use the exact wording. You can ask the same questions in your own words.
Analyze conversation volume and traffic
"How many conversations came in over the last 7 days?"
"Show the daily conversation volume for the last 30 days as a line chart."
"What is the conversation distribution by channel this month?"
"What is the conversation distribution by channel today?"
Analyze conversations by channel
"Give me the channel-based report for the last 7 days."
"How many conversations came from the WhatsApp channel this week?"
"Compare WhatsApp and web chat volume as a weekly trend."
Analyze conversations by department
"Show the department-based report for the last 7 days."
"What is the total number of conversations for my selected department over the last 7 days?"
"What is the average first response time by department?"
Analyze agent performance
"Give me the agent performance report for the last 7 days."
"Which agent responds the fastest?"
"Compare average CSAT scores by agent."
"Show the last 7 days' conversation list for agent [agent name]."
Analyze bot and assistant performance
"Give me the bot performance report for the last 7 days."
"What is the distribution of conversations completed in the chatbot versus escalated to live support?"
Analyze conversation tags
"Show the conversation tags report for the last 7 days."
"Show the distribution of conversations tagged 'Refund' as a pie chart."
"How many conversations tagged 'Refund' were escalated to live support?"
"How many conversations came in over the last 7 days by customer tag?"
Analyze customer satisfaction
"How has CSAT changed over the last 30 days?"
"How many customers gave a satisfaction score this week?"
"Show the conversations with a CSAT score over the last 7 days."
"List the number of low-CSAT conversations as a table."
Analyze SLA and queue performance
"Show the SLA report for the last 7 days by department."
"What is the average queue wait time this week?"
"How many conversations were abandoned in the queue last week?"
"Show the queue time trend by department."
Compare reporting periods
"Compare this week's conversation volume with last week's."
"Compare this month with last month."
Search and list conversations
"List the last 5 conversations."
"List the conversations ended by the customer over the last 7 days."
"Which conversation lasted the longest?"
"Show the conversations tagged 'VIP'."
Analyze conversation content and root causes
In addition to reporting conversation counts and metrics, AI Reporting Assistant can analyze conversation content within the selected scope and summarize why those conversations occurred. For example, you can use it to investigate the reasons conversations are escalated to live support.
"Give me more detail on the content of these conversations. Why are these requests reaching us?"
"What are the most common reasons order-tracking conversations are escalated to live support?"
"Group the root causes of last week's escalations under main themes."
"Which questions could the chatbot not answer in shipping-related conversations?"
"Summarize the most frequent complaint topics in low-CSAT conversations."
Review metric definitions
You can also ask AI Reporting Assistant to explain the metrics included in your reports.
"What does the average first response time represent?"
Interpret response formats
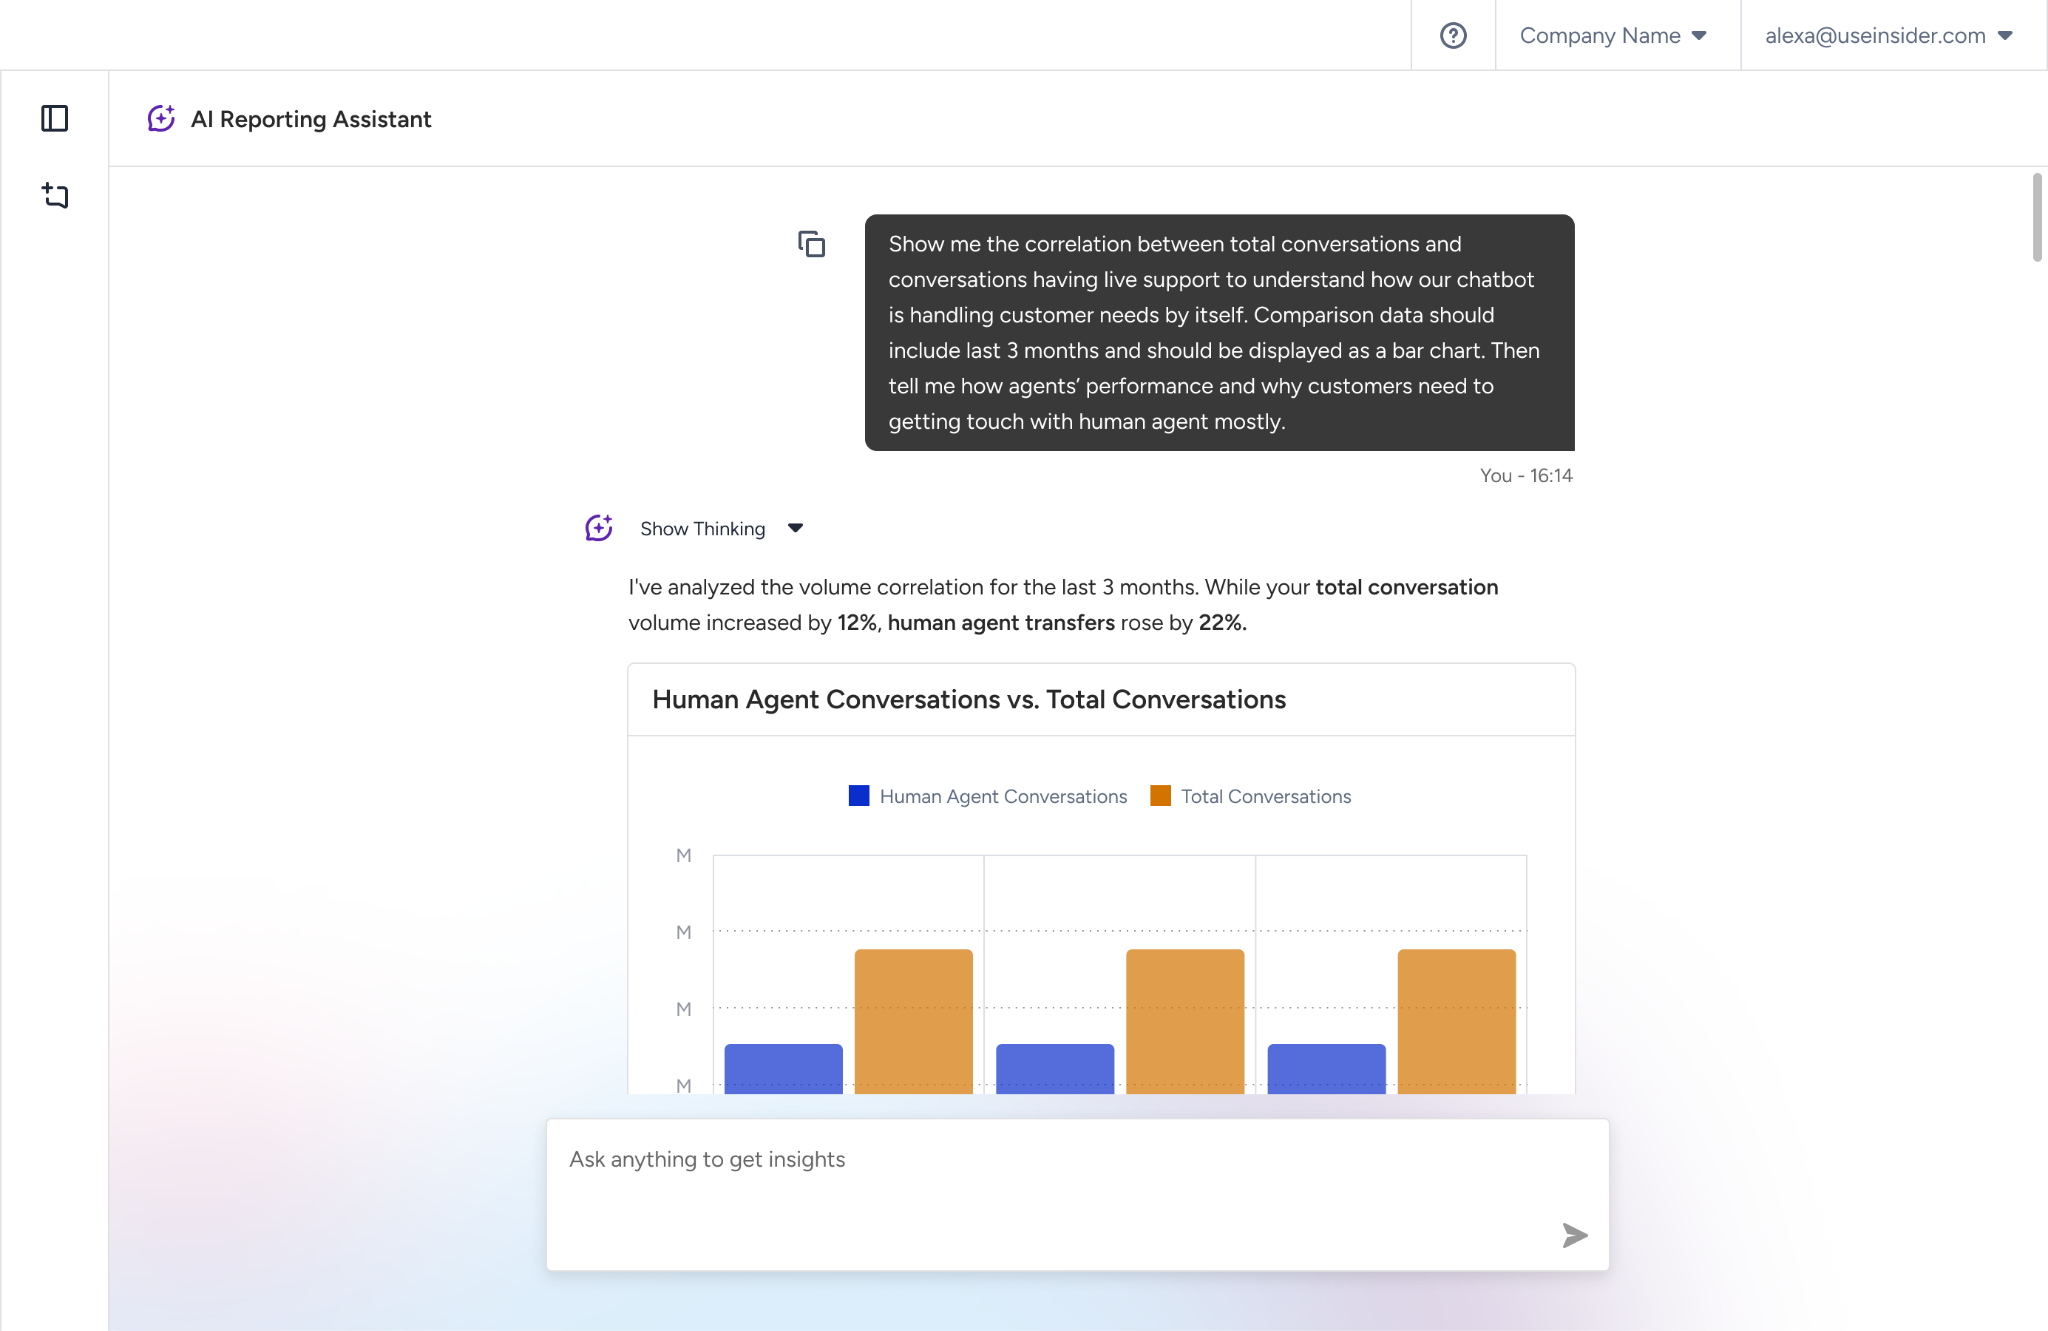
AI Reporting Assistant selects a response format based on the structure of the requested data.
Format | Used for |
|---|---|
Bar chart | Comparisons across categories such as agents, channels, or tags |
Line chart | Time series and trend analysis |
Pie chart | Proportional distributions |
Table | Multi-dimensional detailed data |
Text summary | A written summary included with every response |
You can also specify the format you want directly in your prompt. For example, you can add "show it as a line chart" or "list it as a table".
Interpret unassigned values
Rows labeled Unassigned, Untagged, or Unspecified represent conversations that do not have the corresponding grouping value. For example, a conversation might not have a department assignment or tag.
These rows represent actual conversations and should be included when reviewing totals.
Define reporting date ranges
If you do not specify a date range, AI Reporting Assistant uses the last 7 days by default.
You can define the reporting period directly in your question. For example:
"last 30 days"
"last week"
"this month"
"March 2026"
"between 12.02.2026 and 12.03.2026"
A single query can cover a maximum range of 30 days. If you request a longer period, AI Reporting Assistant automatically divides the query into smaller ranges and presents the combined results in one response.
Tip: Relative date expressions such as last week can be interpreted differently. When comparing AI Reporting Assistant results directly with the reporting panel, specify the exact dates, such as "between April 14 and April 20".
Export and save reporting results
You can export reporting results for further analysis or sharing:
Download tables as Excel files.
Download charts as PNG files.
Chat sessions are saved automatically. You can reopen previous conversations from the sidebar.
Improve reporting prompts
Use the following practices to get more precise and useful results from AI Reporting Assistant:
Provide specific reporting criteria. Instead of asking "give me a report", specify the report and period you need. For example, ask "give me the department-based conversation report for the last 7 days".
Specify the date range. Explicit dates can help you compare the results with other reports, especially when preparing recurring weekly reports.
Ask follow-up questions. AI Reporting Assistant uses the context of the current conversation. For example, after receiving a report, you can ask "now show this by channel as well".
Stop and rephrase long-running queries. You can use the stop button while waiting for a response, then rephrase your question.
Check the scope when results differ. If a result does not match the reporting panel, ask a follow-up question such as "which date range did you take this number from?" to confirm the scope of the result. You can also share feedback when you encounter such differences.
Understand current limitations
Keep the following limitations in mind when using AI Reporting Assistant:
AI Reporting Assistant retrieves data when you ask a question. It does not send proactive notifications.
It does not provide action recommendations. For example, it does not recommend actions such as increasing staffing on specific days.
It does not support file uploads, so you cannot import your own target KPI tables.
It does not share reports directly with other users. Download the relevant chart or table if you need to share the result.
Some multi-dimensional combinations are not supported in every scenario. For example, you might not be able to break down a report by both channel and tag at the same time.
Queries that include today's data can show small differences compared to the reporting panel because data continues to update in real time. Results for completed periods, such as last week, match the panel.
AI Reporting Assistant supports reporting and analytics-related questions. For requests outside this scope, it redirects you to its available analytics capabilities.
Protect reporting data
AI Reporting Assistant follows your existing role and department permissions. Each user can access only the data they are authorized to view.
By enabling AI Reporting Assistant, you agree to temporarily share your data with a third-party AI for processing. Your data is not stored or used for purposes beyond this processing.