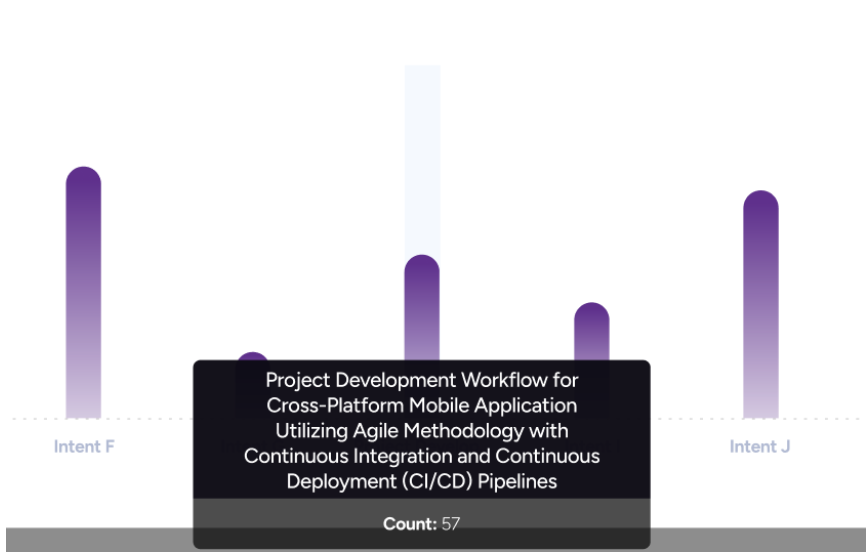
Conversation Reporting allows you to view detailed reports regarding the assistant's interactions with users. Filtering options enable you to analyze the data based on company, channels, and date. This analysis provides insights into how the assistant communicates with users, which channels are the most effective, and during which periods the assistant is most frequently used. This information enables you to make strategic decisions to enhance customer satisfaction and optimize the assistant's performance.
This guide aims to provide answers to the following questions:
- How can I navigate to the Conversation Reporting?
- How can I filter the results for the Conversation Reporting?
- Which graphs are available in the Conversation Reporting?
- What are the graph displaying options for the Conversation Reporting?
Navigate to the Conversation Reporting
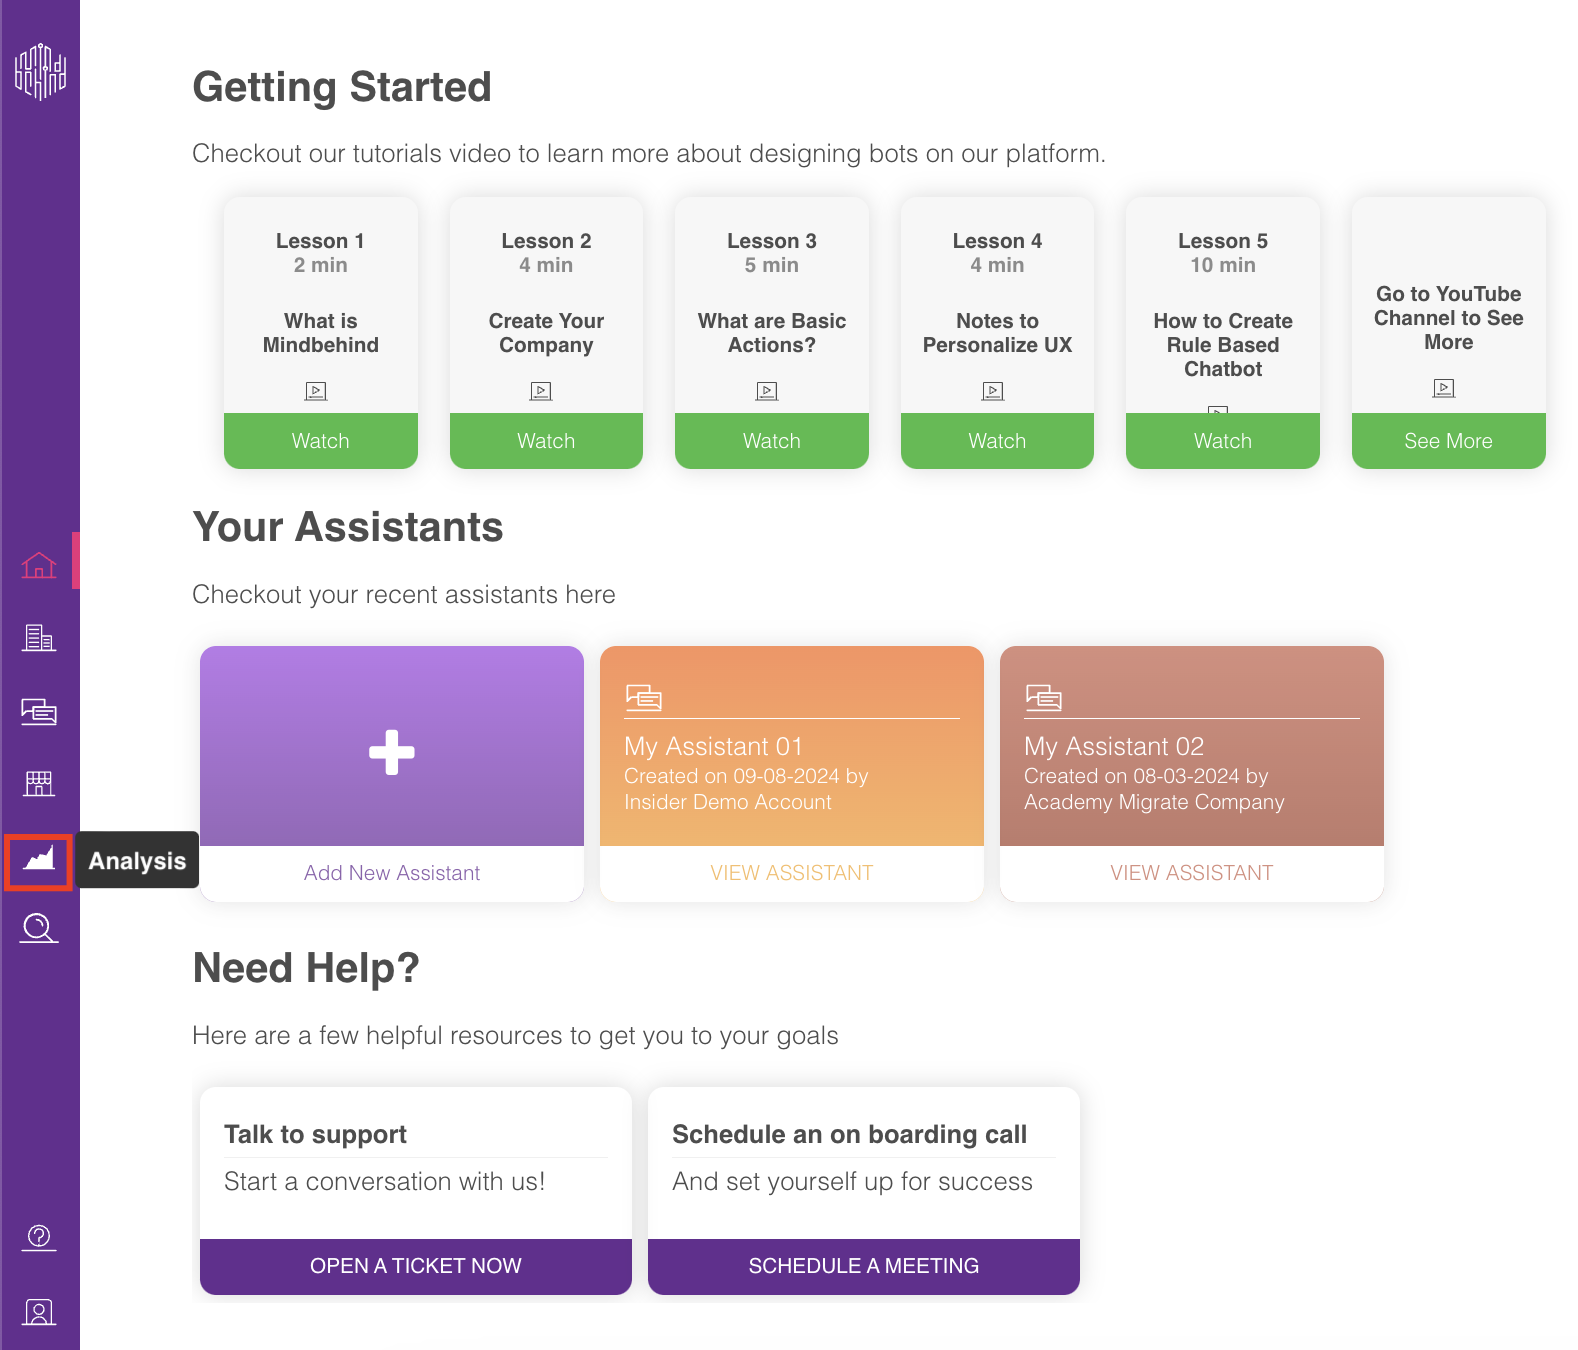
1. After logging in to your MindBehind Flow account, click Analysis on the navigation bar.
2. Click the Explore button in the Conversation Reporting box.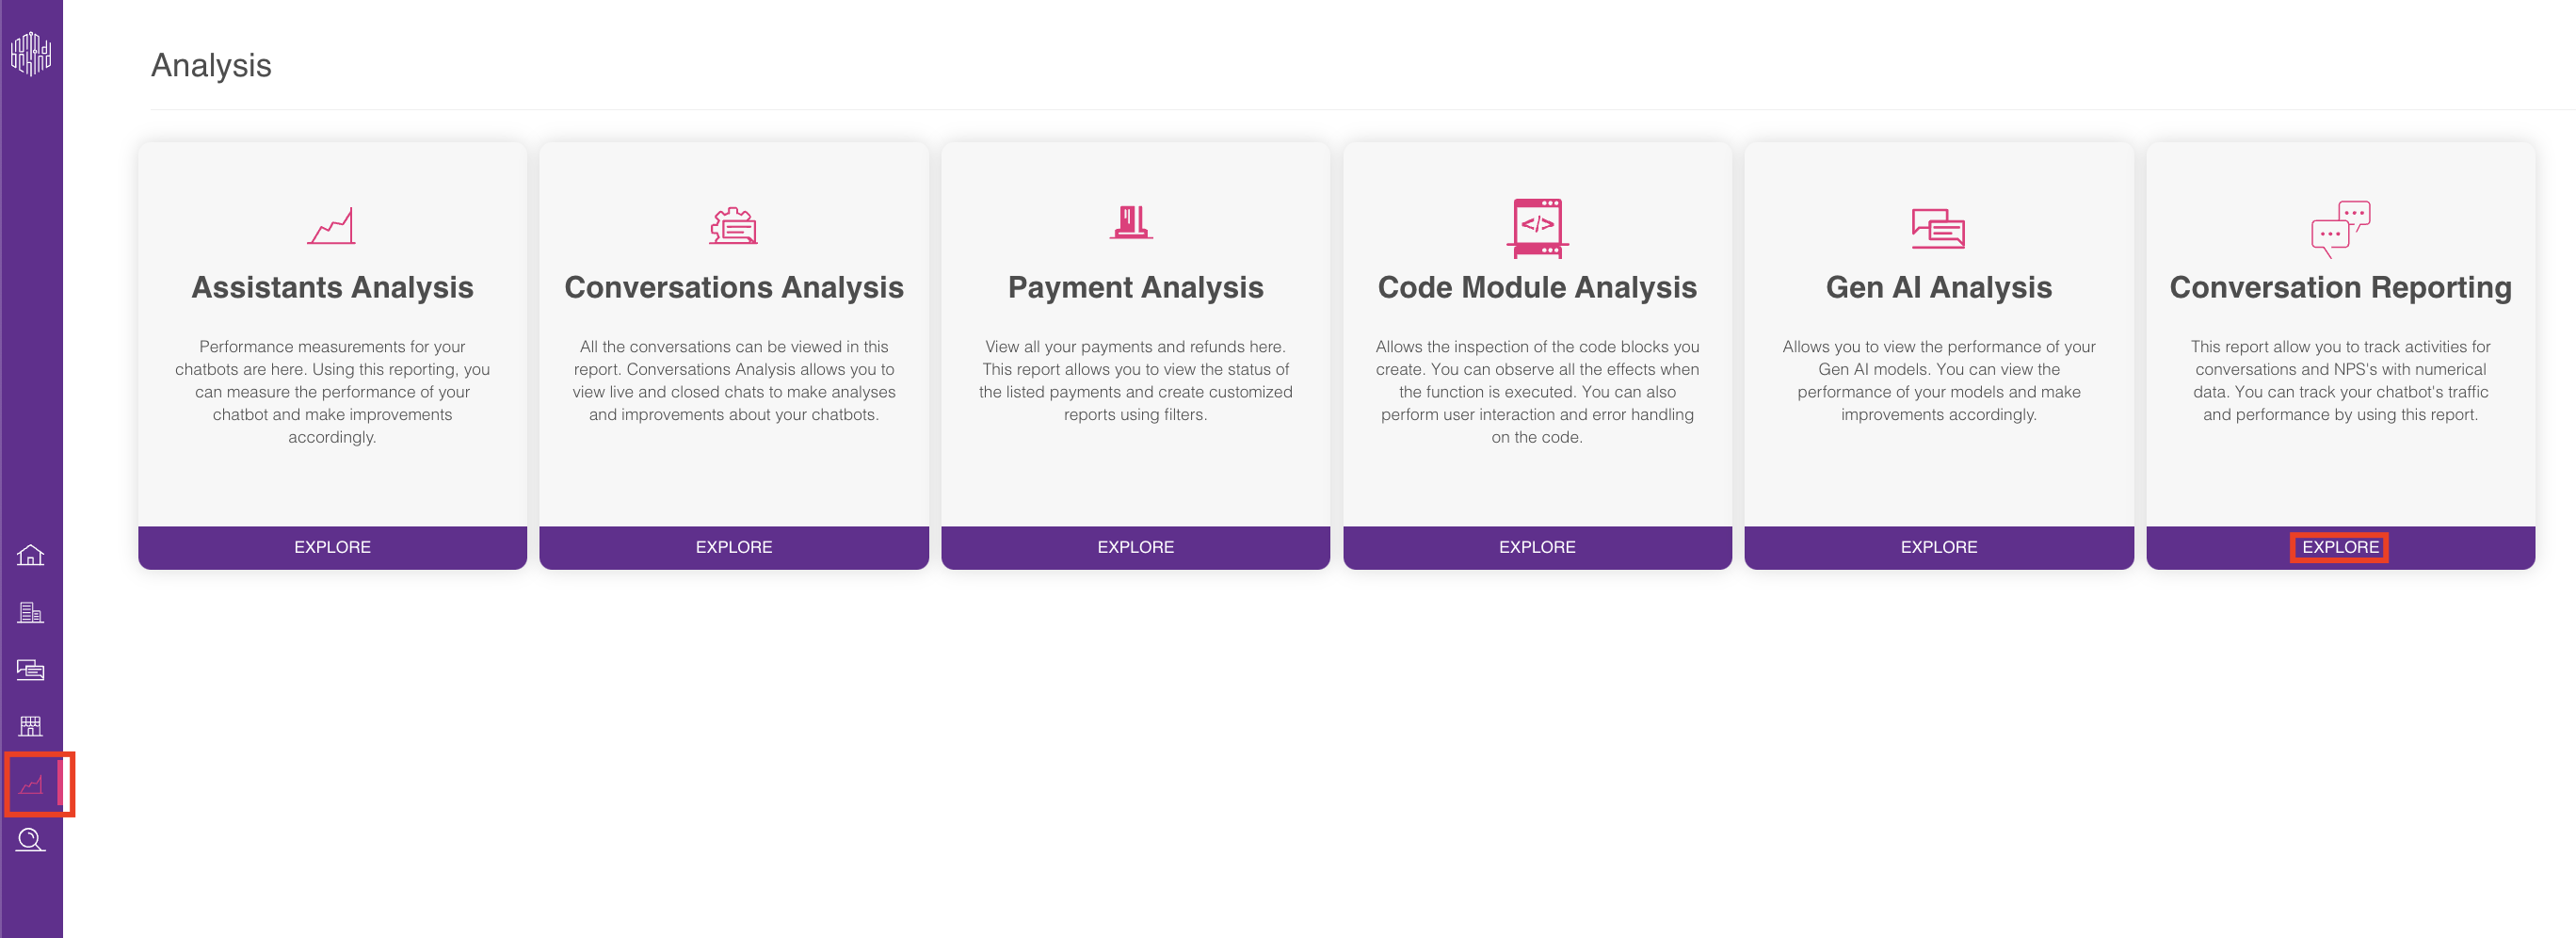
Filter results
You can select the relevant filters to generate reports accordingly. After you fill in the values in the mandatory fields, the Generate button below gets activated. You can only generate the reports for dates ranging from today to a maximum of two years in the past.
To generate your report, you should select the mandatory filters below:
- Company Name: It is the name of the company where the report will be generated. The company name can only be selected as a single value. You can only create reports for one company.
- Start Date: The date selected for when the reports start generating in DD/MM/YYYY format. The start date cannot be set later than the end date.
- End Date: The date selected for when the reports finish generating in DD/MM/YYYY format. The end date cannot be set as an earlier time than the start date.
- Channel Name: It is the selection where you can specify channel names from which you generate reports. The channel name is a multi-selectable component that allows you to select more than one.
Graphs
You can access the analysis on Total Conversations, Handled Conversations, Chatbot, and Agent Satisfaction in graphs to gain better insights on these topics.
Total Conversations
This graph provides a detailed view of the number of conversations initiated on your chatbots, broken down by channel type, daily. The calculation is made according to the count of chatbot conversations in specified channel names and date ranges in filters.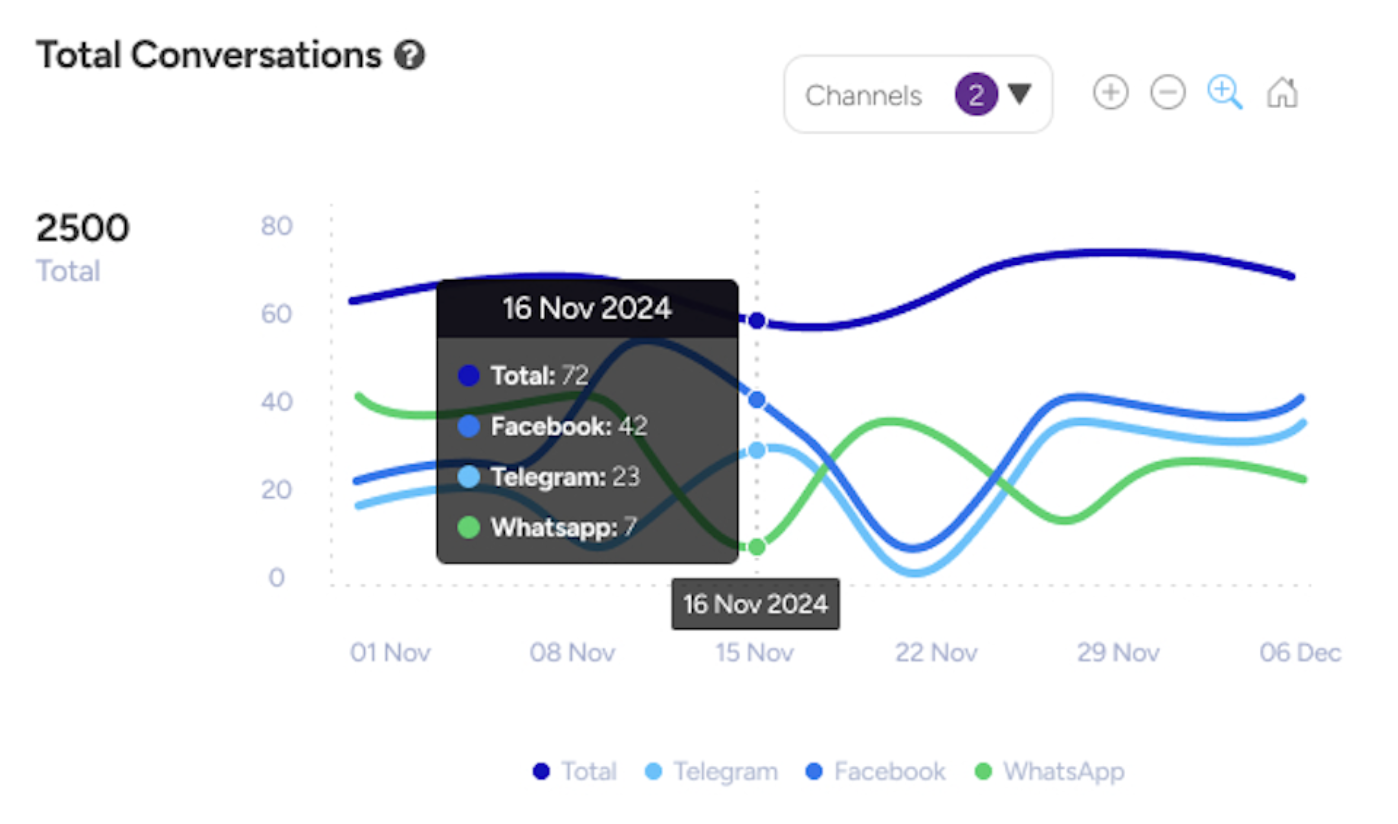
Handled Conversations
The Handled Conversations graph enables you to find metrics that distinguish between conversations that ended with the chatbot and those that were transferred and ended with an agent, giving you a clear picture of the handling process. 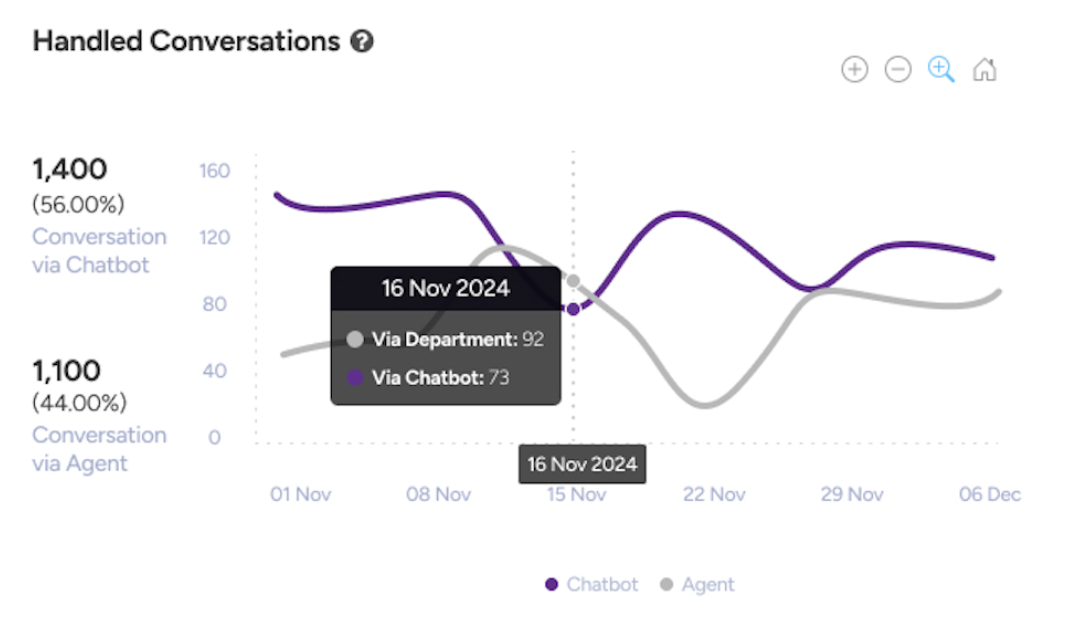
Chatbot Satisfaction
This metric showcases the satisfaction scores of conversations exclusively managed by the chatbot, as voted by the users. The calculation is based on the average satisfaction score of the conversations that ended in the chatbot without being transferred to the agent.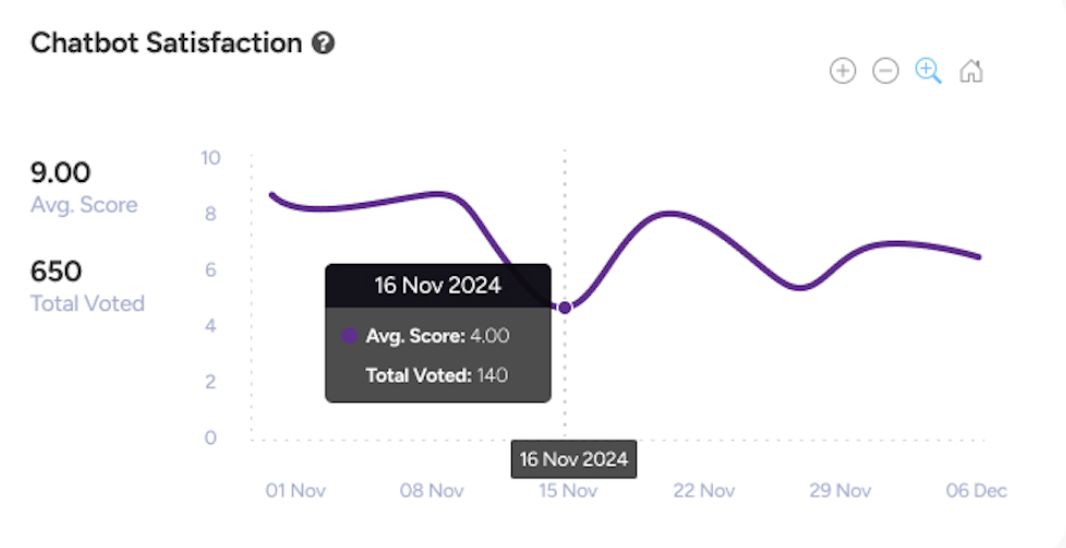
Agent Satisfaction
This section displays the satisfaction scores for conversations involving an agent based on user feedback. The calculation is made according to the average satisfaction score of the conversations that are ended after being transferred to the agent.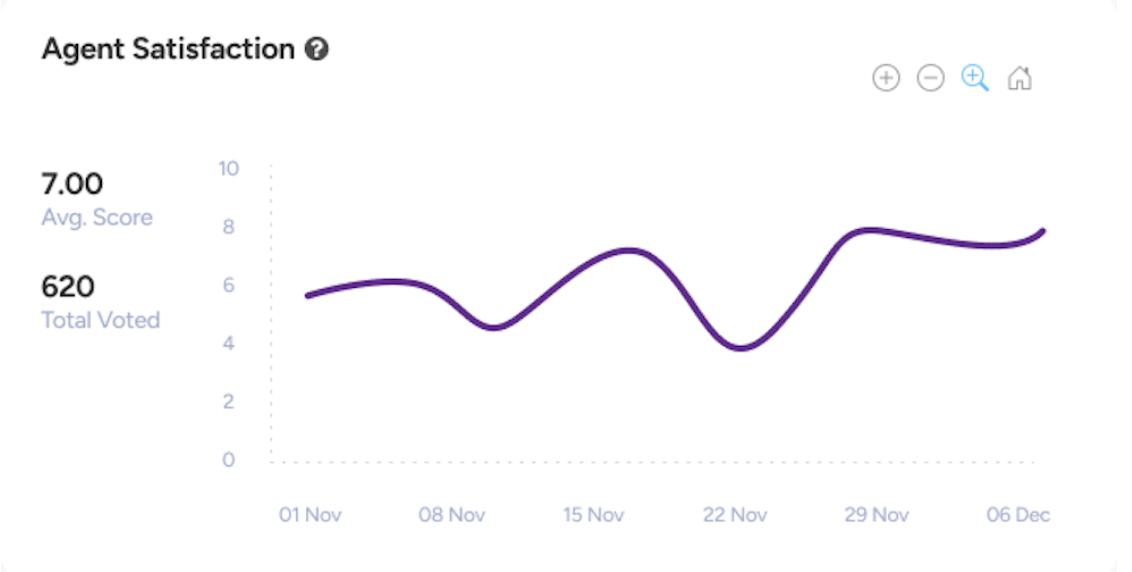
Graph Displaying Options
You have various display options for different charts in the graphs. These charts are:
- Line Chart
- Pie Chart
- Column Chart
Line Chart
In the line charts,
- You can use the buttons on the top right of the line charts to zoom in and out. You can click the Refresh icon to see the initially generated version of the graph. It is not possible to zoom into daily views since MindBehind does not support the hourly format of data displayed.

- You can scan a specific area on the graph with your mouse to zoom in.
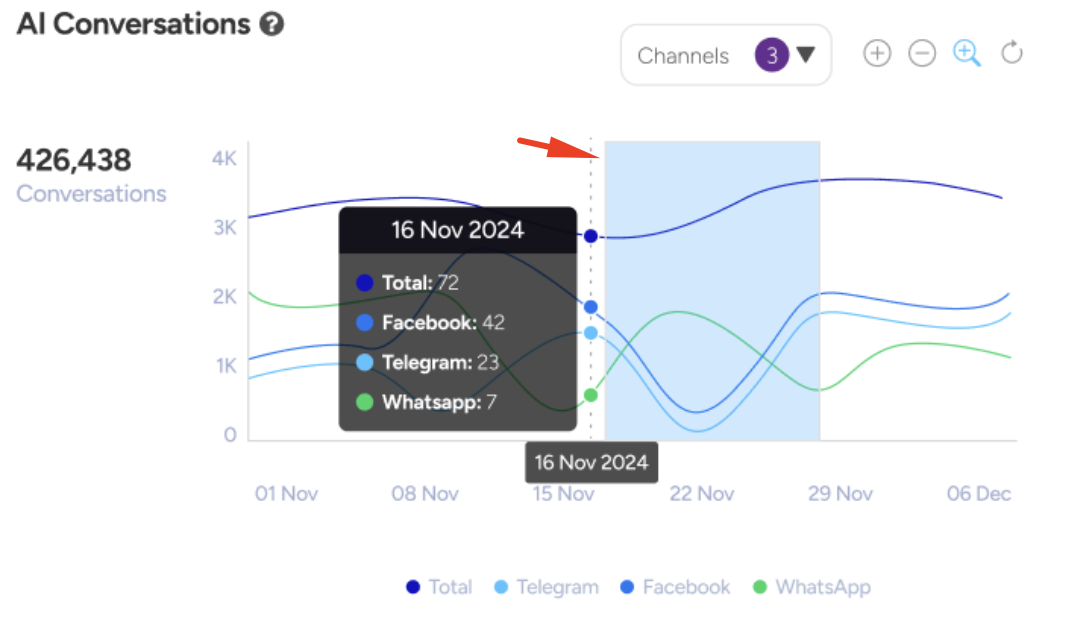
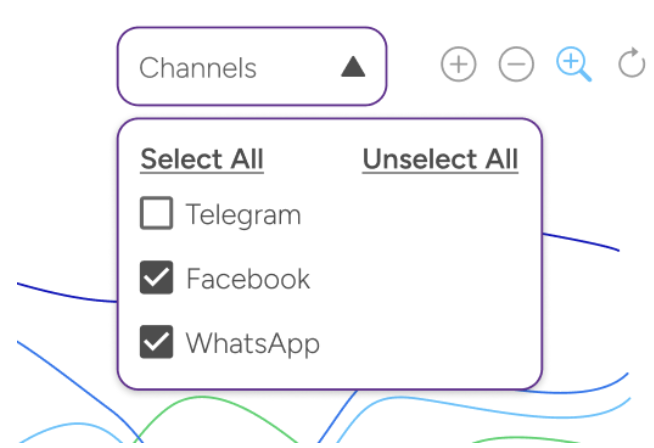
- You can select and deselect channel types in the Channels dropdown list in line charts to better understand the changes in the values across channel types.
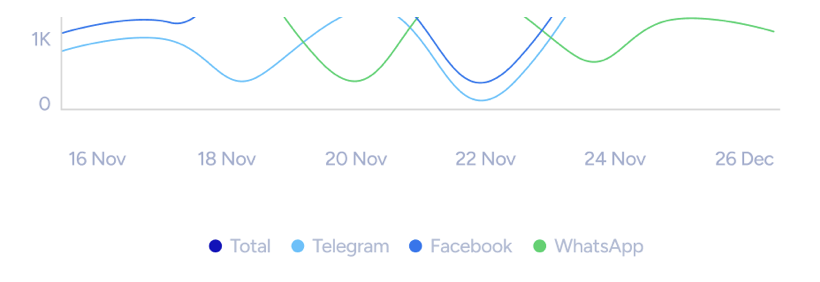
- You can also use the buttons below the chart to select and deselect channel types.
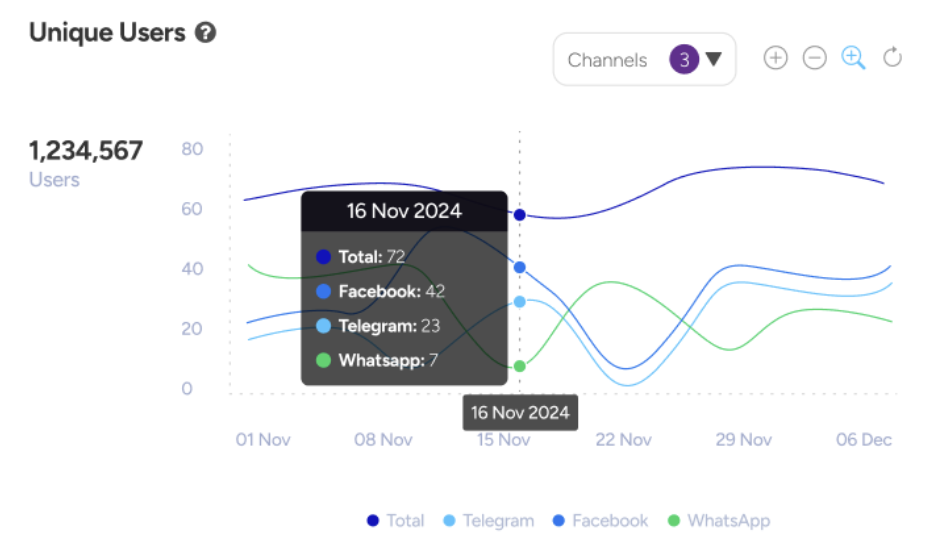
- You can hover over the line charts to see the daily graph details across channels.
Pie Chart
To see the ratios of the displayed values on the pie charts, you can hover over the related field of the graph.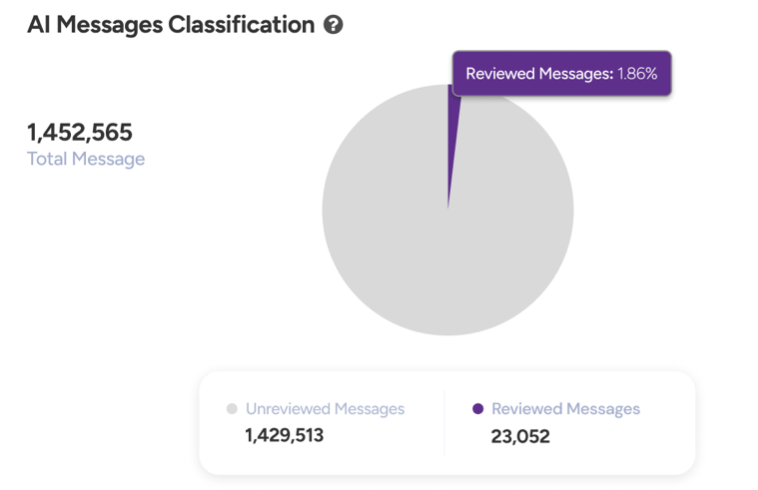
Column Chart
You can hover over the intent columns on the column charts to display the extended version of intent names and the number of their triggers.