The Usage Analytics Dashboard reports the assets that are subject to limits, if any are defined.
Tracked assets
Although customers now see a single unified MTU card, MTUs are calculated using activities coming from three sources:
Website interactions (Web)
Mobile app interactions (App)
First-party data updates (API integrations, segment uploads)
These sources are not displayed separately on the dashboard. The MTU card displays the combined total unique users tracked within the selected month.
Calculation logic
Web interactions
Users who perform qualifying activities on the website, such as:
Visiting the website
Product view / add-to-cart
Browser push interactions
App interactions
Users who perform qualifying activities in the mobile application, such as:
App visits
Browsing products
Push notification interactions
If the Web SDK is integrated into the website, the webview counts as web. If the app sends web events via a bridge, it is counted as app.
First-party interactions
Users whose profiles are updated via:
Third party integrations
Data points: Insider collects and stores various events and attributes for each partner, depending on their integration and products. These events and attributes are counted as data points. Depending on their contract, each customer has an allocated base for the data points that can be used monthly.
Architect volume: The total number of Architect journeys users entered.
Email volume: The total number of email messages sent to recipients in the selected month.
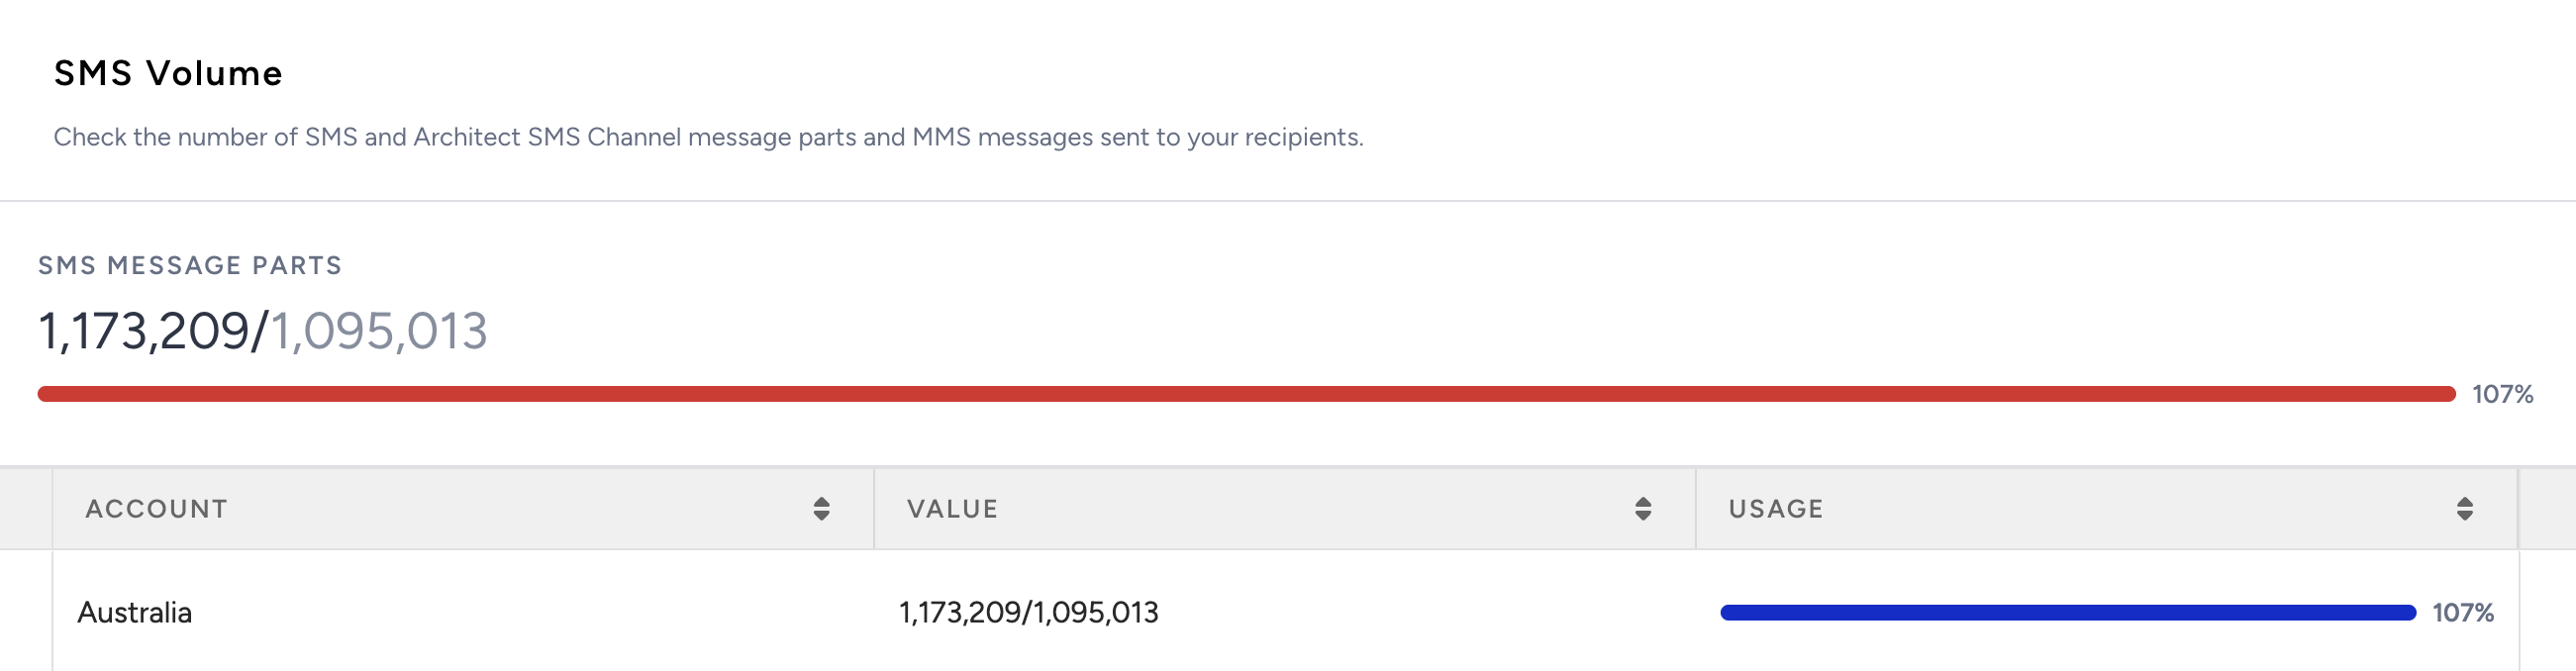
SMS volume: The total number of SMS messages sent to recipients in the selected month.
SMS usage analytics is based on SMS counts, showing the total number of parts in a single SMS message. Dropped messages are not reflected to the limit.
WhatsApp volume: The total number of WhatsApp messages delivered to recipients in the selected month.
WhatsApp usage is calculated based on the customer's time zone to align with the WhatsApp Meta usage panel.
For country-based SMS, MMS, and WhatsApp products, the contract term must be consistent across each product, such as monthly or yearly, for two countries.
Eureka search volume: The total number of search queries made by the end-users in the selected month.
Limit calculation
The limit consumption is calculated daily. If you exceed one or more usage limits, you will see a banner on the panel when you log in to your account and receive a respective email. You will have two types of alerts.
Each product card includes a tag indicating whether the limit is monthly or combined, making it easier for customers to understand the contract terms.
You can select and view historical usage data for months within the past 1 year.
The limit consumption is calculated and updated on the page daily.
Since assets and limits are defined by contract terms, the dashboard and notifications align with each product's limitation period.
If a product has a monthly limit, it will be displayed and tracked monthly.
If a product has a combined limit, it will be displayed and tracked on a contract basis.
If a customer has a mix of monthly and combined limits across different products, each product will be shown with its respective contract period.
If you have multiple domains, the total usage is tracked under a single contract-based limit. A breakdown per domain is available.
Customers with country-specific pricing will see a breakdown of usage by country.
Exceeded usage limits
The usage limits are based on your contract. If you exceed the stated limit, you will be charged for each additional unit of usage. To avoid this, you will see an alert on your banner.
1. When you exceed your usage limits for different assets, you will see a notification.
2. You can see the details on the Usage Analytics page.
.png)
3. You will also receive an email including the details. It looks like this:.png)
Approached usage limits
If you have used at least 80% of the limit, it means you are about to exceed it.
1. When you log in to the panel, you will see a reminder.
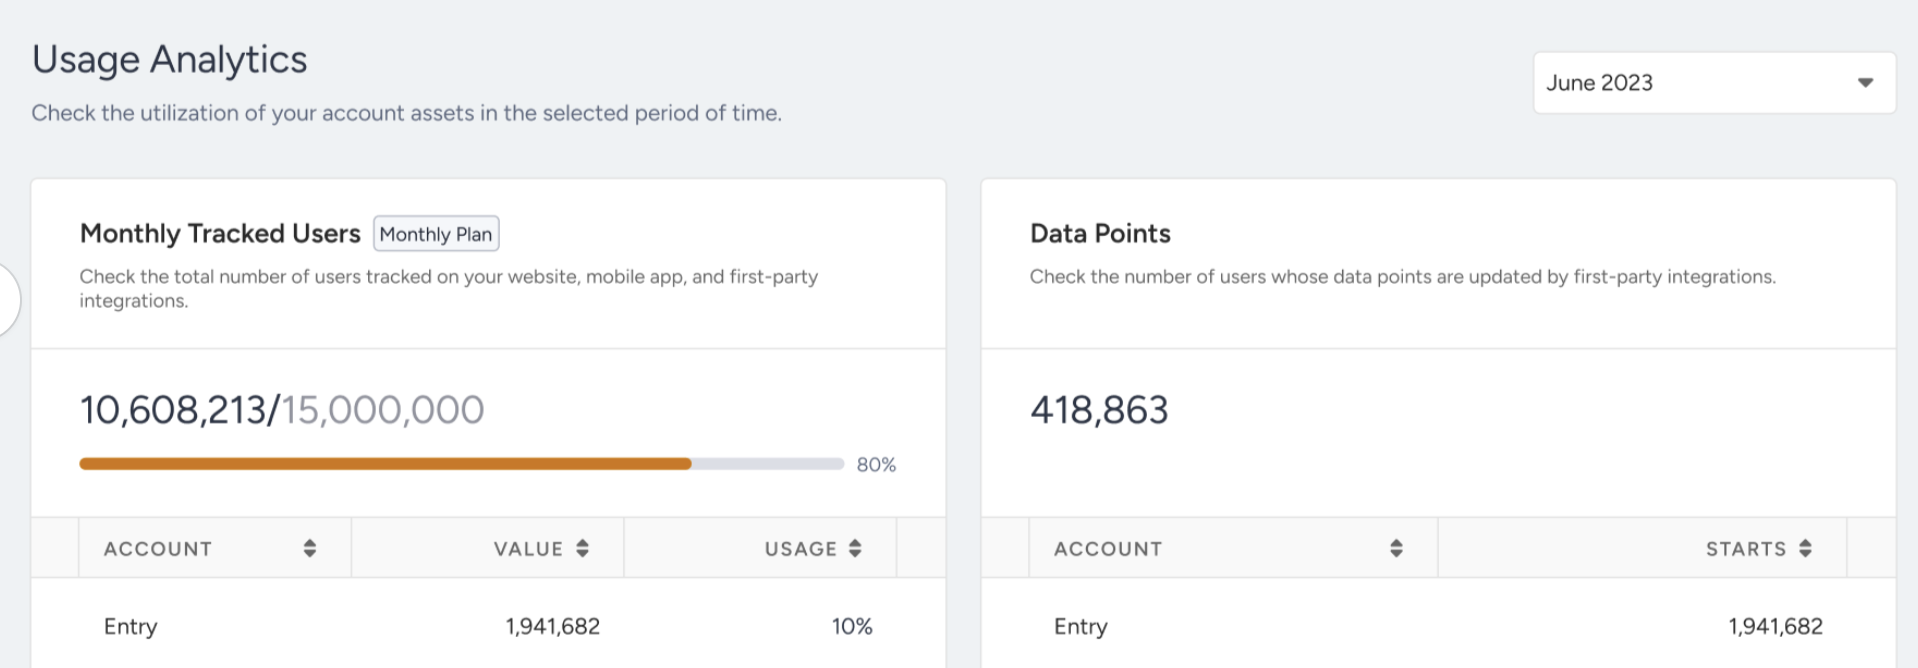
2. You can see the details on the Usage Analytics page.
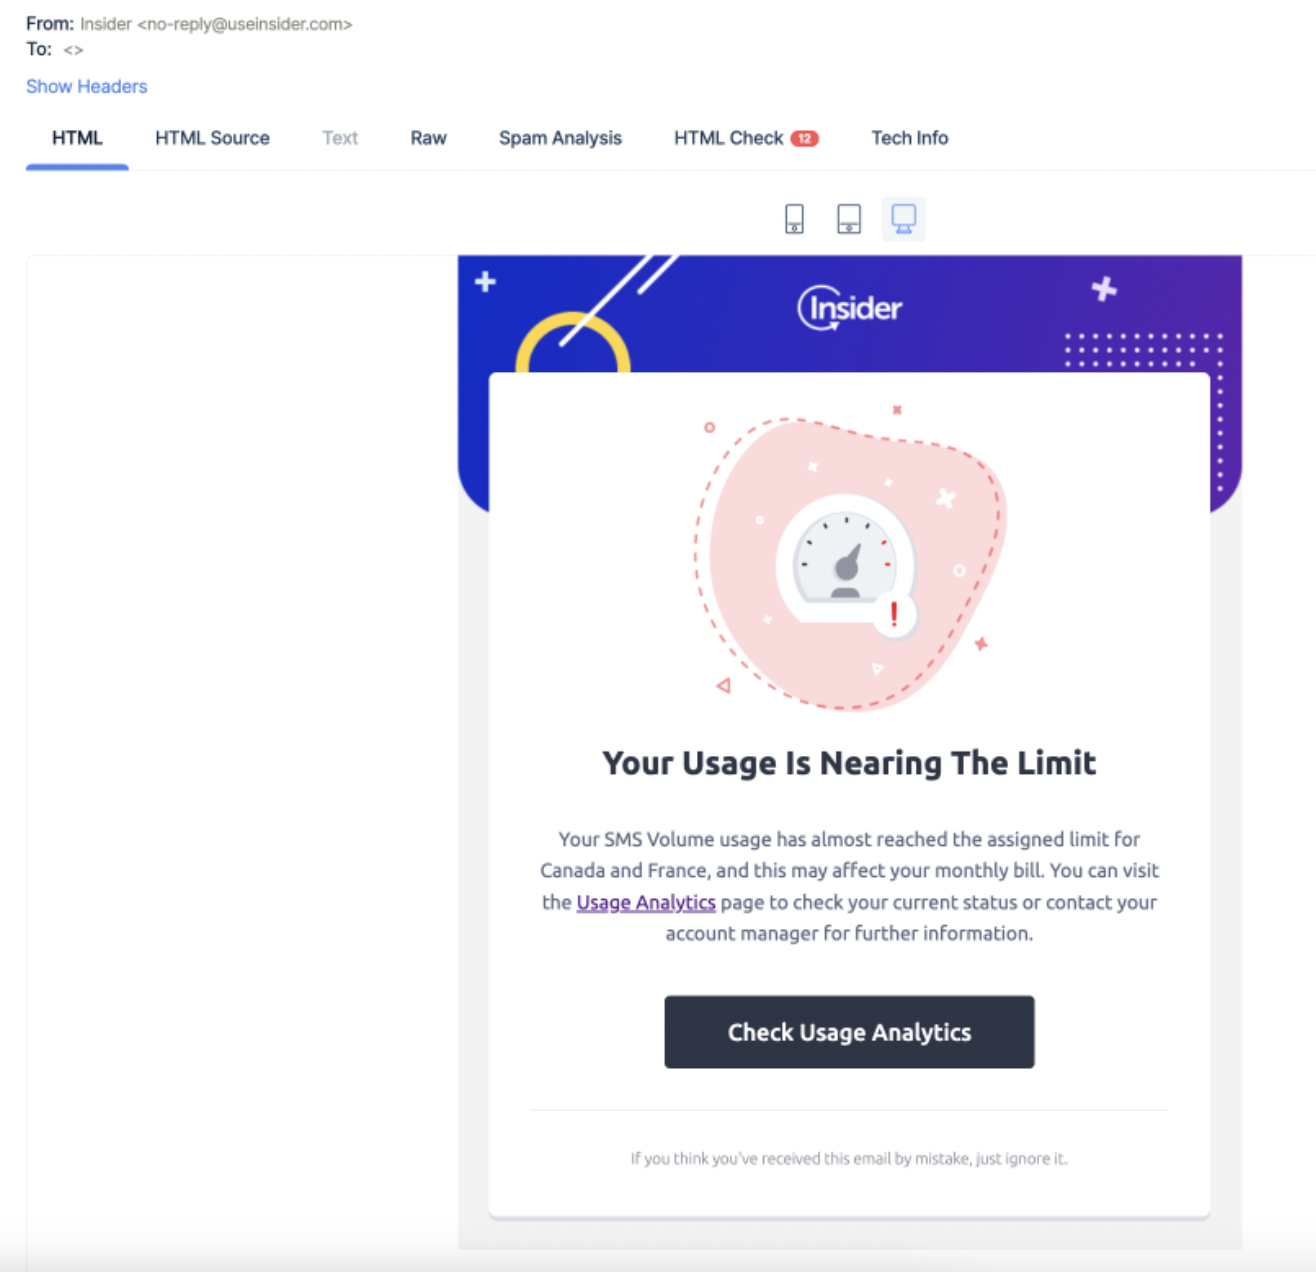
3. You will also receive an email including the details. It looks like this: