A/B testing is a widely used method in marketing to evaluate the effectiveness of various strategies, including launched marketing campaigns. Insider One's OnSite campaigns can enhance your business strategies. The key aspect of A/B testing lies in the analytics, which is crucial for obtaining accurate and precise results from the launched campaign.
Insider One utilizes two statistical test metrics or indicators to assess A/B tests: significance and probability to win. This article explains the following concepts:
Significance Level
The Significance Level (z-test) determines whether a statistically significant difference exists between the conversion rates of the variant and the control group. It represents how frequently we might observe a difference similar to the one in the data if there's no fundamental distinction between A and B. The test focuses on proving the alternative hypothesis that "the variant will have a higher conversion rate than the control group of the campaign."
The method of hypothesis testing with z-test
InOne employs hypothesis testing, a prediction made before an experiment specifying the expected change and anticipated outcome. In this context, hypotheses are divided into two components:
Variable: Editable website elements influencing the desired outcome, tested one at a time for meaningful results, such as placing an InStory template on your homepage.
Result: Predicted and desired outcomes, such as increased purchases using an InStory template. Analytics pages take the conversion criteria selected into account as the desired outcome.
Insider One uses z-testing to conduct hypothesis testing. This method allows us to compare the average of a sample to a known average of a whole group and determine whether the difference is significant. It is often used in tests with a large sample size.
A z-test helps us determine whether there is a meaningful difference in conversion rates between groups A and B.
Significance Level metric
The Significance Level is derived from the z-value calculated during hypothesis testing. Determined through this method, it indicates the readability of the results.
Any significance below 95% is considered insignificant and inconclusive, meaning the variant's performance cannot be confidently compared to the control group's.
Notes on Significance Level
Significance represents the probability of the alternative hypothesis being true. It should not be misinterpreted as the probability of the hypothesis itself, that 'Variation has a conversion rate greater than the control group.' Instead, the Significance Level only indicates whether the conversion rate differs between the variation and control groups.
The Significance Level can only be calculated if you also have the same metric of interest on the control group.
The significance value for multi-variant campaigns doesn't assess all variants simultaneously. Instead, each variant is individually evaluated by comparing it to the control group.
For Significance Levels that have not yet reached 95%, fluctuations are normal. As data is collected, the correlation of impressions and conversions, and the difference between the variant and control group, can change. We expect the results to stabilize as the campaign's duration increases. For example, if you check a campaign with 70% significance and then a few days later, it's 40%, we do not anticipate that the significance value will gradually increase over time as more data is collected.
Probability to Win
The Probability to Win determines the probability that B will beat A in the long run. It shows which variant will be the winner. Its goal is to determine the probability that the variant launched beats the control group on the set conversion criteria, with the answer represented by the Probability to Win percentage.
Focus on continuous learning involves updating beliefs about a parameter based on new evidence. This process uses Bayes' theorem, a method that combines existing knowledge or beliefs (past data collected) with new information (newly collected data) to update the probability of achieving the conversion goal.
The Bayesian approach method
The Bayesian approach to A/B testing employs Bayes' theorem to continuously update and refine our beliefs regarding the performance of different variants as additional data is gathered. Unlike traditional frequentist statistics, Bayesian A/B testing offers a probability distribution for the actual effect size of a variant, enabling testers to evaluate results before reaching a significant sample size.
This iterative approach facilitates ongoing, data-driven decision-making regarding the most effective variant and allows for flexibility as more data accumulates over time. With increased data collection, the probability distribution becomes more defined and centered around the observed value.
Probability to Win metric
The Probability to Win evaluates how well a tested variant performs in achieving a selected conversion goal compared to other variants, including the control group. It acts as a measure of the likelihood of success for a particular variant. This probability is calculated by considering both the variant's sample size (determined by the number of impressions) and its Conversion Rate (CR), which quantifies its success rate.
You can anticipate that if the Conversion Rate (CR) is higher, the variant will exhibit a positive CR uplift. Additionally, if the sample size is sufficiently large, you can expect a higher Probability to Win percentage.
Notes on the Probability to Win
The Probability to Win is calculated for all variants simultaneously, given each variant's winning probability. So you would expect the Probability to Win values of all variants, including the control group, to add up to 100%.
Statistically, a Probability to Win between 70-100% is an acceptable range for concluding an A/B test, based on testers' preference for accuracy. However, this contains the risk of incorrectly completing the test with a false positive result. To avoid incorrect conclusions, the recommended benchmark, mathematically and in the market, is 95%. That is why Insider One takes a 95% Probability to Win as the determiner of a winner result.
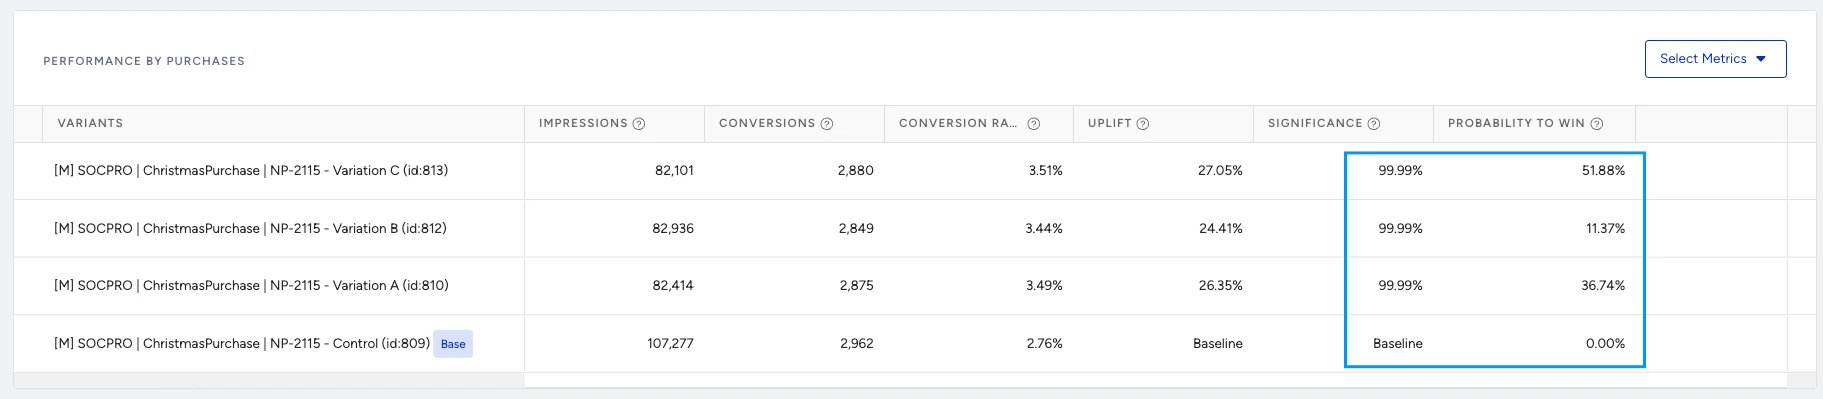
For multi-variant campaigns, since the Probability to Win is divided into more variants, the Probability to Win percentages will be lower than those of the A/B tests. In these cases, if Significance Levels have reached 95%, you can conclude that the variant with the largest Probability to Win percentage is the winner. This is statistically acceptable.
Evaluate results with Significance and Probability to Win
In the context of example cases within InOne, you should interpret the two metrics as follows:
Significance Level: Validates the A/B test being conducted and indicates the conclusiveness of the current results for comparison.
Probability to Win: Evaluates how effectively the variant performs in achieving the selected conversion goal compared to other groups.
Probability to Win shows us the percentage possibility of the variant winning, assuming that there is a 95% level of significance for the campaign. This way, Insider One can project the possible conclusion once enough results have been collected. Therefore:
If the Significance Level exceeds 95%, we can conclude that the campaign yields accurate and stable results, making the Probability to Win calculation definitive in determining the winning variant. With the Significance Level reaching 95%, the calculated CR Uplift and Probability to Win are precise for the campaign.
If the Significance Level falls below 95%, we cannot yet conclusively determine whether a variant significantly outperforms others. However, the Probability to Win can serve as a projected or estimated value, indicating potential experiment outcomes once sufficient data is collected. This allows our analytics to have an additional metric for assessing and monitoring ongoing performance while the campaign is active and data collection continues.
Winner and loser selection
Winners or losers for variants are defined in the following conditions within the Insider One's InOne panel:
A variant is labeled as “Winner” if
Significance 95% or higher.
Conversion rate uplift is positive.
Probability to Win reaches an outstanding 95% or higher.
A variant is labeled as “Loser" if
Significance is 95% or higher.
Conversion rate uplift is negative.
Any other scenario where the Significance Level does not reach the 95% threshold should be considered "non-conclusive." This indicates that the experiment needs more data to yield a reliable, promising outcome, avoiding potential misinterpretations and premature conclusions.
Example cases
1. If the Significance Level is close to 0%, it indicates that the conversion rates of the control and variant groups are similar. In such cases, the test is considered inconclusive and should be allowed to continue running until a higher Significance Level is achieved.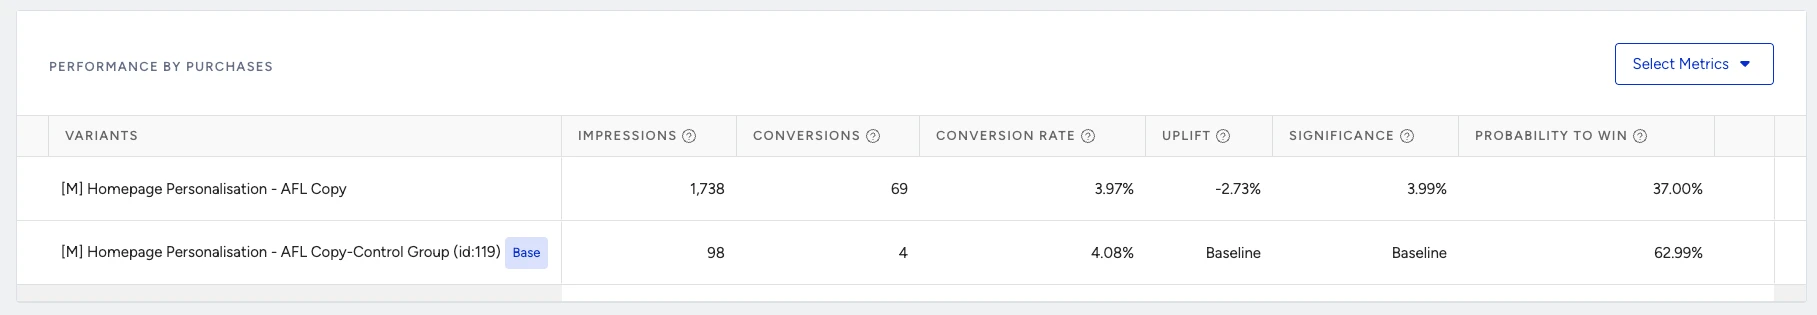
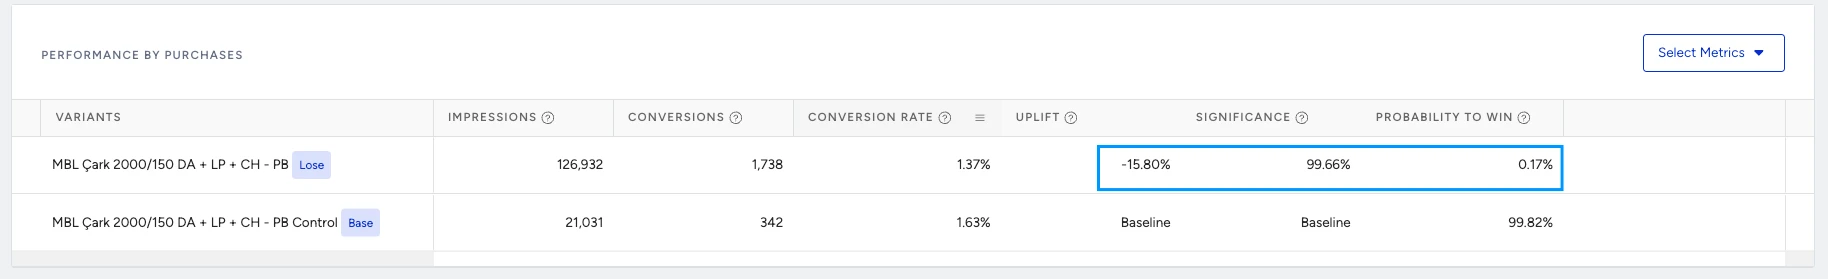
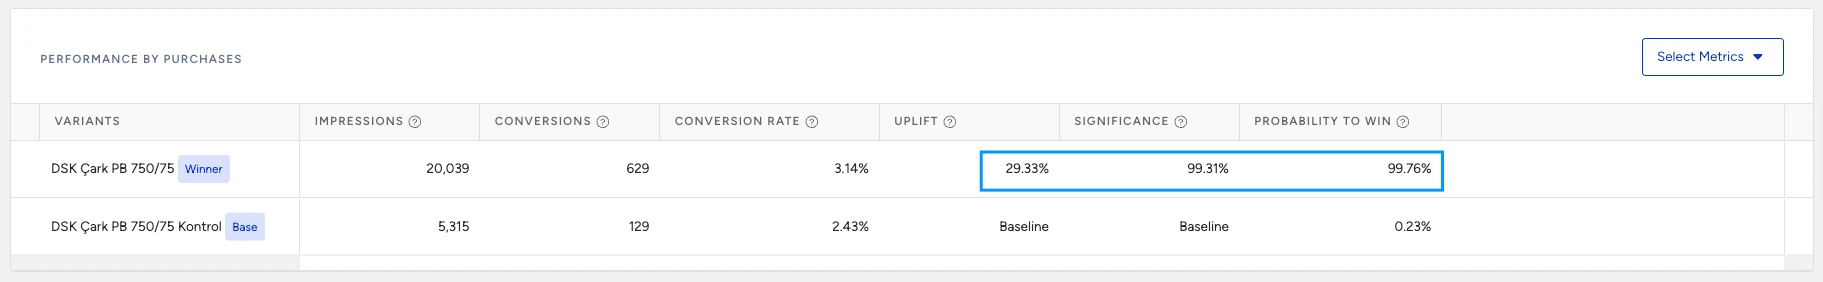
2. Conversely, if the significance is near 100%, it presents two scenarios:
If the CR uplift is negative and/or the Probability to Win is close to 0, the variant group's conversion rate is lower than that of the control group. In such cases, the variant is concluded to be a loser.
If the CR uplift is positive and/or the Probability to Win is high, it implies that the control group's conversion rate surpasses that of the variant group. In such cases, the variant is concluded to be a winner.
3. Even slight differences in conversion rates can provide significant conclusions regarding which variant is performing better, especially when there are many impressions. When the calculation considers the amount of data collected, the significance can reach a level above 95% even with close CR Uplift rates. This is still expected to be accurate since the sample group is large enough to draw a conclusion.
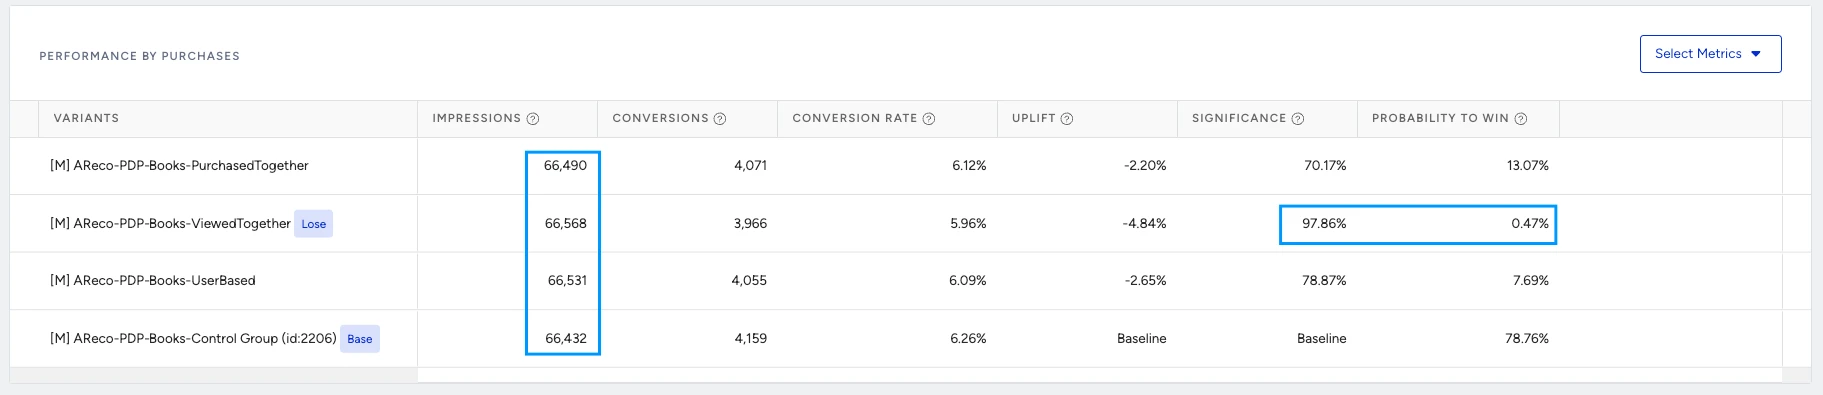
The “View Together” variation has collected enough data showing a significant difference from the control group to be declared a loser. Other variants show a low Probability to Win, indicating that they will also be declared losers. However, it has not yet reached a level of significance to be conclusive.
4. While a variant might show a high winning Probability percentage, it doesn't necessarily imply conclusive results. The Significance Level may be low due to the absence of significant differences in conversions and overall performance among the variants. Slight variations between impressions and conversions often render these experiments inconclusive for our relevant goal, making probability-to-win results merely an estimation.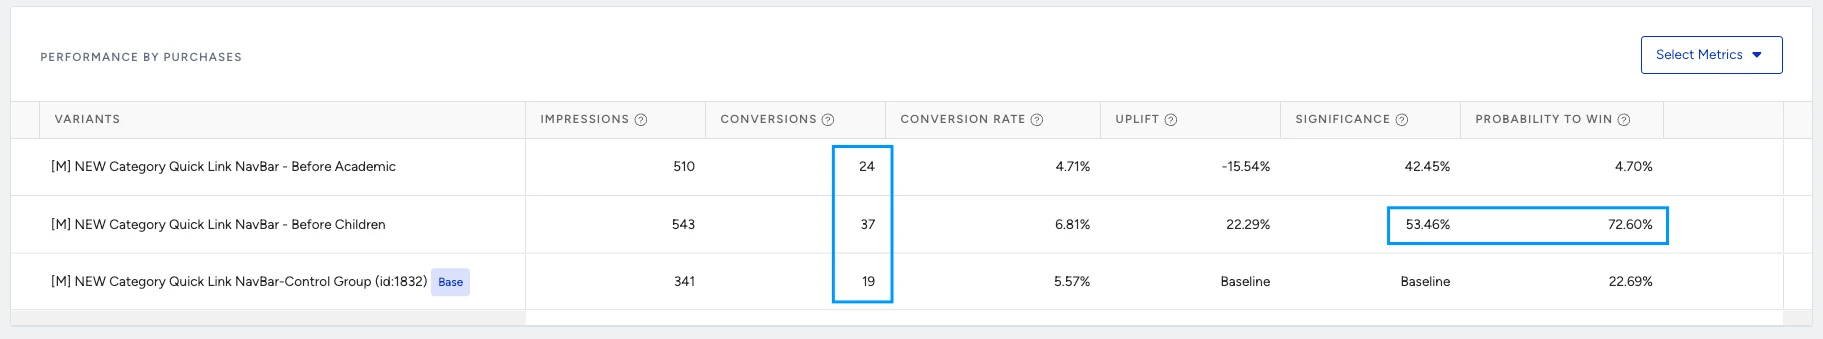
The ”Before Children” variant is expected to be the winner; however, this expectation can be false considering the low sample size. No winner/loser has been declared yet.
5. Although allocation is dispersed equally among variants, a variant group can generate significantly more conversions compared to the other variants. These are usually cases where the variant has received fewer impressions but generates more conversions.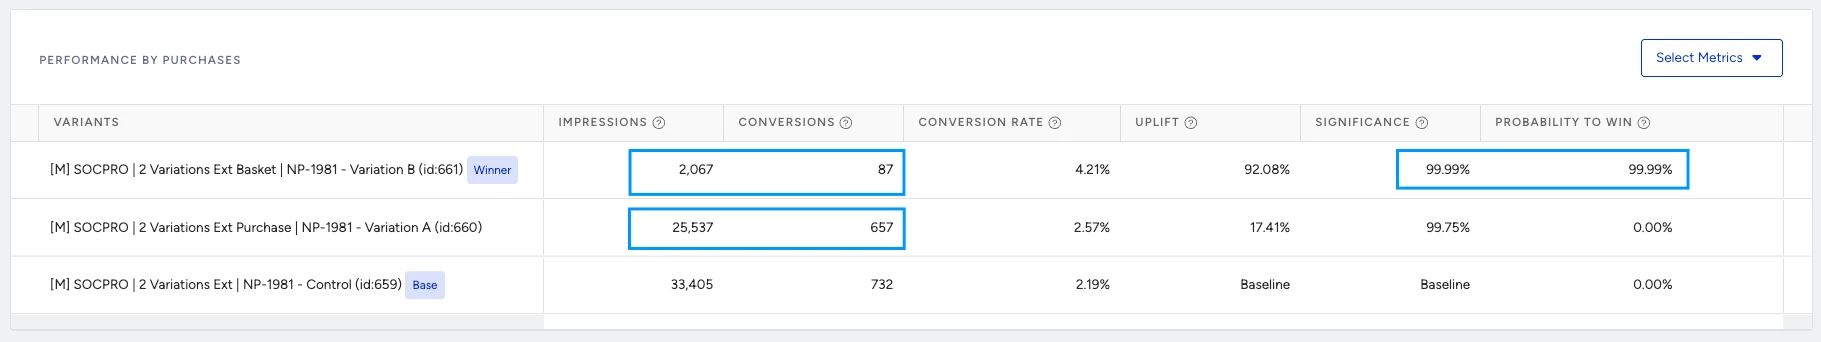
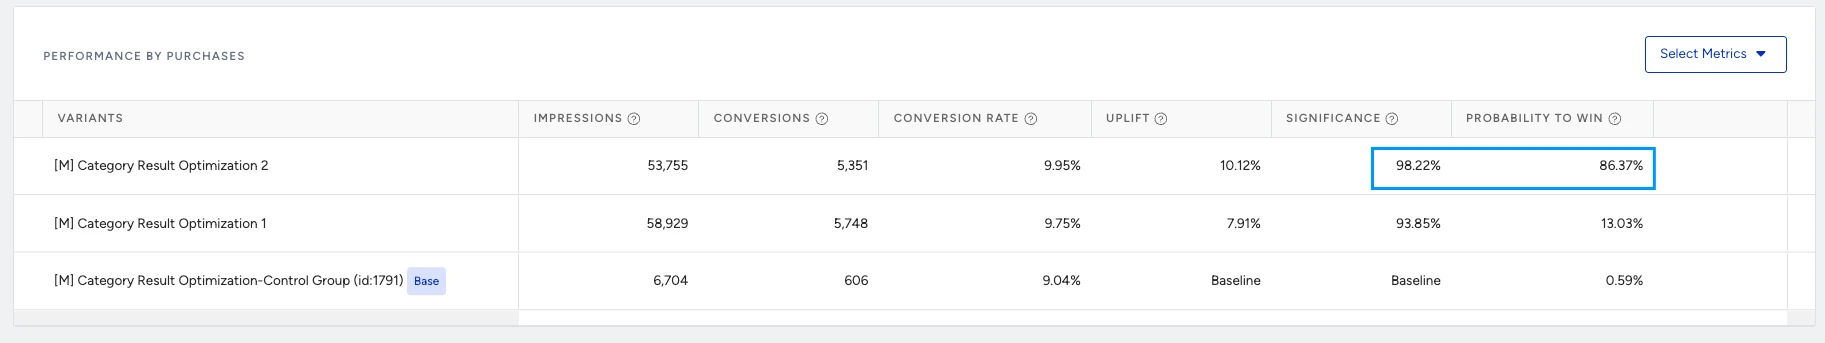
6. In cases where the Significance Level is higher than 95%, but the Probability to Win is lower than 95%, the test will remain inconclusive without declaring a winner or loser. This indicates that the observed difference in CR Uplift is not significant enough for an accurate calculation.
However, statistically speaking, it is acceptable to draw a conclusion with a Probability to Win between 70-100%, depending on the user's desired precision level. This consideration is critical in multi-variant campaigns where multiple variations are being compared simultaneously.
If the Probability to Win is higher than 70%, the variant can be reported as the winner, depending on the case, considering there is still a low chance the results will fluctuate.
If the Probability to Win is lower than 70%, it is not advisable to report the variant as the winner. These tests are likely to remain inconclusive even with extended campaign durations, resembling A/A tests.