Audience Analytics enables you to better understand your audience. It showcases many insightful pre-defined metrics amongst the various audience segments created within Insider One's InOne panel.
To have Audience Analytics enabled for your account, reach out to the Insider One team.
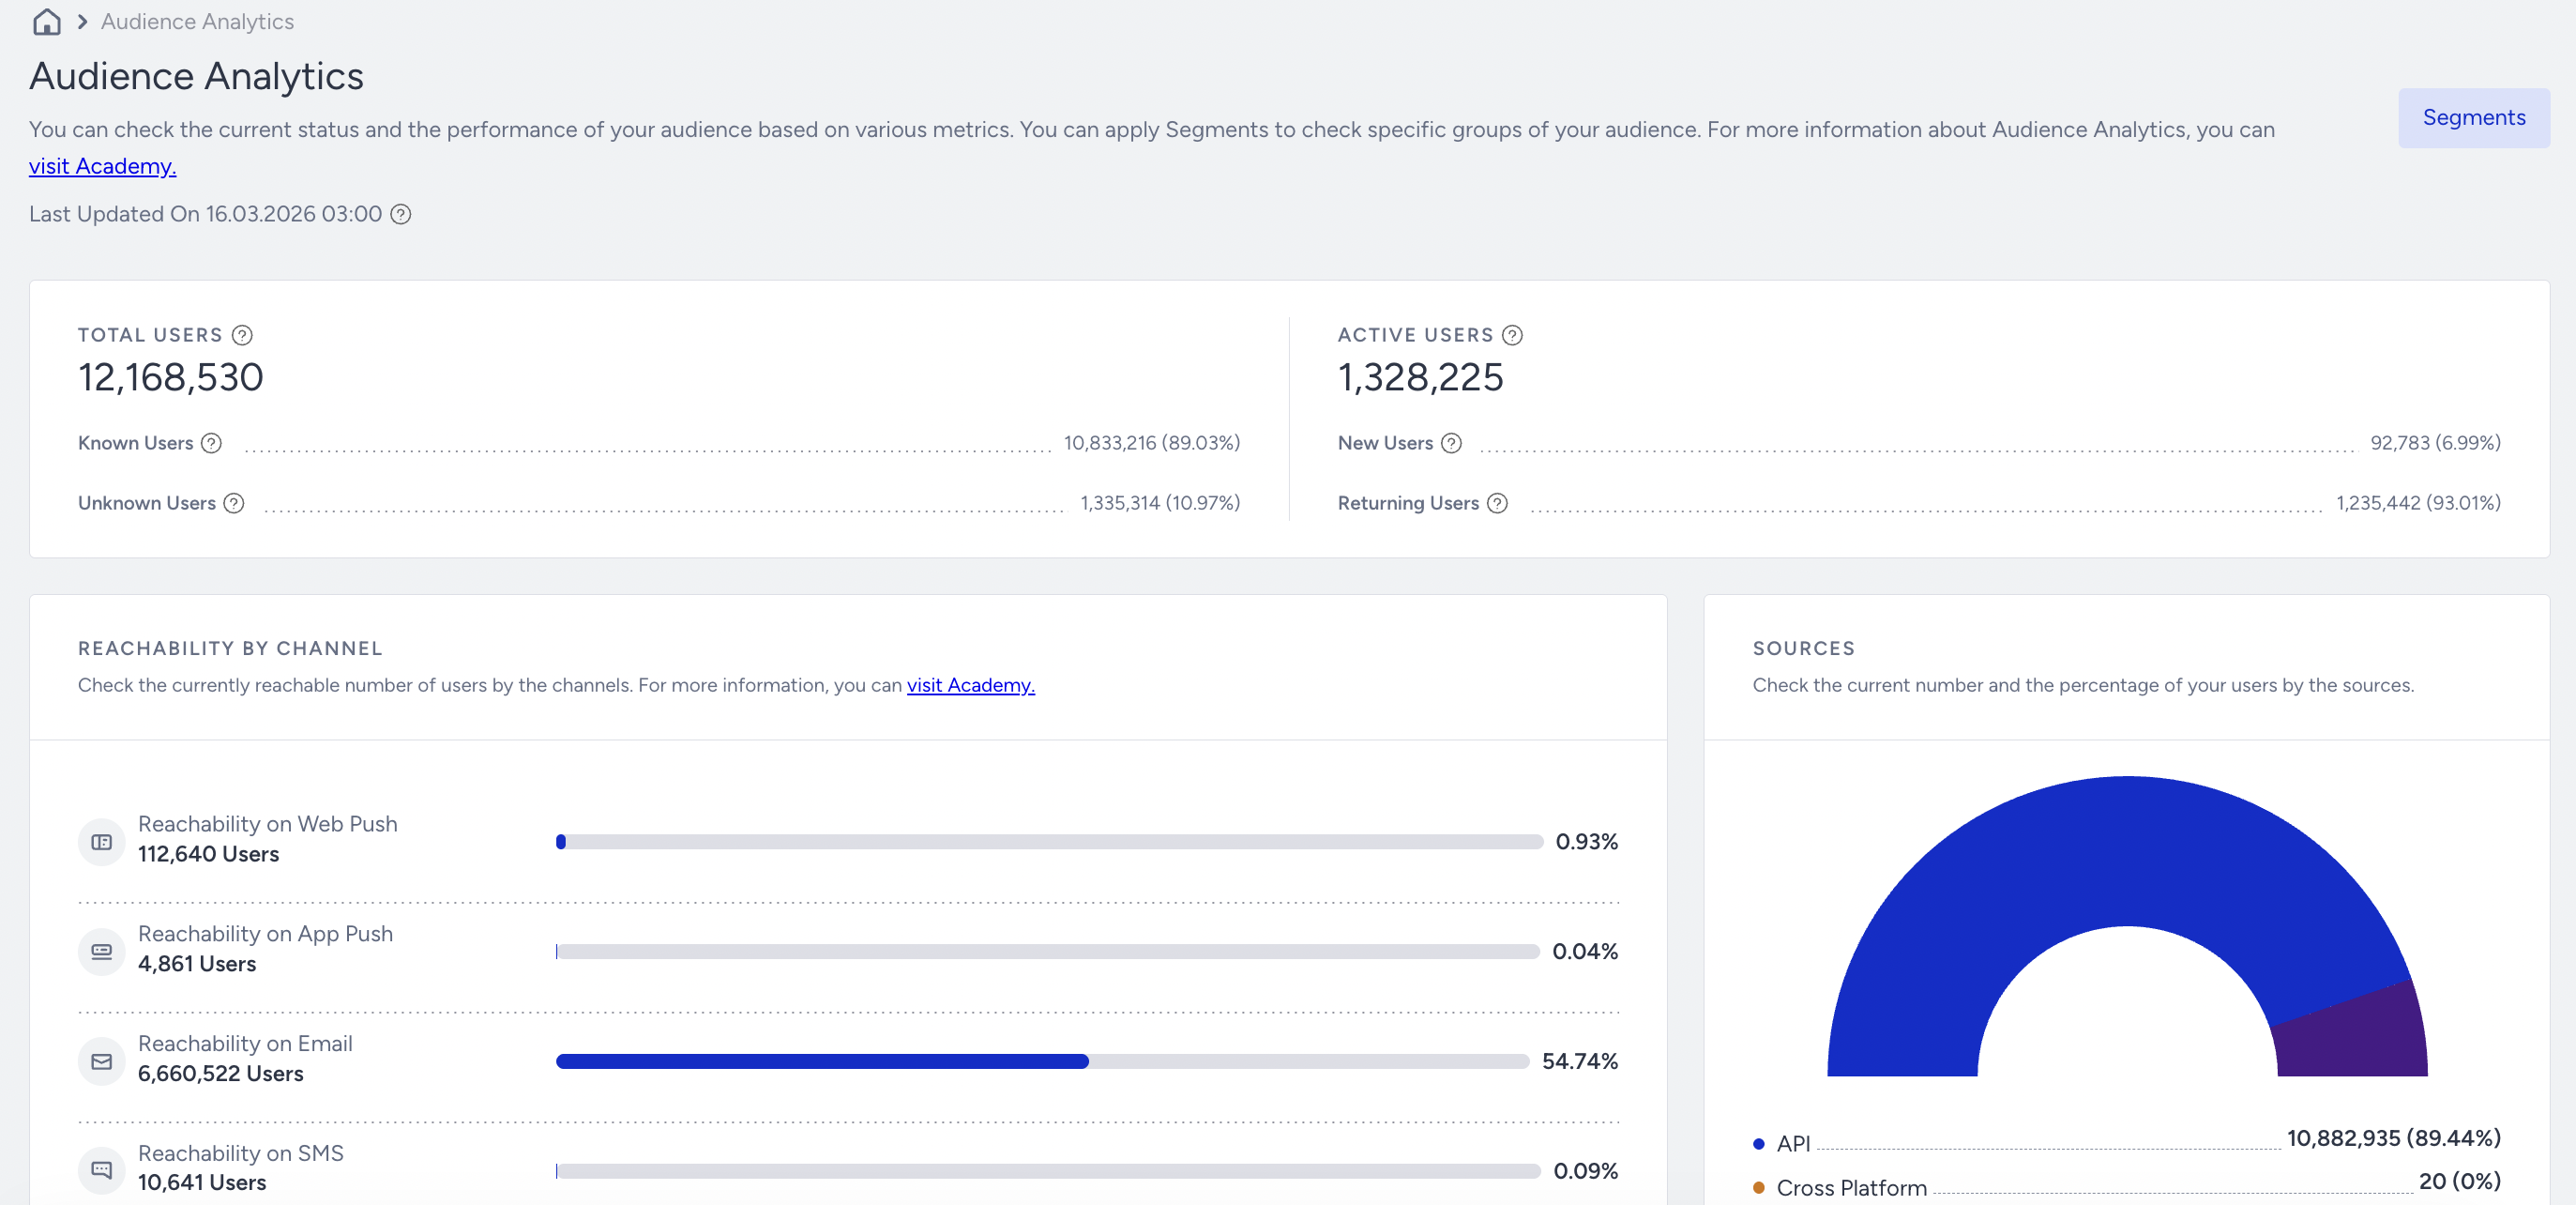
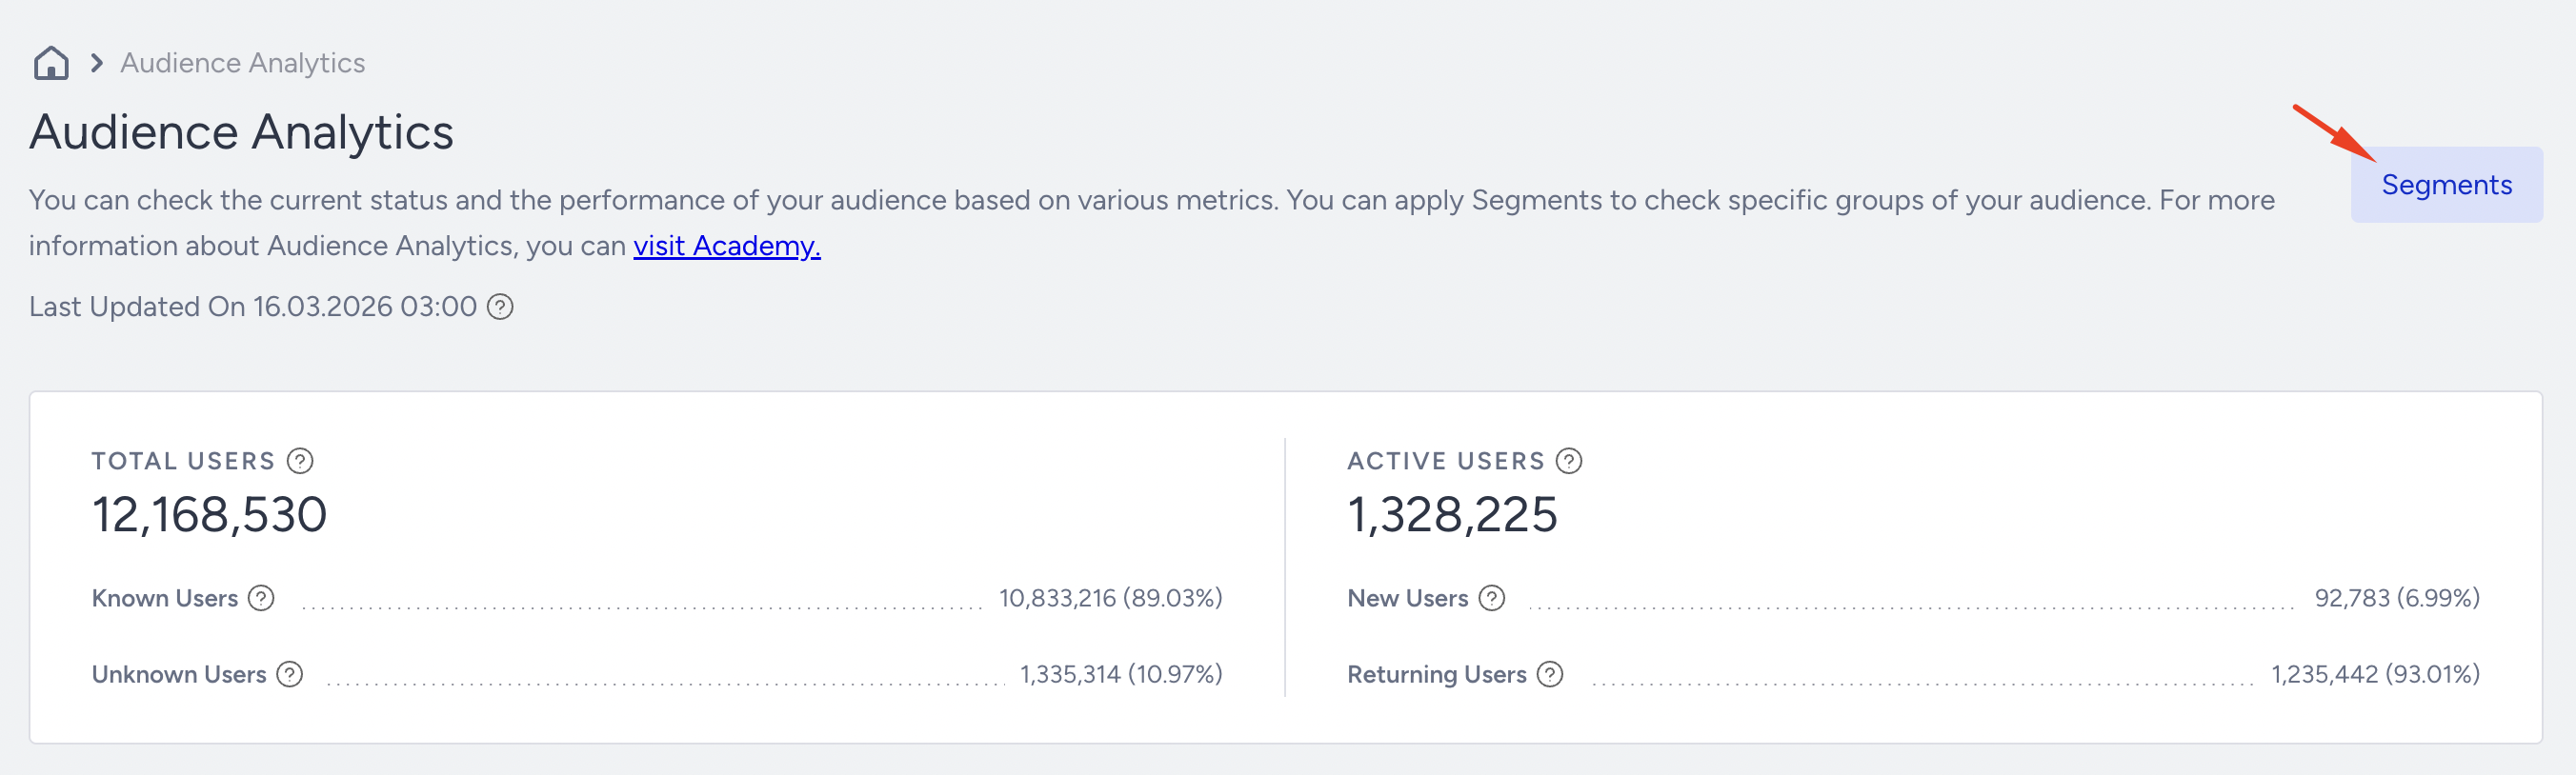
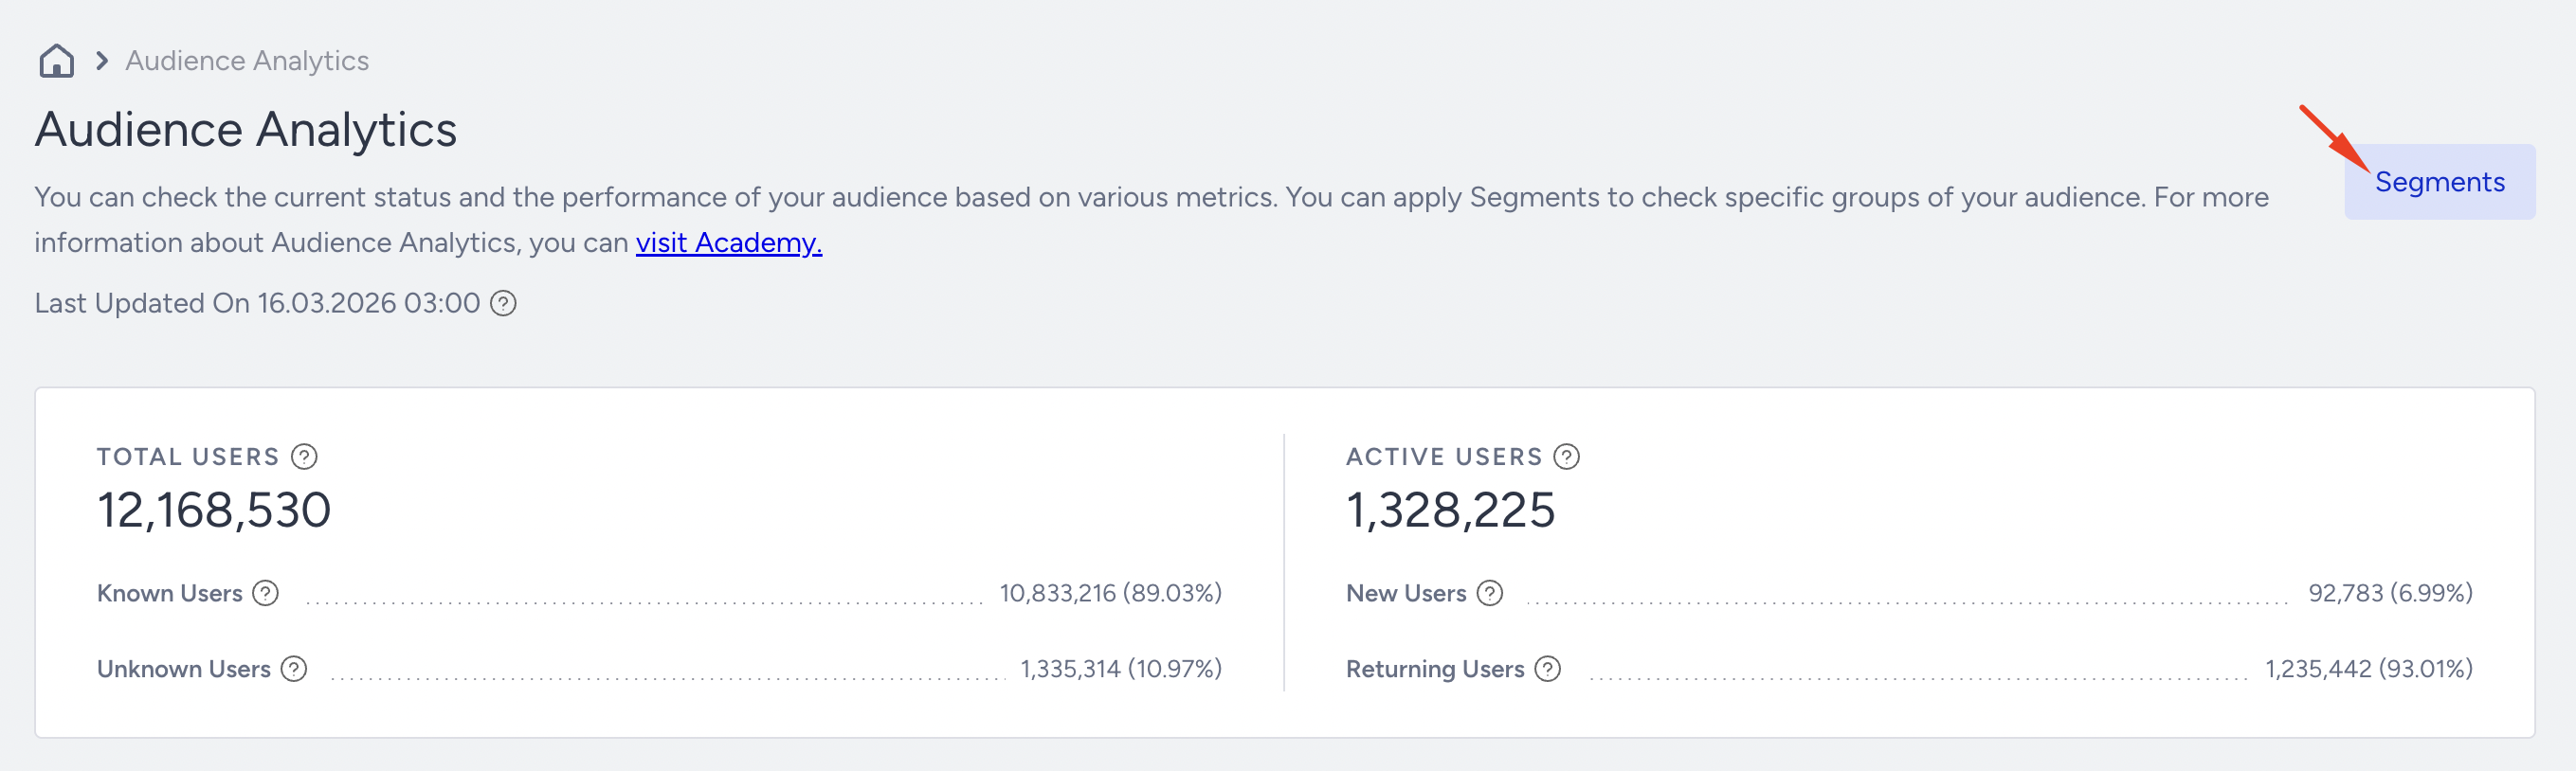
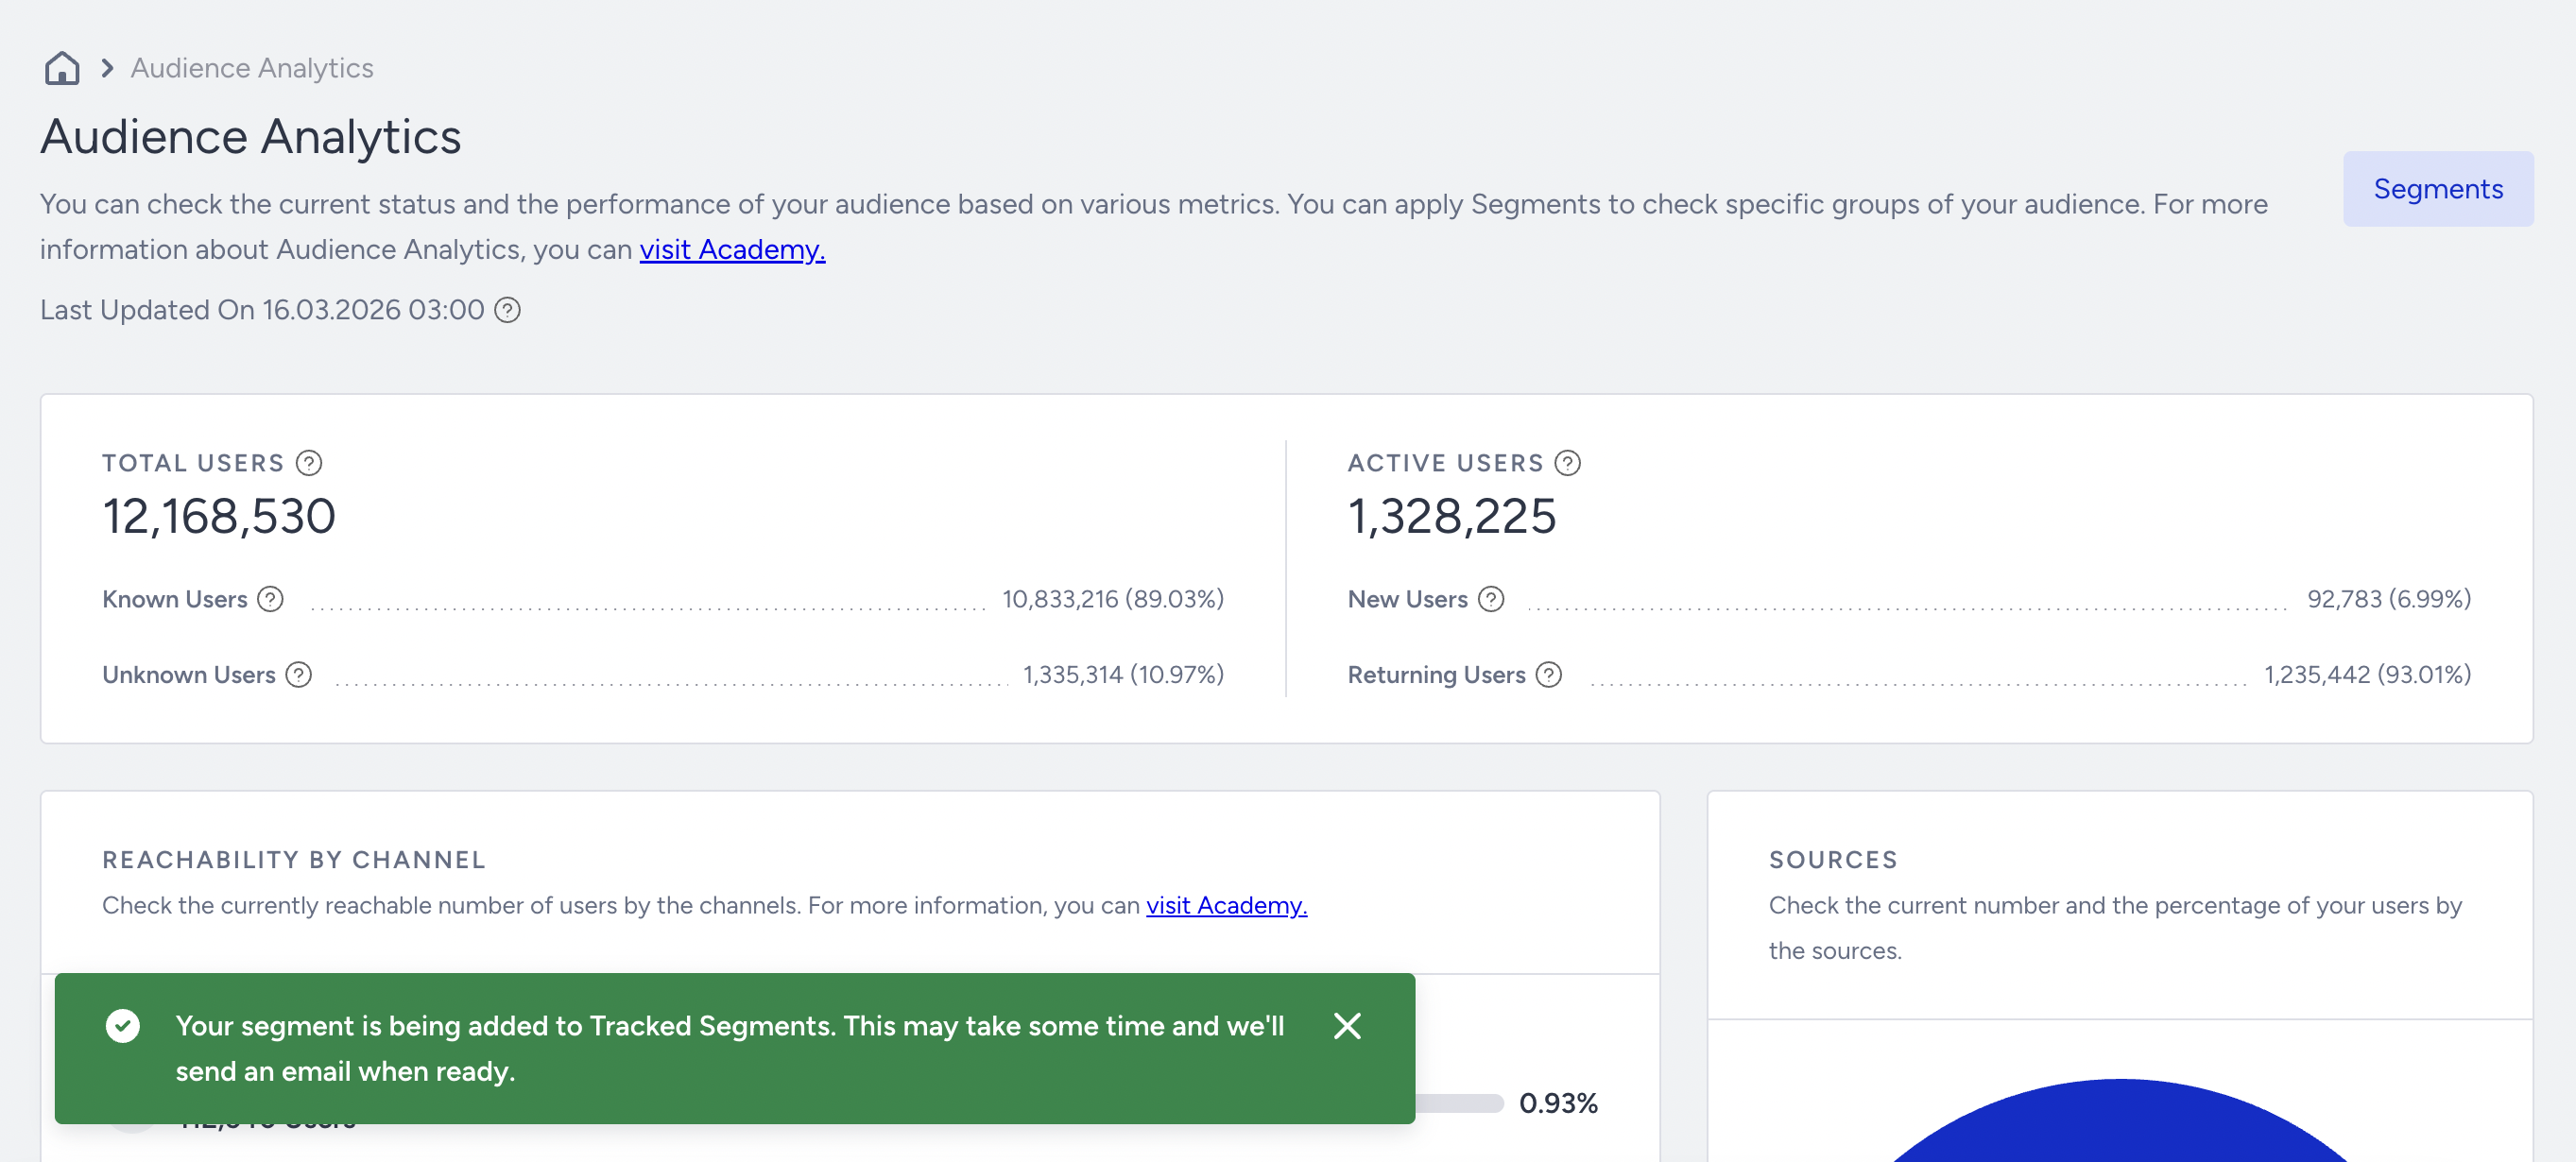
To access the Audience Analytics, navigate to Audience > Audience Analytics.
Key Metrics
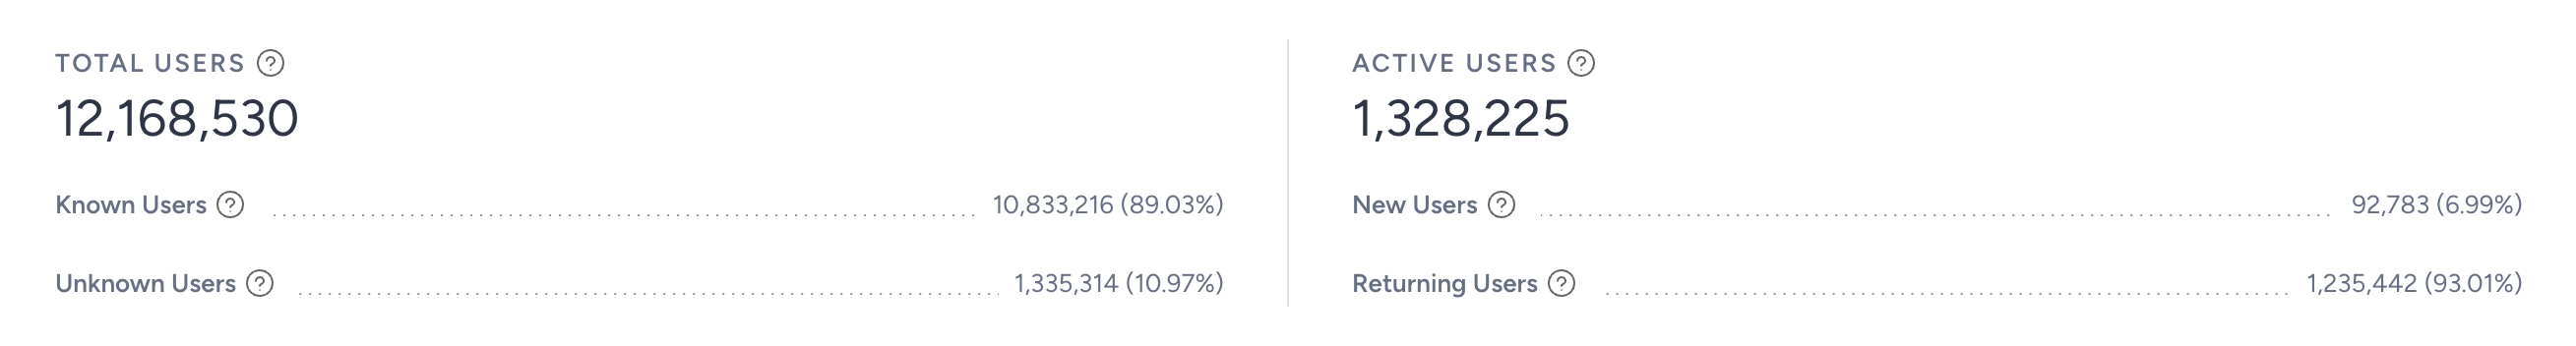
Total Users: This is the number of unique users of the selected audience (if non-filtered, it will showcase total users in Insider One UCD) - you should expect to see the same number in the User Profile (if the last updated time is the same)
Known Users: This is the number of User Profiles that have at least 1 identifier (UUID, Email Address, Phone Number, or any custom one). You may find those on the Identity Resolution Management page.
You can also see the percentage over the Total Users. If the total number of users is 100,000 and the known users are 40,000, then the value here will be 40%.
Unknown Users: This is the number of users who have no identifier. These are created whenever there are users who visit your website (with Insider JS embedded in it).
You can also see the percentage over the Total Users. If the total number of users is 100,000 and the known users are 40,000, then the value here will be 60%.
Active Users: This is the number of users who have at least visited or done any activity (whether it’s visiting the website, app, or even clicking messaging)
New Users: The number of new profiles that Insider One has detected. By definition, Insider One checks those created in the last 30 days.
Returning Users: The number of people who came back again to your website within 30 days.
Reachability by Channel
Within the particular segment of users you select, you see the breakdown of channel reachability.
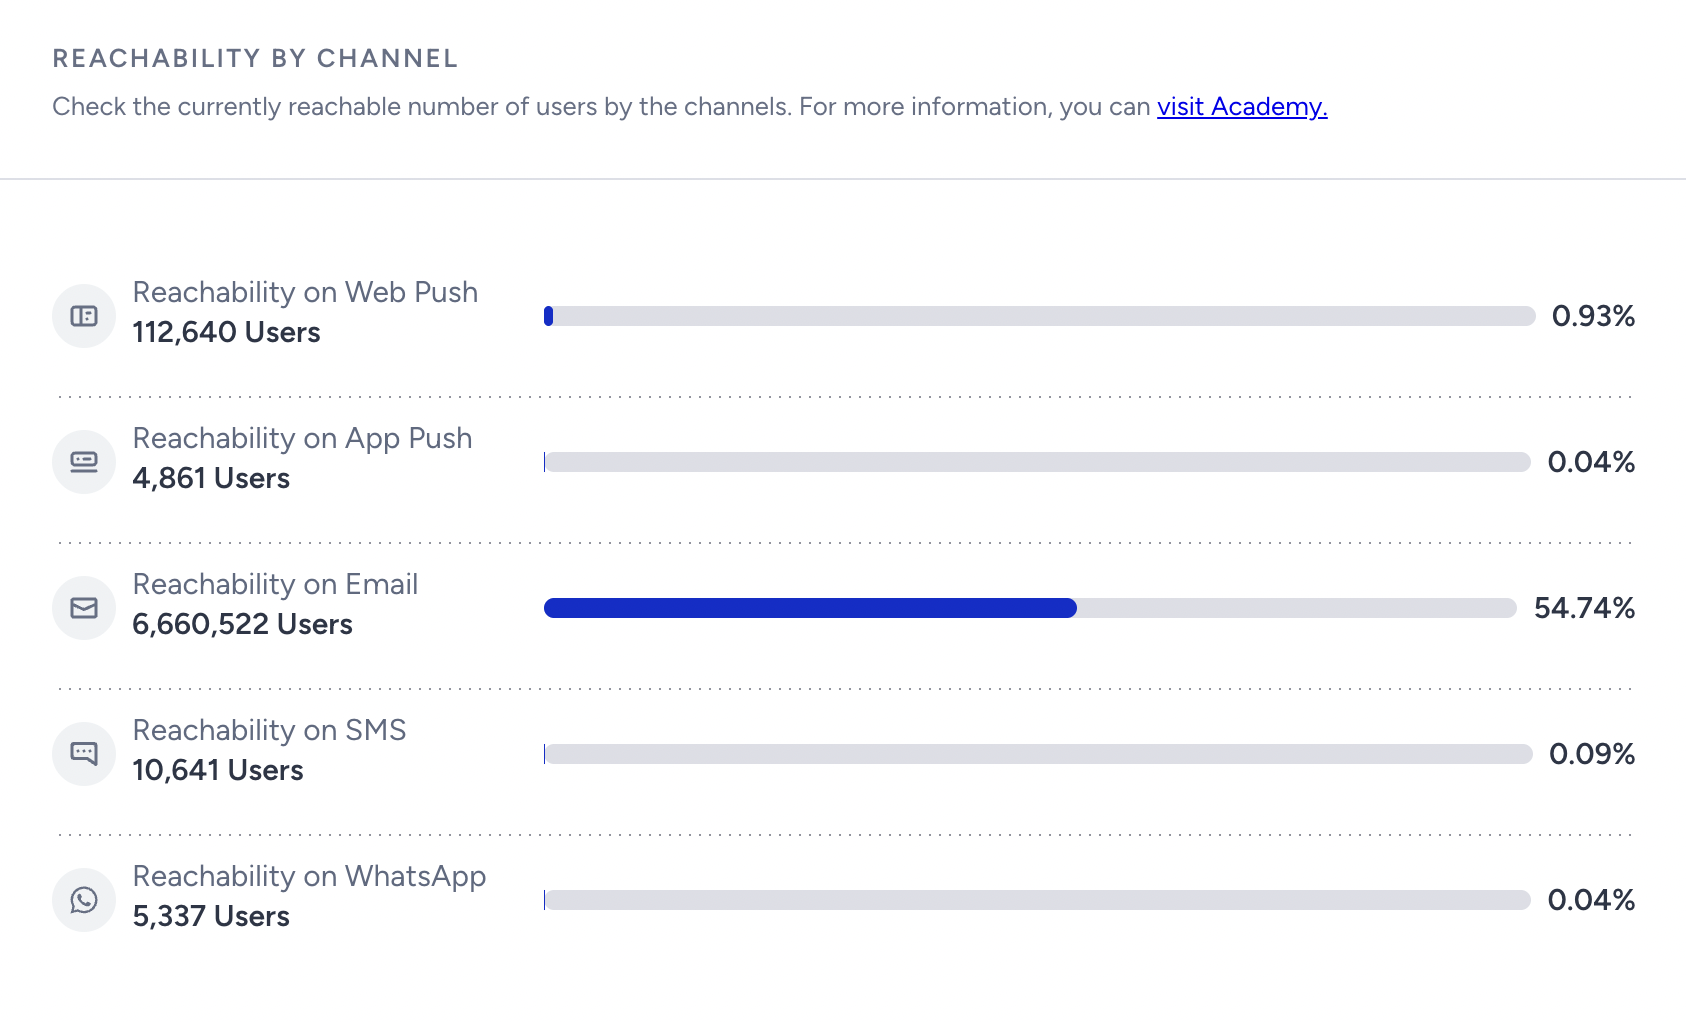
The reachability of these channels follows the criteria defined for reachability in Architect. So, for users to be counted as reachable in a given channel, they must meet the required attributes and fill them in accordingly.
Total Profiles vs. Reachable Audience
Total Profiles is the number of user profiles stored in Insider One UCD. It can include known and unknown users, including profiles that do not have the data or permission required for messaging.
Segment Audience includes profiles that currently match the dynamic segment conditions.
Reachable Audience is the subset of that segment that meets the requirements for a specific channel. For example, Email requires a valid email address and the necessary messaging permissions, while App Push requires an eligible push token and App Push opt-in.
Therefore:
Reachable Audience ≤ Segment Audience ≤ Total Profiles
A difference between these counts is expected. Users might match the segment but remain unreachable because they lack a valid channel identifier or token, have not opted in, have opted out, or do not meet another channel-specific requirement.
Sources
You can check the current number and the percentage of your users by the sources:
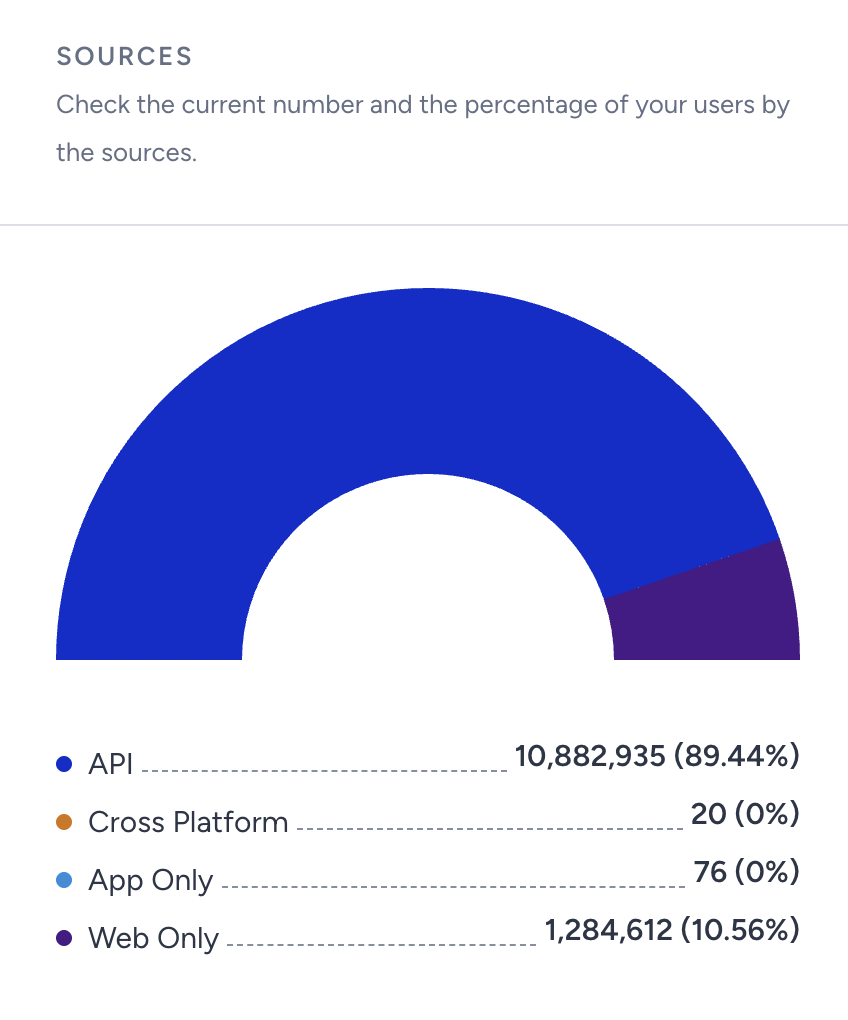
If the user is a Web User, it is displayed as Web Only.
If the user is an App User, it is displayed as App Only.
If the user is present on both platforms (unified), it is displayed as Cross-Platform.
If the user is neither a Web nor an App user, but their profile is generated or created through the Upsert API or manual upload, it will be displayed under the API label.
Message Frequency
You can check the number of messages users received in the last 30 days. This information helps you determine whether you are over-communicating (sending too many messages) or under-communicating (sending too few messages).
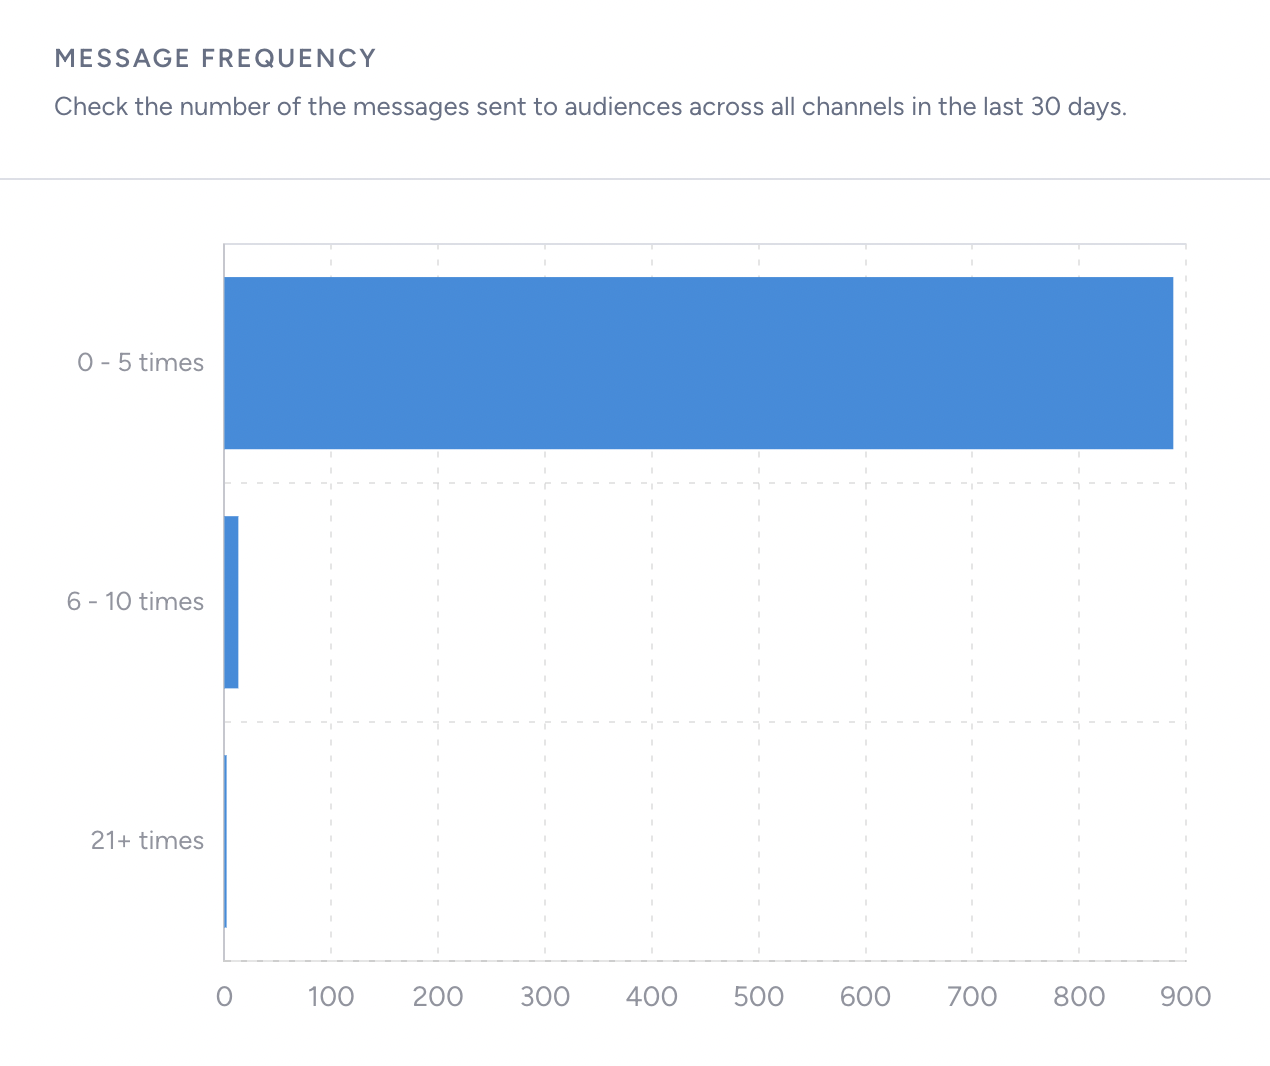
The results are calculated by accumulating the following events from the last 30 days.
App Push = App Push Delivered Event
Email = Email Delivered Event
SMS = SMS Delivered Event
Web Push = Web Push View Event
Web Push event is not turned on by default, please contact the Insider One team to have it enabled.
WhatsApp = WhatsApp Delivered Event
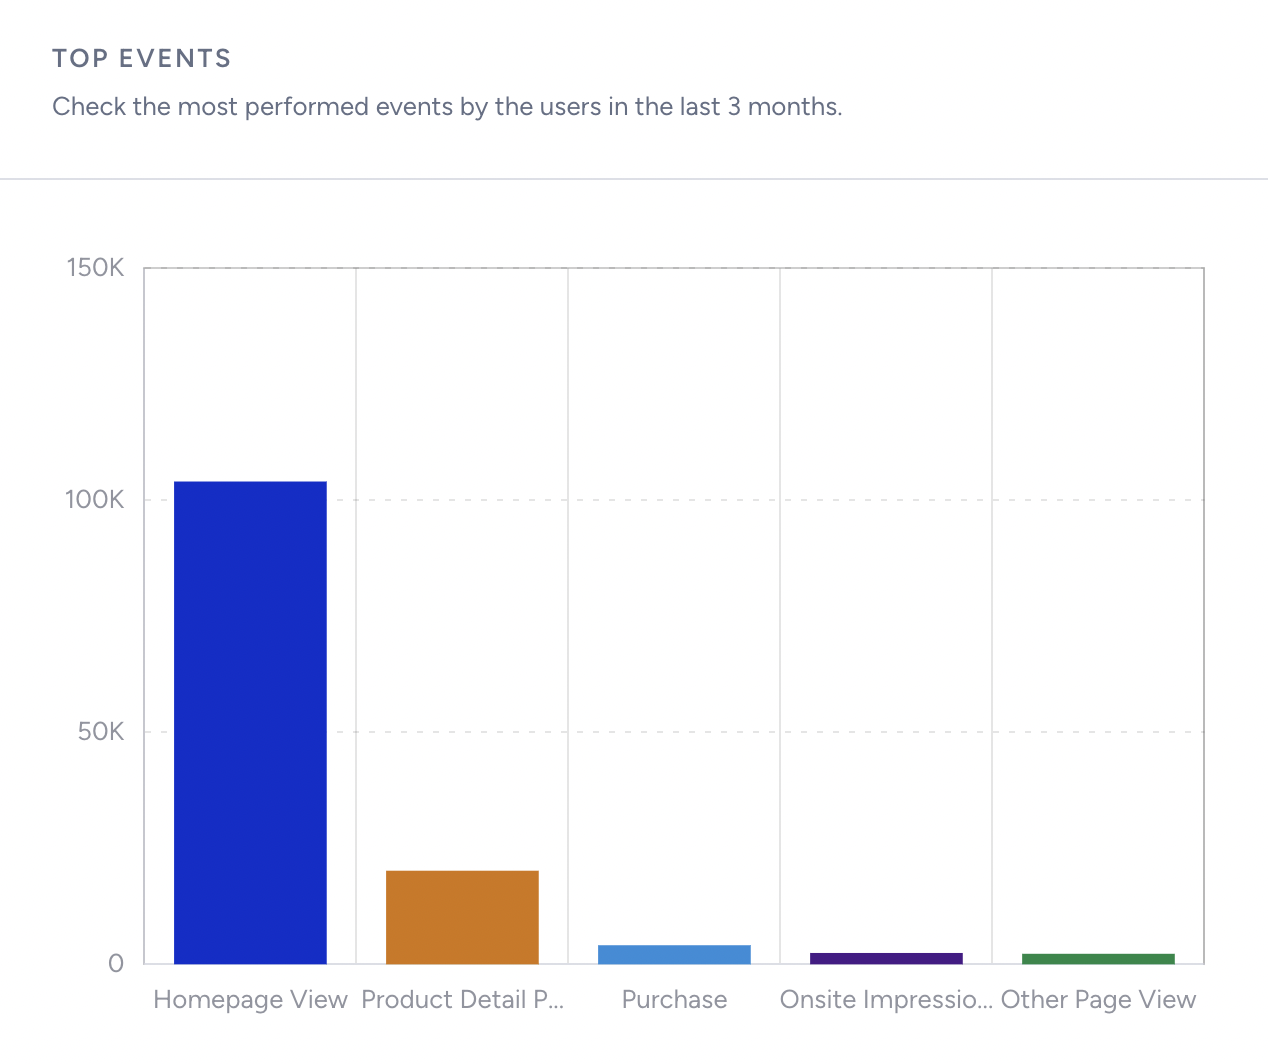
Top Events
You can check the top five most performed events by users in the last three months within that particular user segment you apply to.
Purchase and Revenue
You can check the overall revenue and other purchase-related metrics.
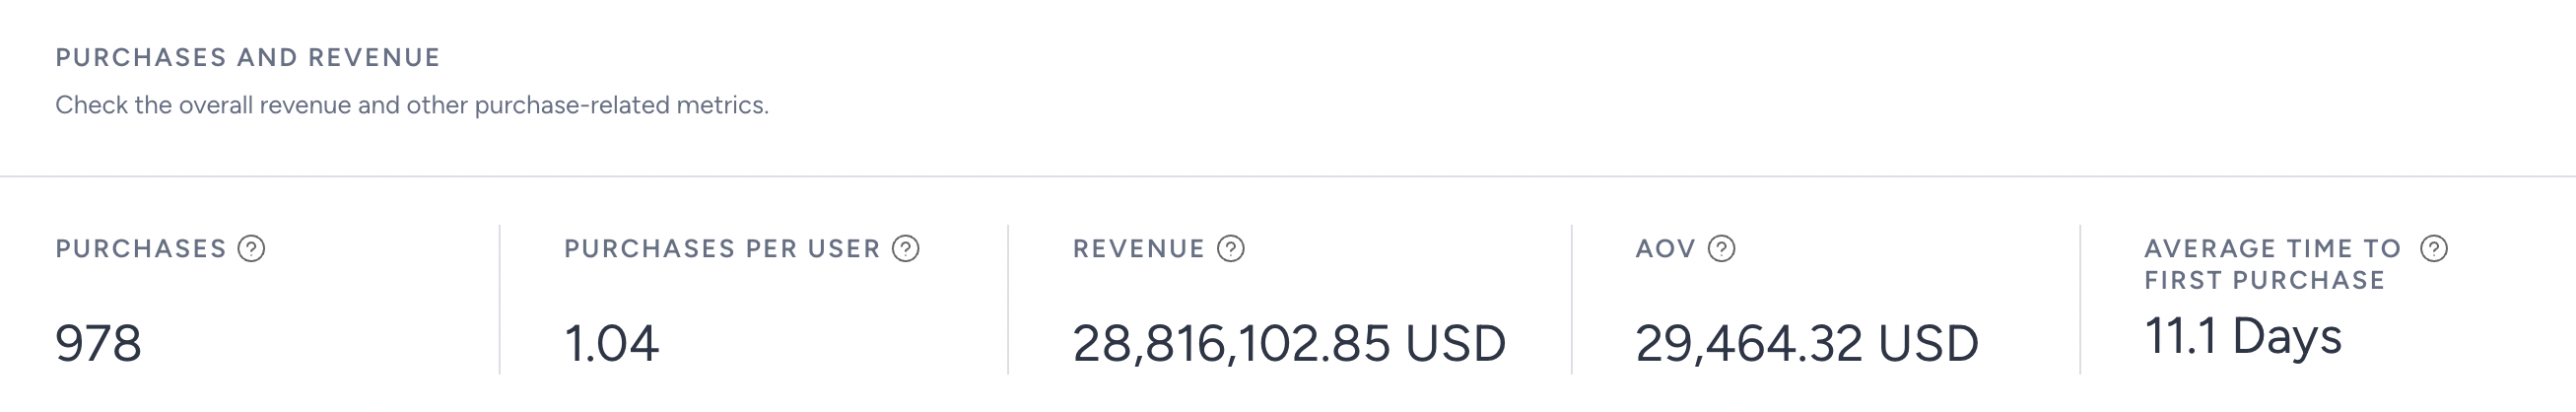
Purchases: The number of transactions in that particular segment. For example, 189 purchases mean 189 transactions/main conversion events in total users stored in Insider One's UCD.
Purchases per User: The average purchase/transaction per user. For example, the purchase count is 189, and the number of users with at least 1 transaction is 100, so the purchase per user is 1.89.
Revenue: The cumulated revenue value from transactions generated in the InOne panel so far. With this metric, you can compare segments to identify which are most valuable or contribute the most revenue.
Value: All the “value” from the event parameter under the event of confirmation_page_view is summed up.
Currency: The default currency is taken into account.
Time Period: All time following the event's TTL (by default, two years). For example:
If there are three transactions in the InOne panel with TTL (2 years)
Transaction A: 100 USD, performed on 30/01/2026, created on 30/01/2026
Transaction B: 200 USD, performed on 30/01/2026, created on 30/03/2026 (somehow injected by API historically)
Value at different periods (assuming only these two transactions exist, and a two-year TTL)
When you load the page on 30/04/2023, the value will be USD 300
When you load the page on 30/02/2025, the value will be USD 200
Because Transaction A TTL has expired, it will be removed from Insider’s One database.
Multi-currency case
Assume you have three transactions (1 USD, 100 TL, 1 GBP):
What is the main default currency that is used will be checked first.
Then Insider One will start converting the value that are not using the main default currency. In these example, it will be the 100 TL and 1 GBP → it will be converted to USD.
Then once everything has already been under the same currency, then Insider One will sum them all up to give you the final revenue value here.
Average Order Value (AOV): The average value of purchases divided by the number of transactions. For example, the revenue is $1,000, and the purchases are 100; so the AOV = $1000 / 100 = $10
Average Time to First Purchase: The average time it takes for users to do their first transaction on average. For example,
User A
First Purchase Date: 31 Jan 2025, 11:30 am
User Profile Created Date: 01 Jan 2025, 10:30 am
Time to First Purchase: 30 Days 1 Hour
User B
First Purchase Date: 21 Jan 2025, 11:30 am
User Profile Created Date: 01 Jan 2025, 10:30 am
Time to First Purchase: 20 Days 1 Hour
The Average Time to First Purchase within this segment is: (User A’s Time to First Purchase + User B’s Time to First Purchase) / (no. of users)
(30 days 1 hour + 20 days 1 hour) / 2 = 10 days 1 hour
Note for monthly calculations:
When the calculation spans a longer period, Insider One assumes 1 month = 30.417 days, following the same standard used in Google’s calculations.
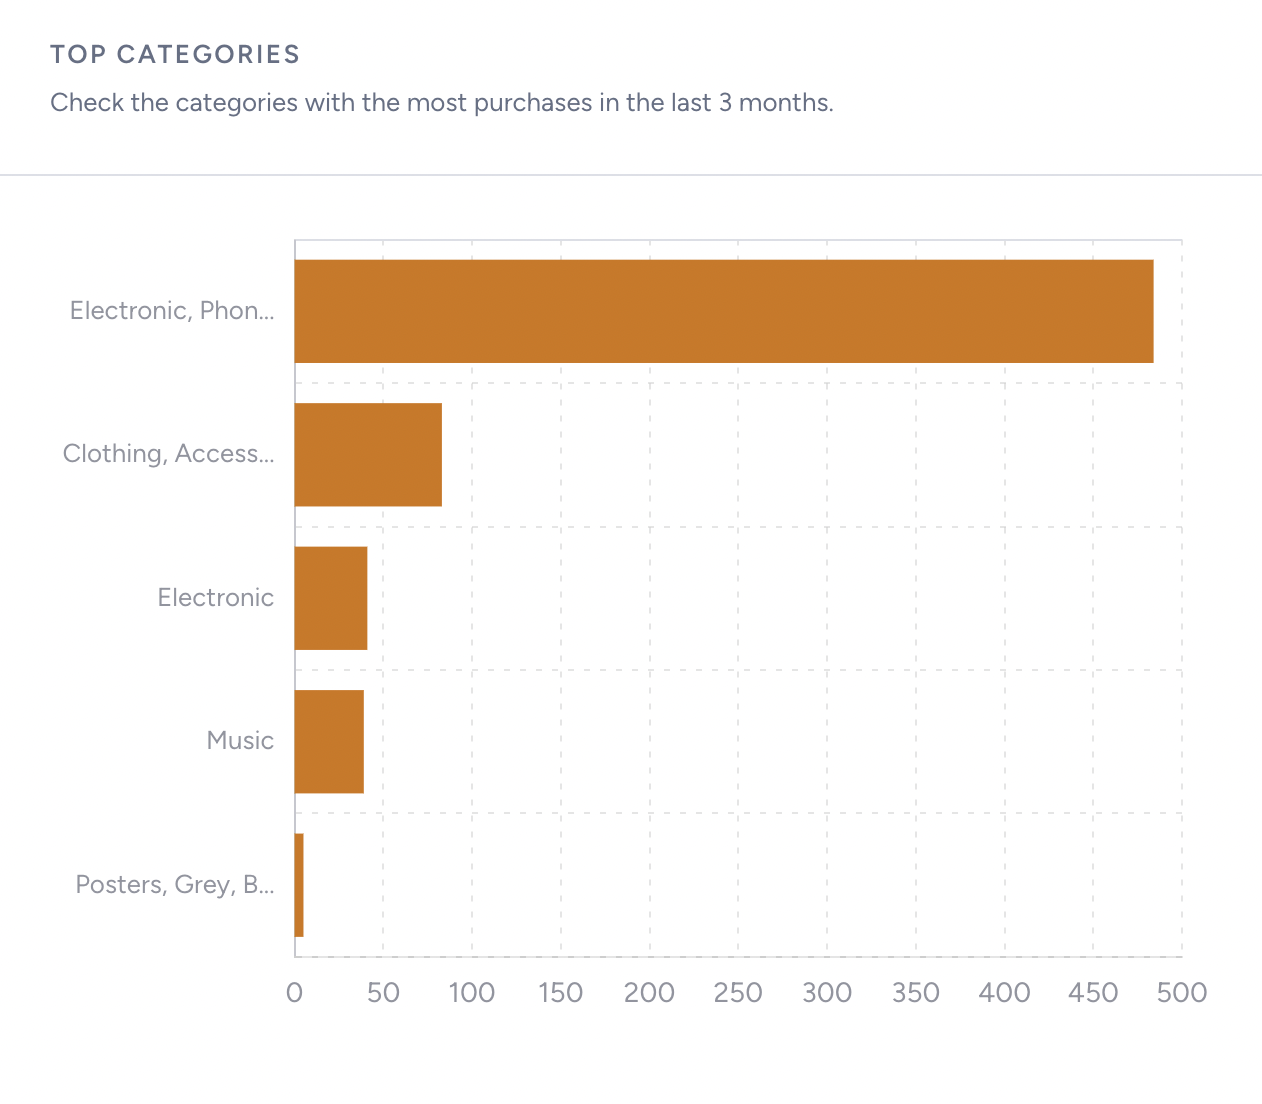
Top Categories
You can see the categories with the most purchases in the selected user segment over the last three months.
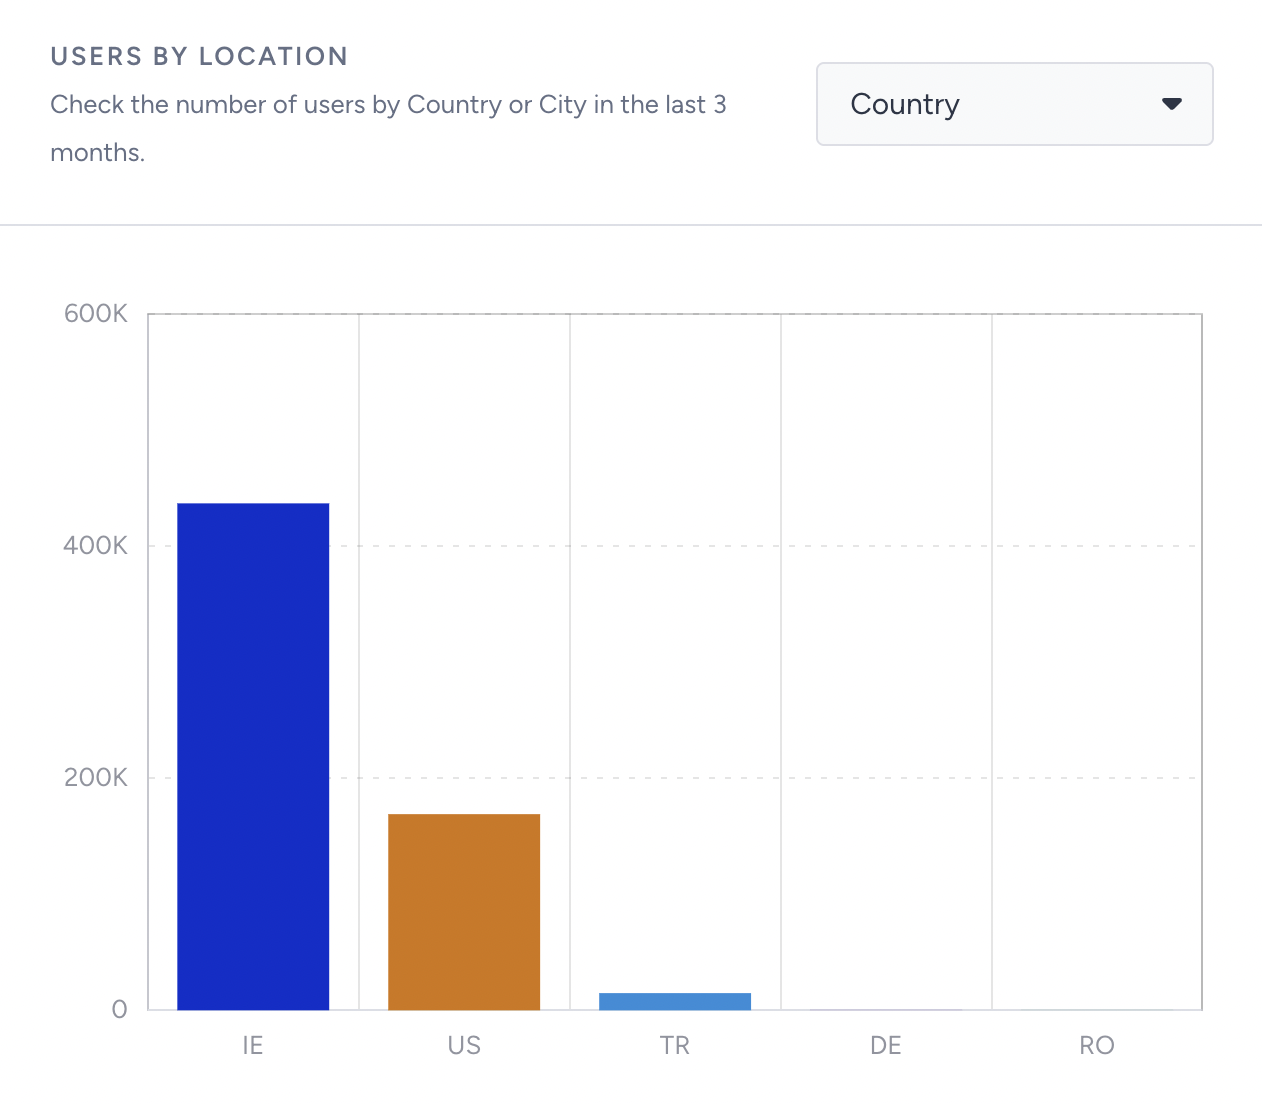
Users by Location
You can see the top five countries and cities within the selected user segment.
Segment your audience
When you land on the page, you see all the metrics without segmentation, which means they are unfiltered. Click on the Segment button to check specific groups of your audience.
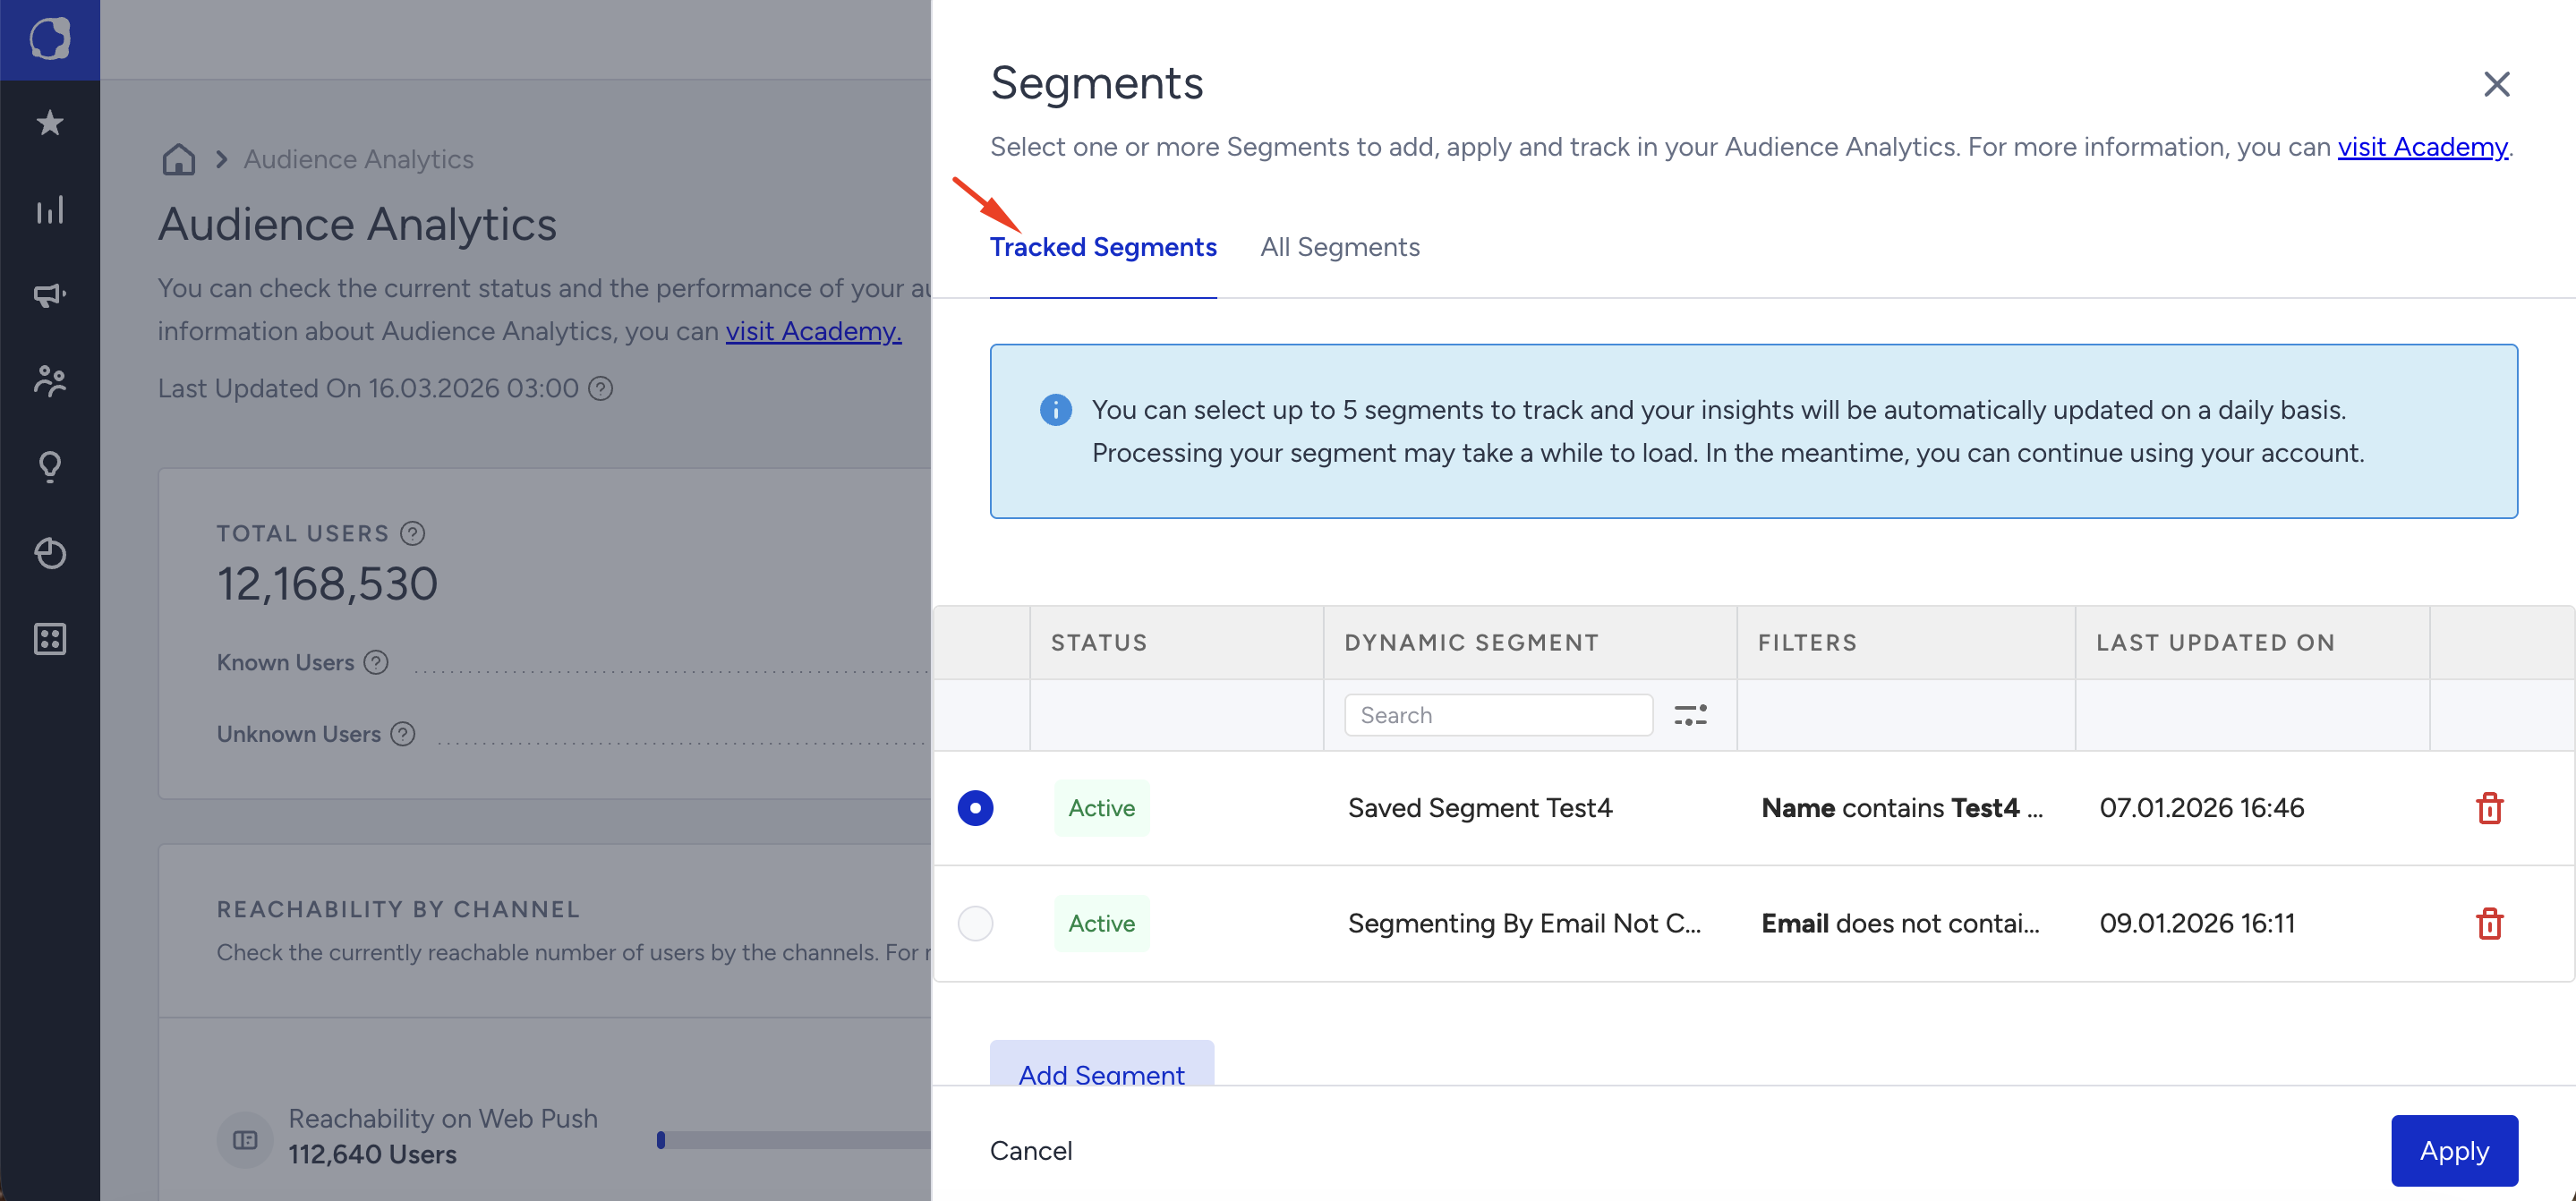
Clicking the Segment button on the right-hand side opens the segmentation component. This allows you to filter and analyze page metrics for the selected user segment.
Tracked Segments
Tracked Segments allow you to select up to five segments for which queries automatically run daily to retrieve all the metrics listed above (at midnight, 0:00 - 0:30 am in the InOne panel timezone). This way, the next time you visit, the data will be preloaded so you can view it.
Add a tracked segment using a dynamic segment
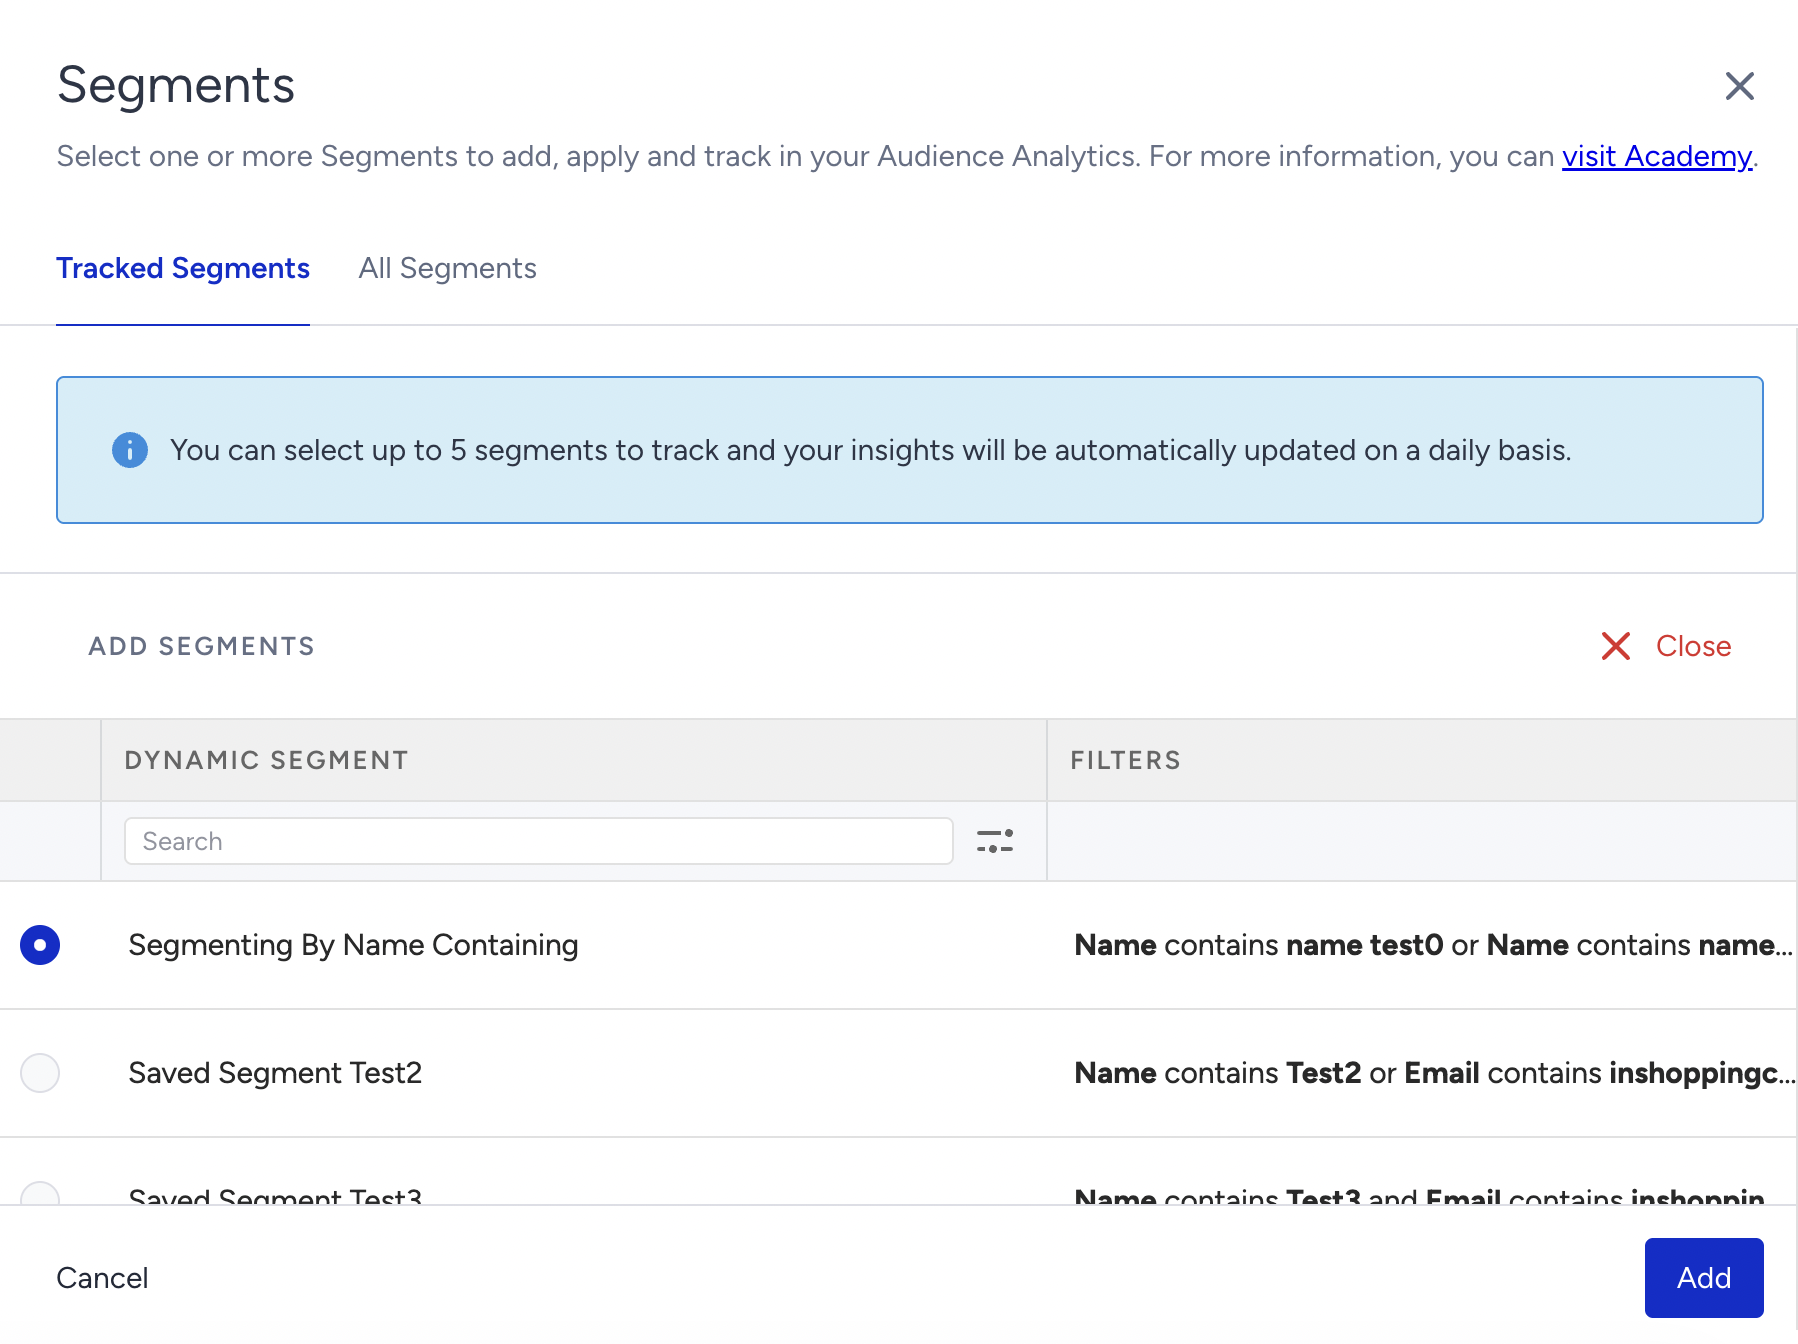
Click the Add Segment button to add a new tracked segment on the Tracked Segments tab.
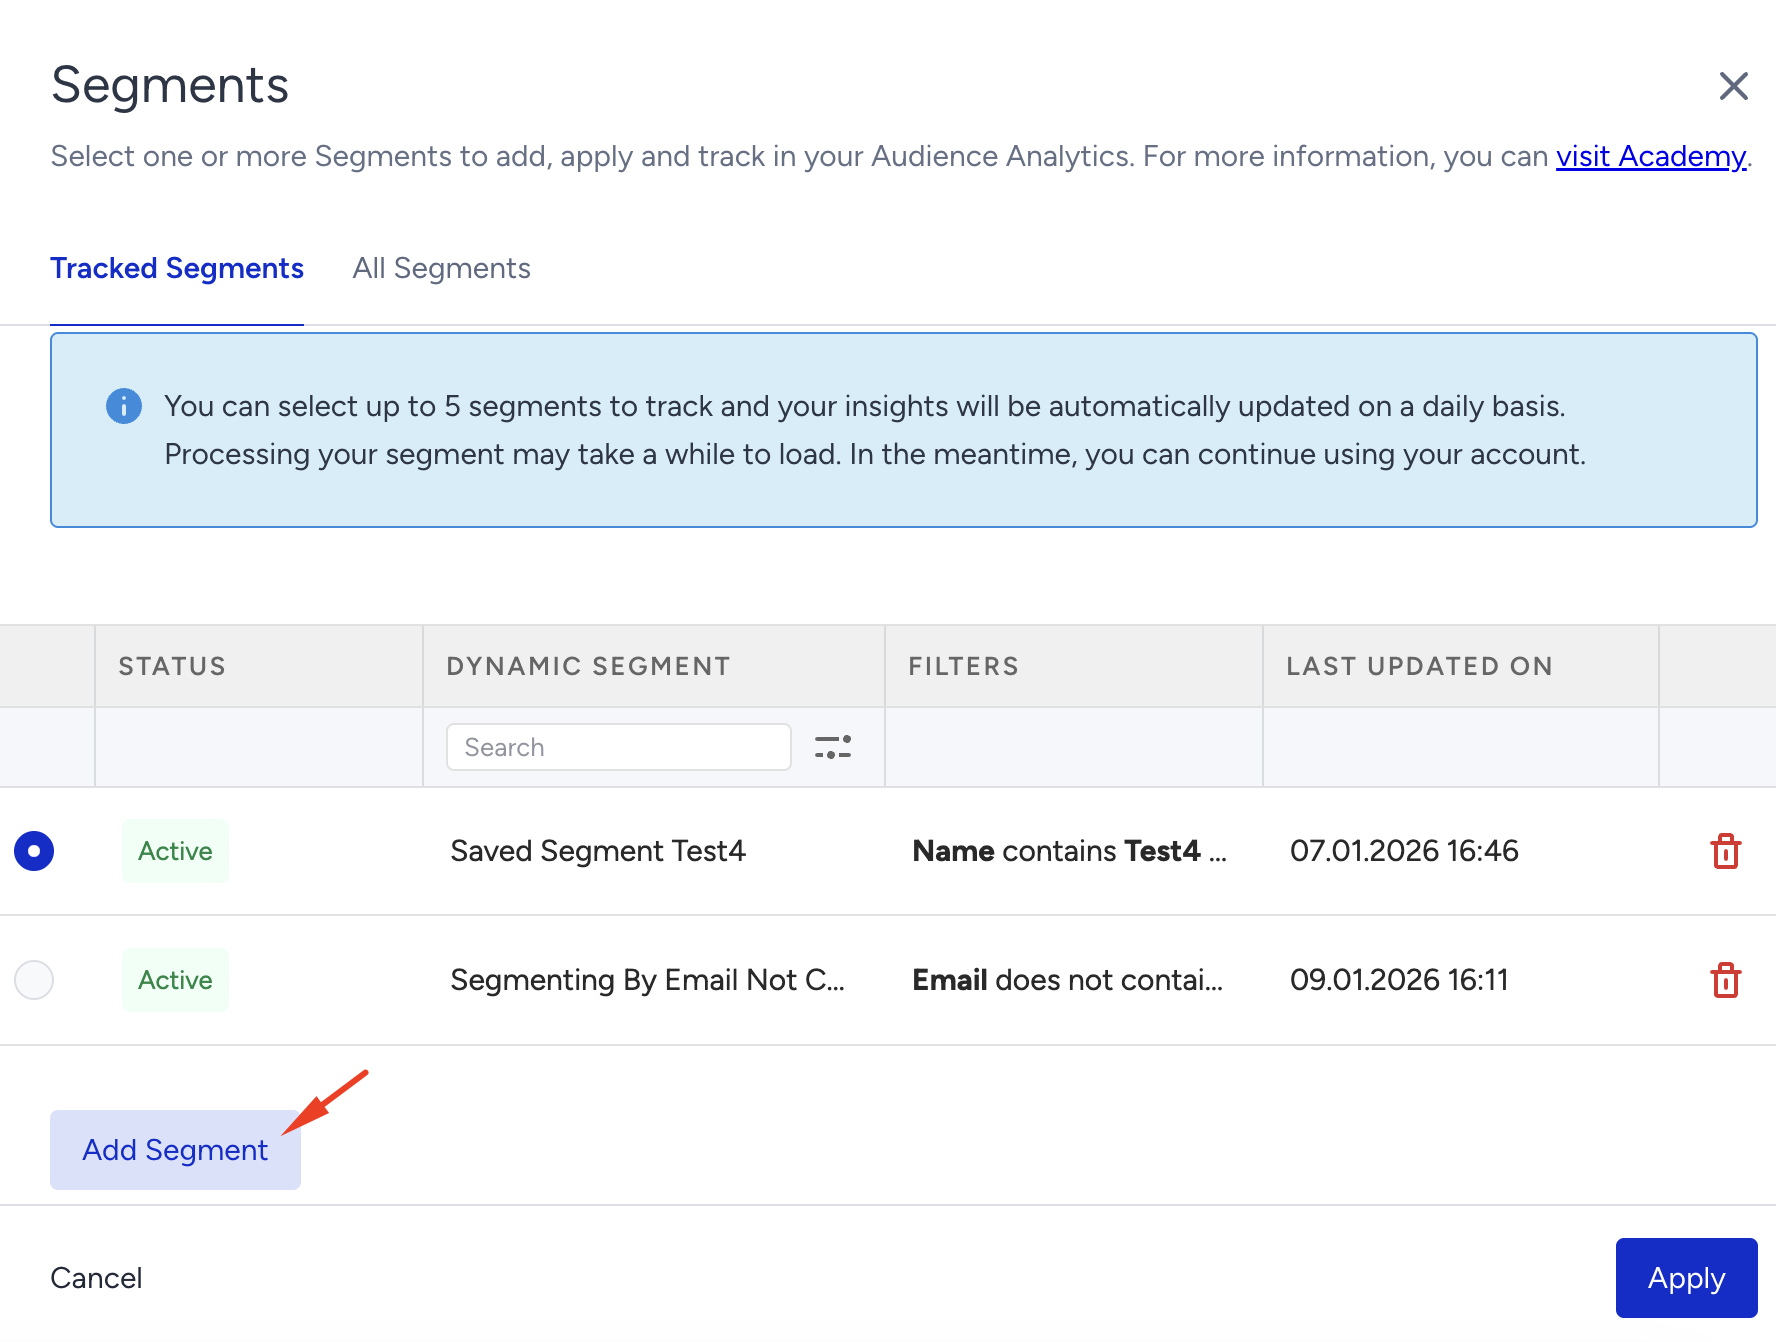
You will see the list of dynamic segments created before in the InOne panel. Select the ones you want to use and click the Add button.
After selection, you will see the list that has all the currently tracked segments
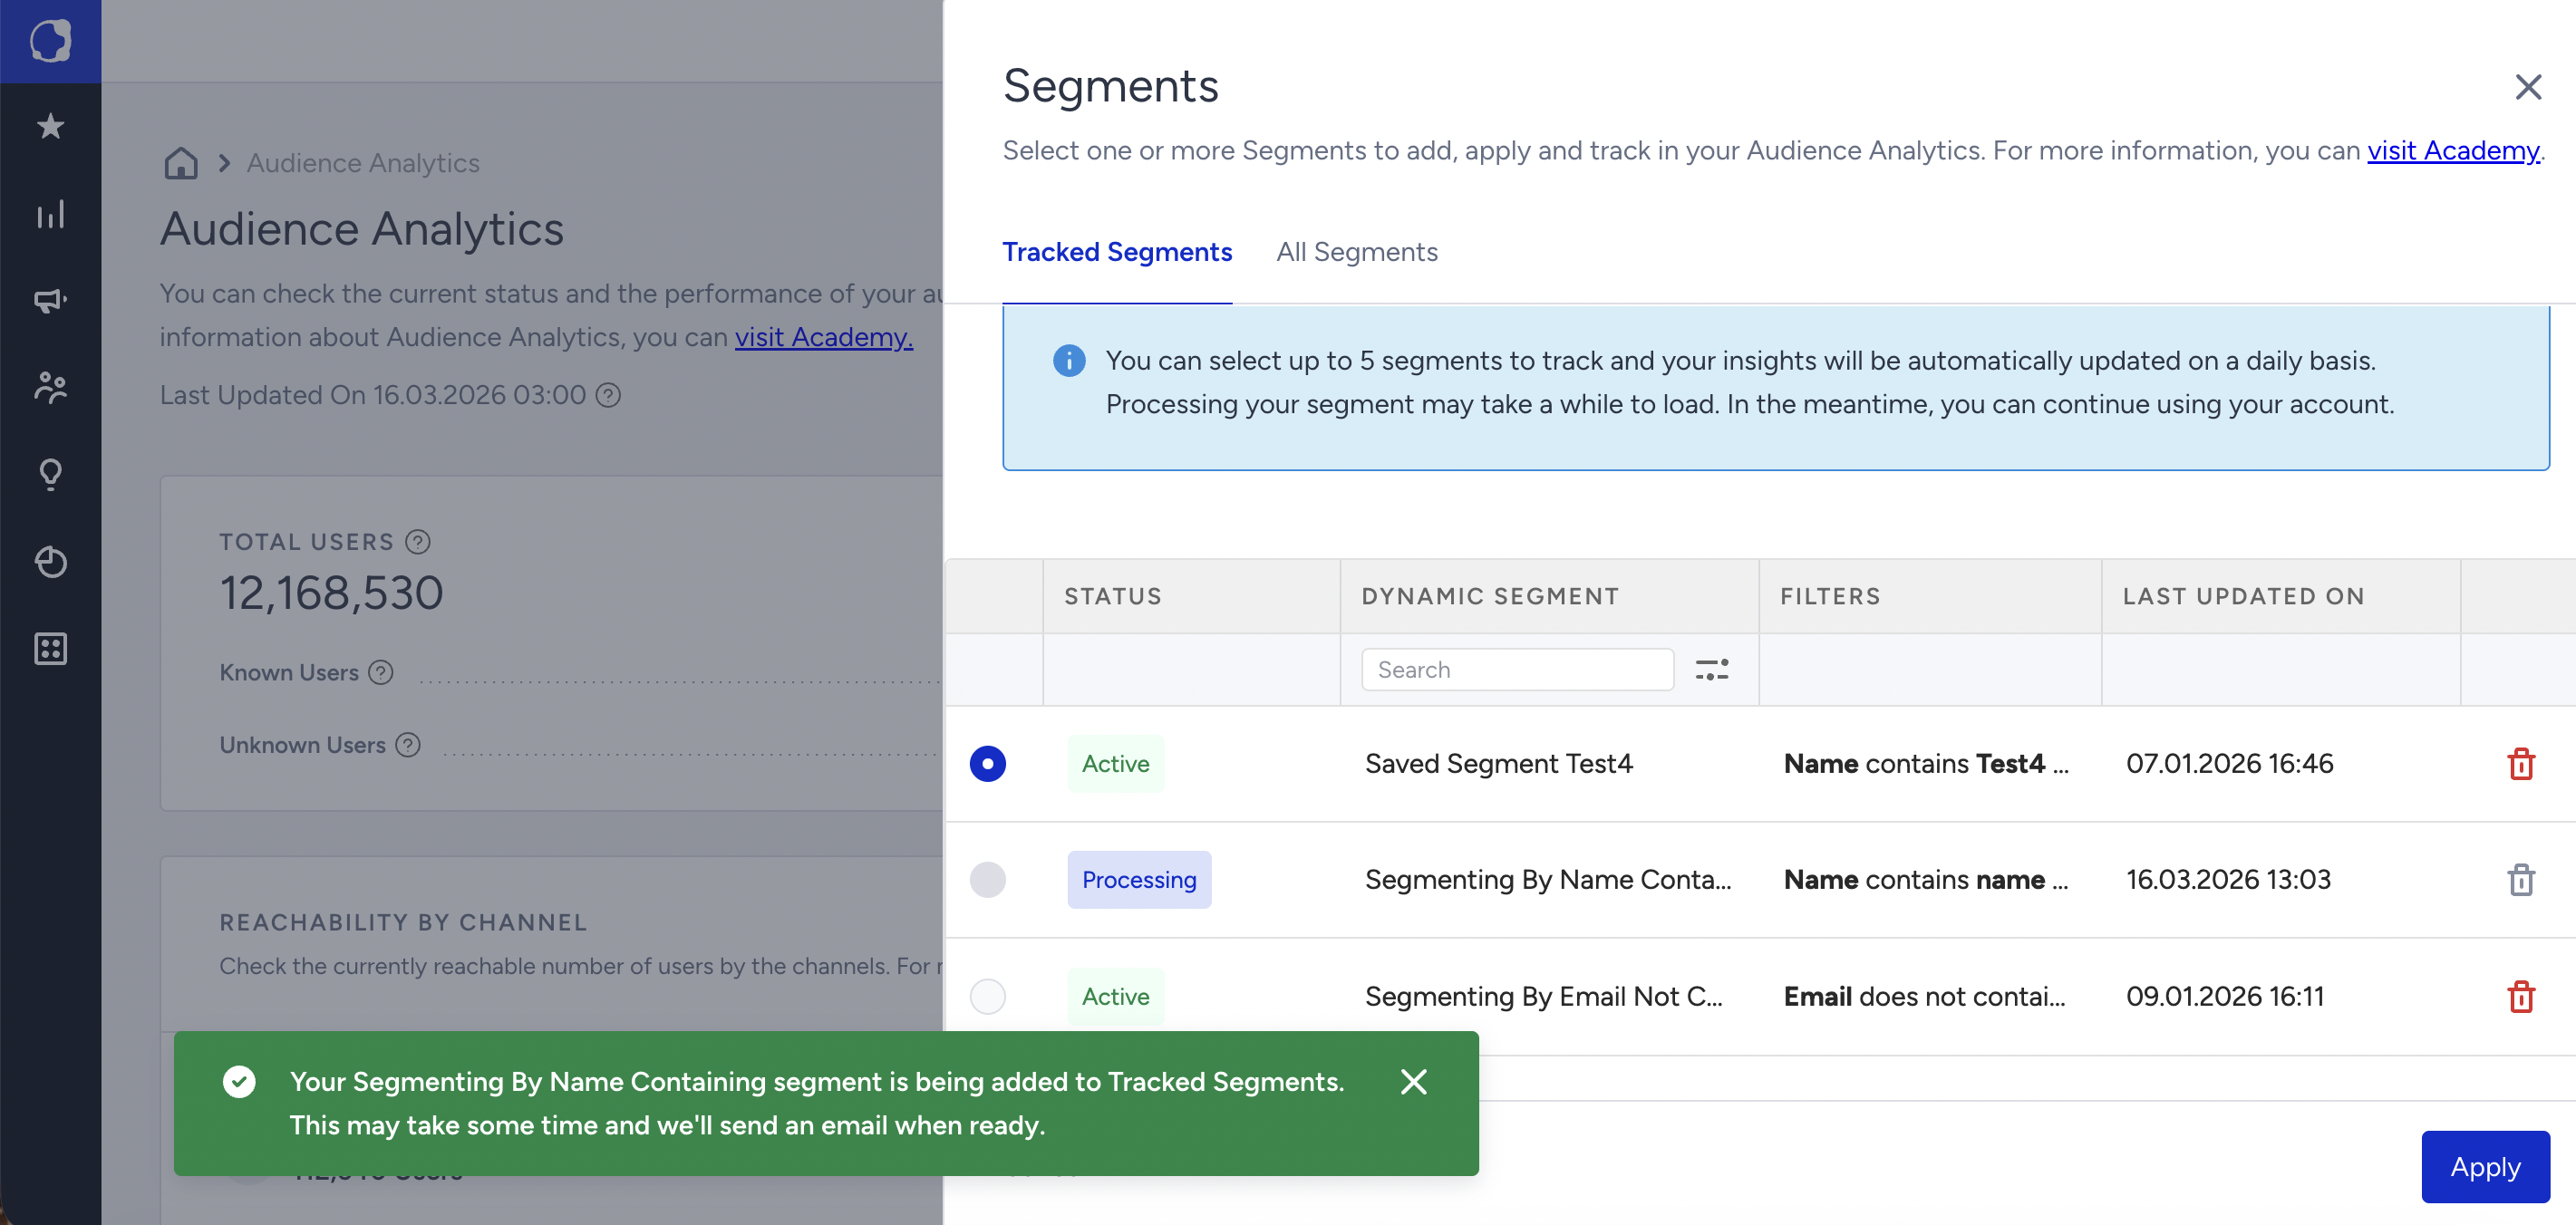
Currently, a total of five segments tracking limit is applied.
Processing: The status when a new segment is newly added. You can cancel your request by clicking the Delete icon if the segment is in this status.
If you only have segments under “Processing”, you may leave the page and wait until they are set to “Active”.
Once they are added, you’ll receive an email with a link to access the results. Alternatively, clicking on View Segments will redirect you to the previous Tracked Segment modal.
Active: Once a tracked segment under “Processing” status has successfully retrieved its first metrics set, Insider One stores it in its database and schedules a job to retrieve and refresh it daily (midnight in your time zone). Once this is applied, the segment status will be changed to “Active.”
An email will be sent to the tracked email once the tracked segment is ready.
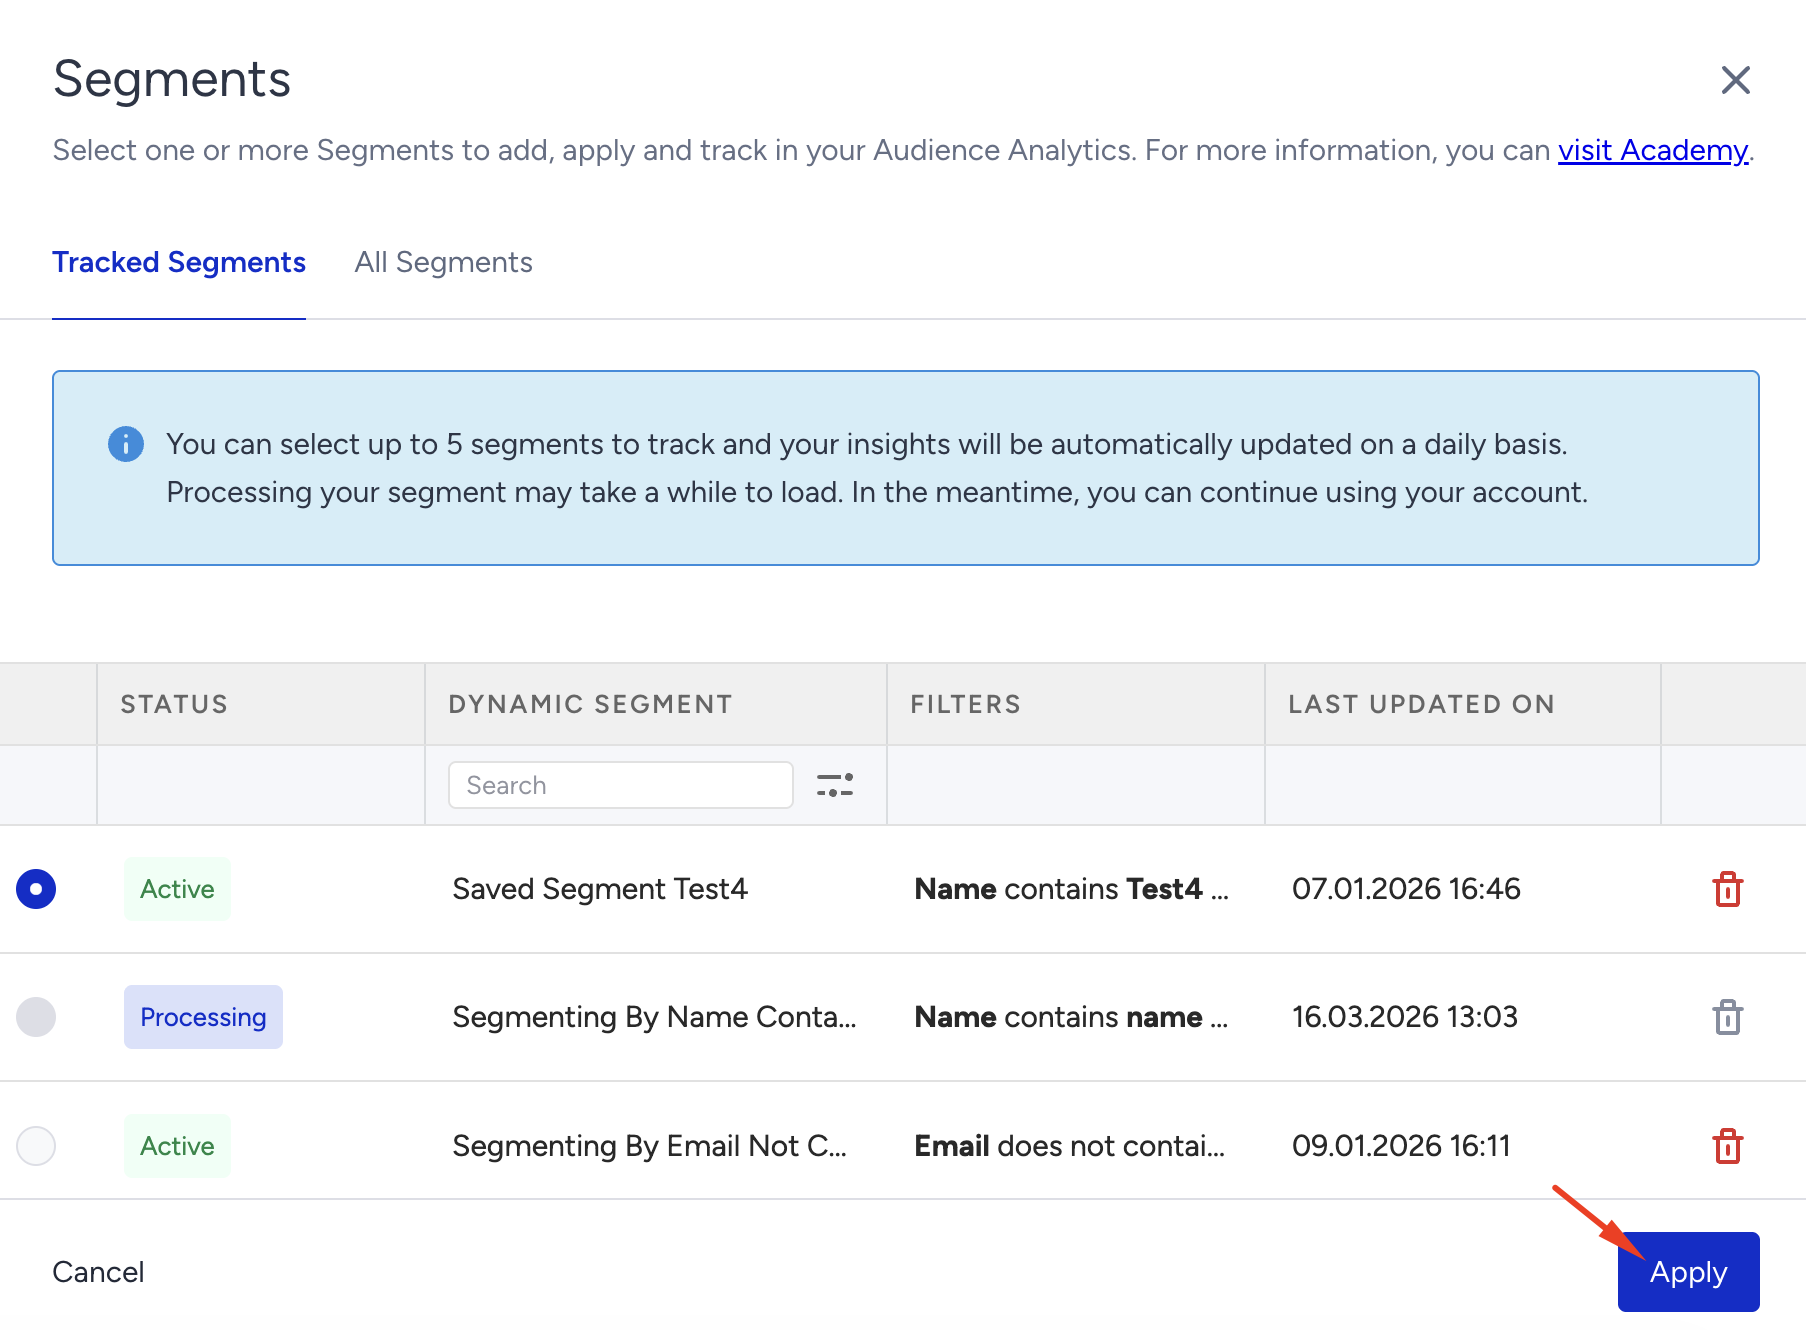
Once it is active, you can choose that “tracked segment” and apply it. Once applied, you can see the results instantly.
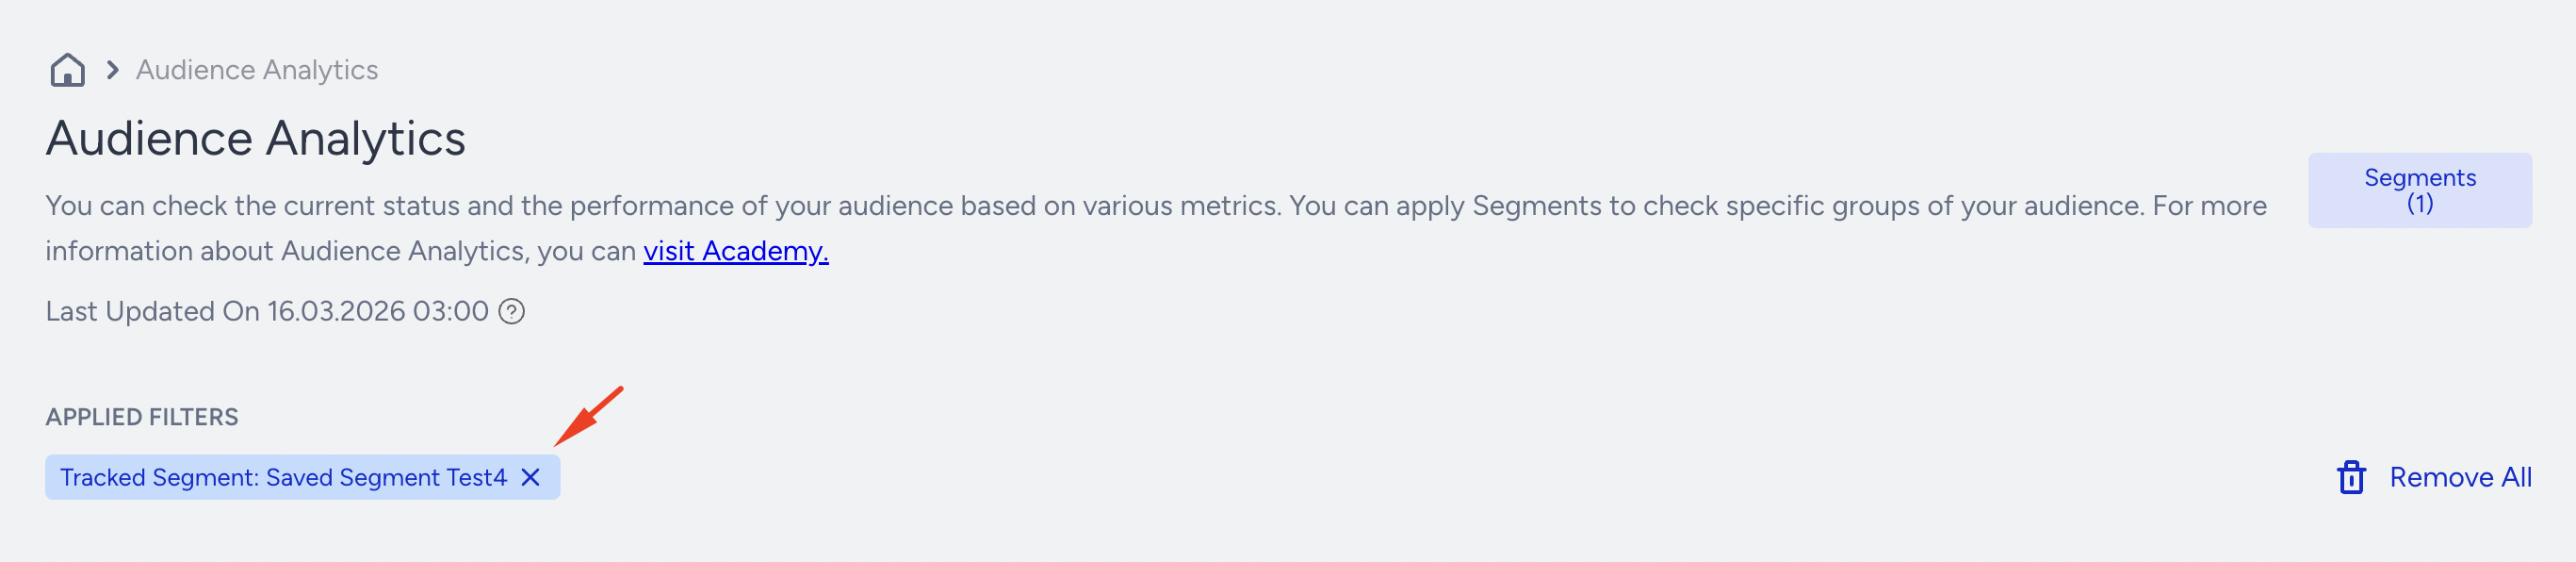
You can see the label of “Tracked Segment: {segment name}” there:
If you'd like to start tracking a new segment, simply follow the steps below to create it and begin tracking right away.
Add a Tracked Segment from Segment Filter
If you don’t have a dynamic segment created for tracking purposes, or want to start building a segment and begin tracking it without visiting the Segment pages, you can use Save and Track.
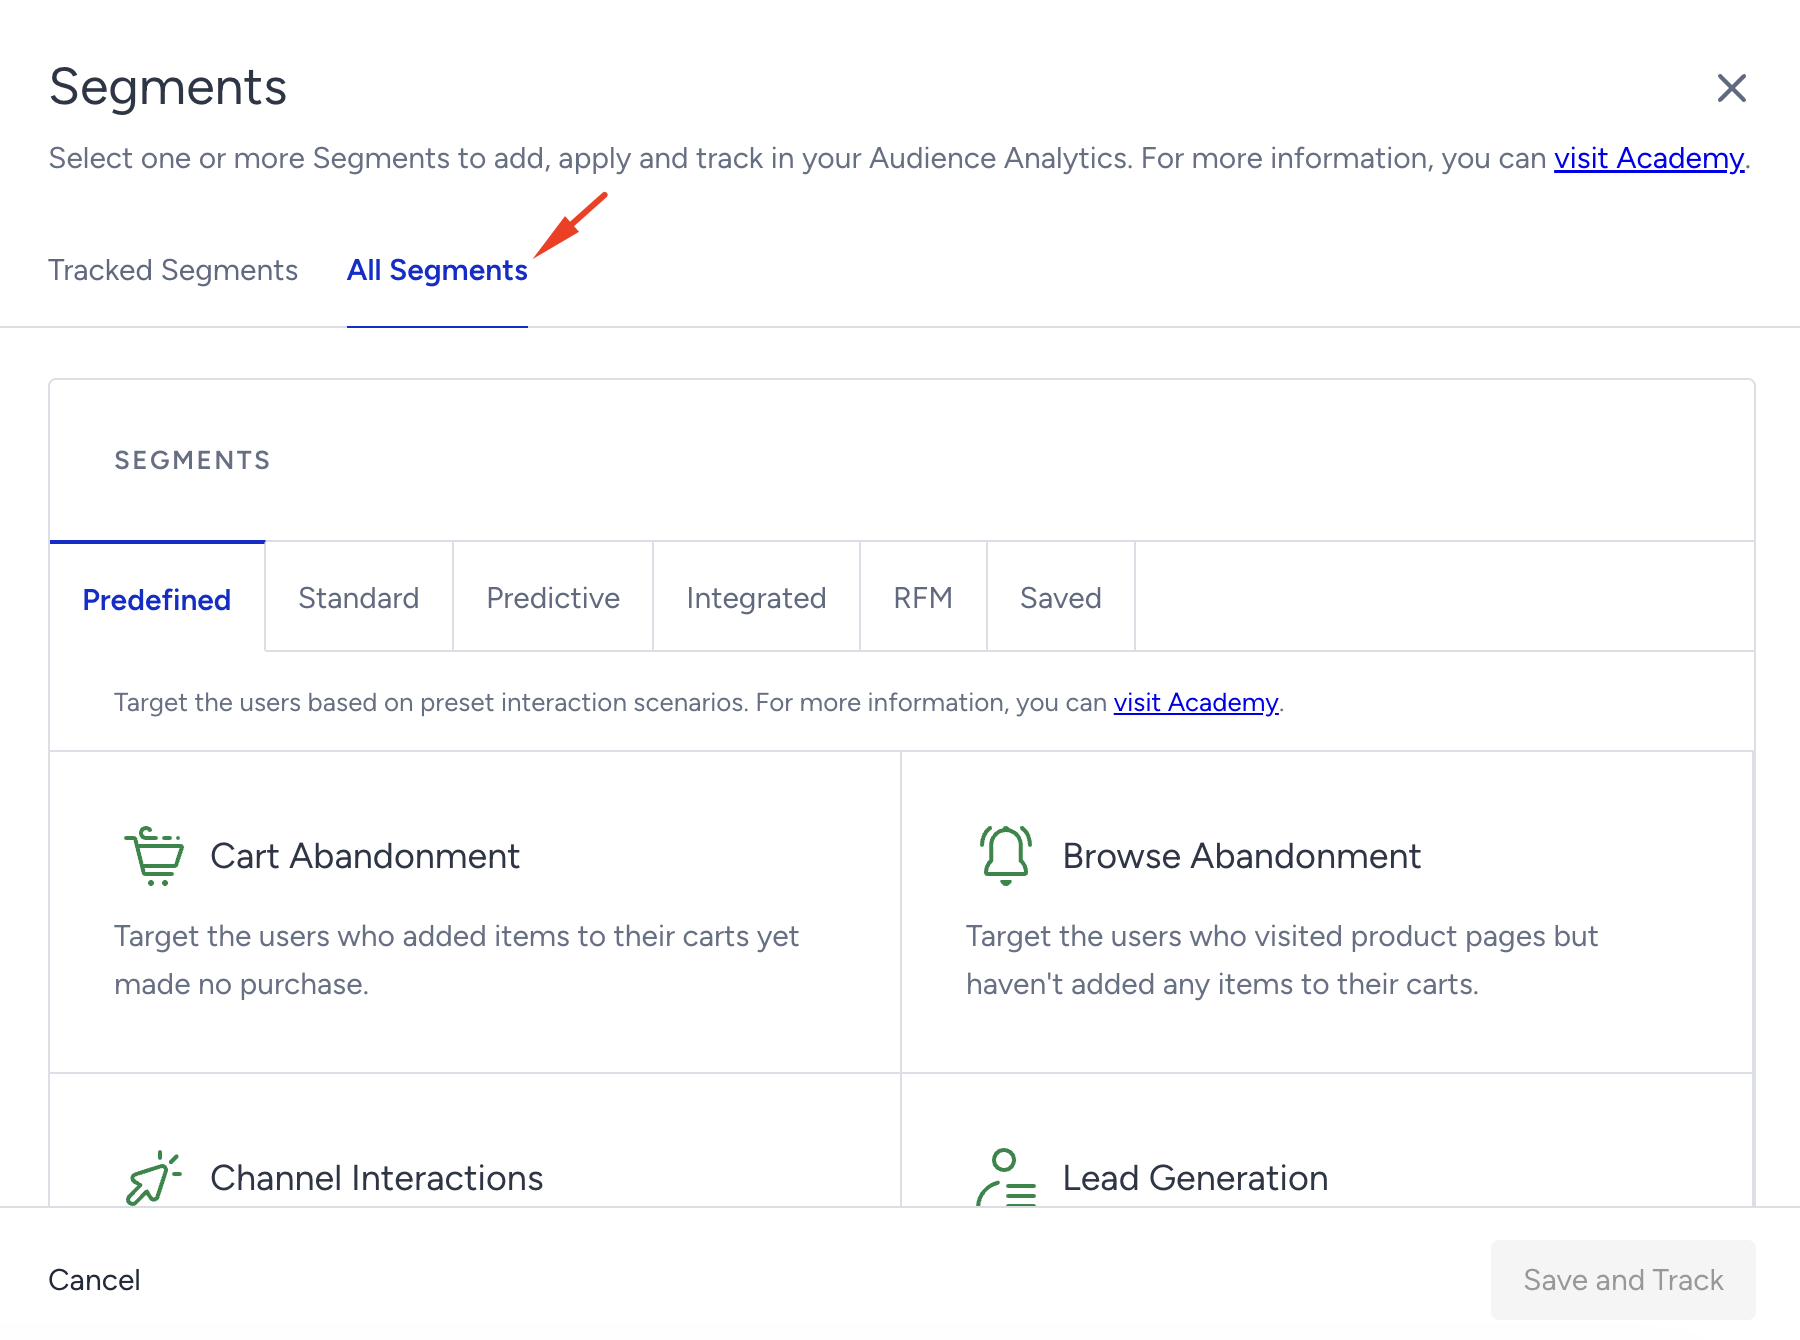
Click the Segments button on the homepage.
Go to the All Segments tab in the side modal.
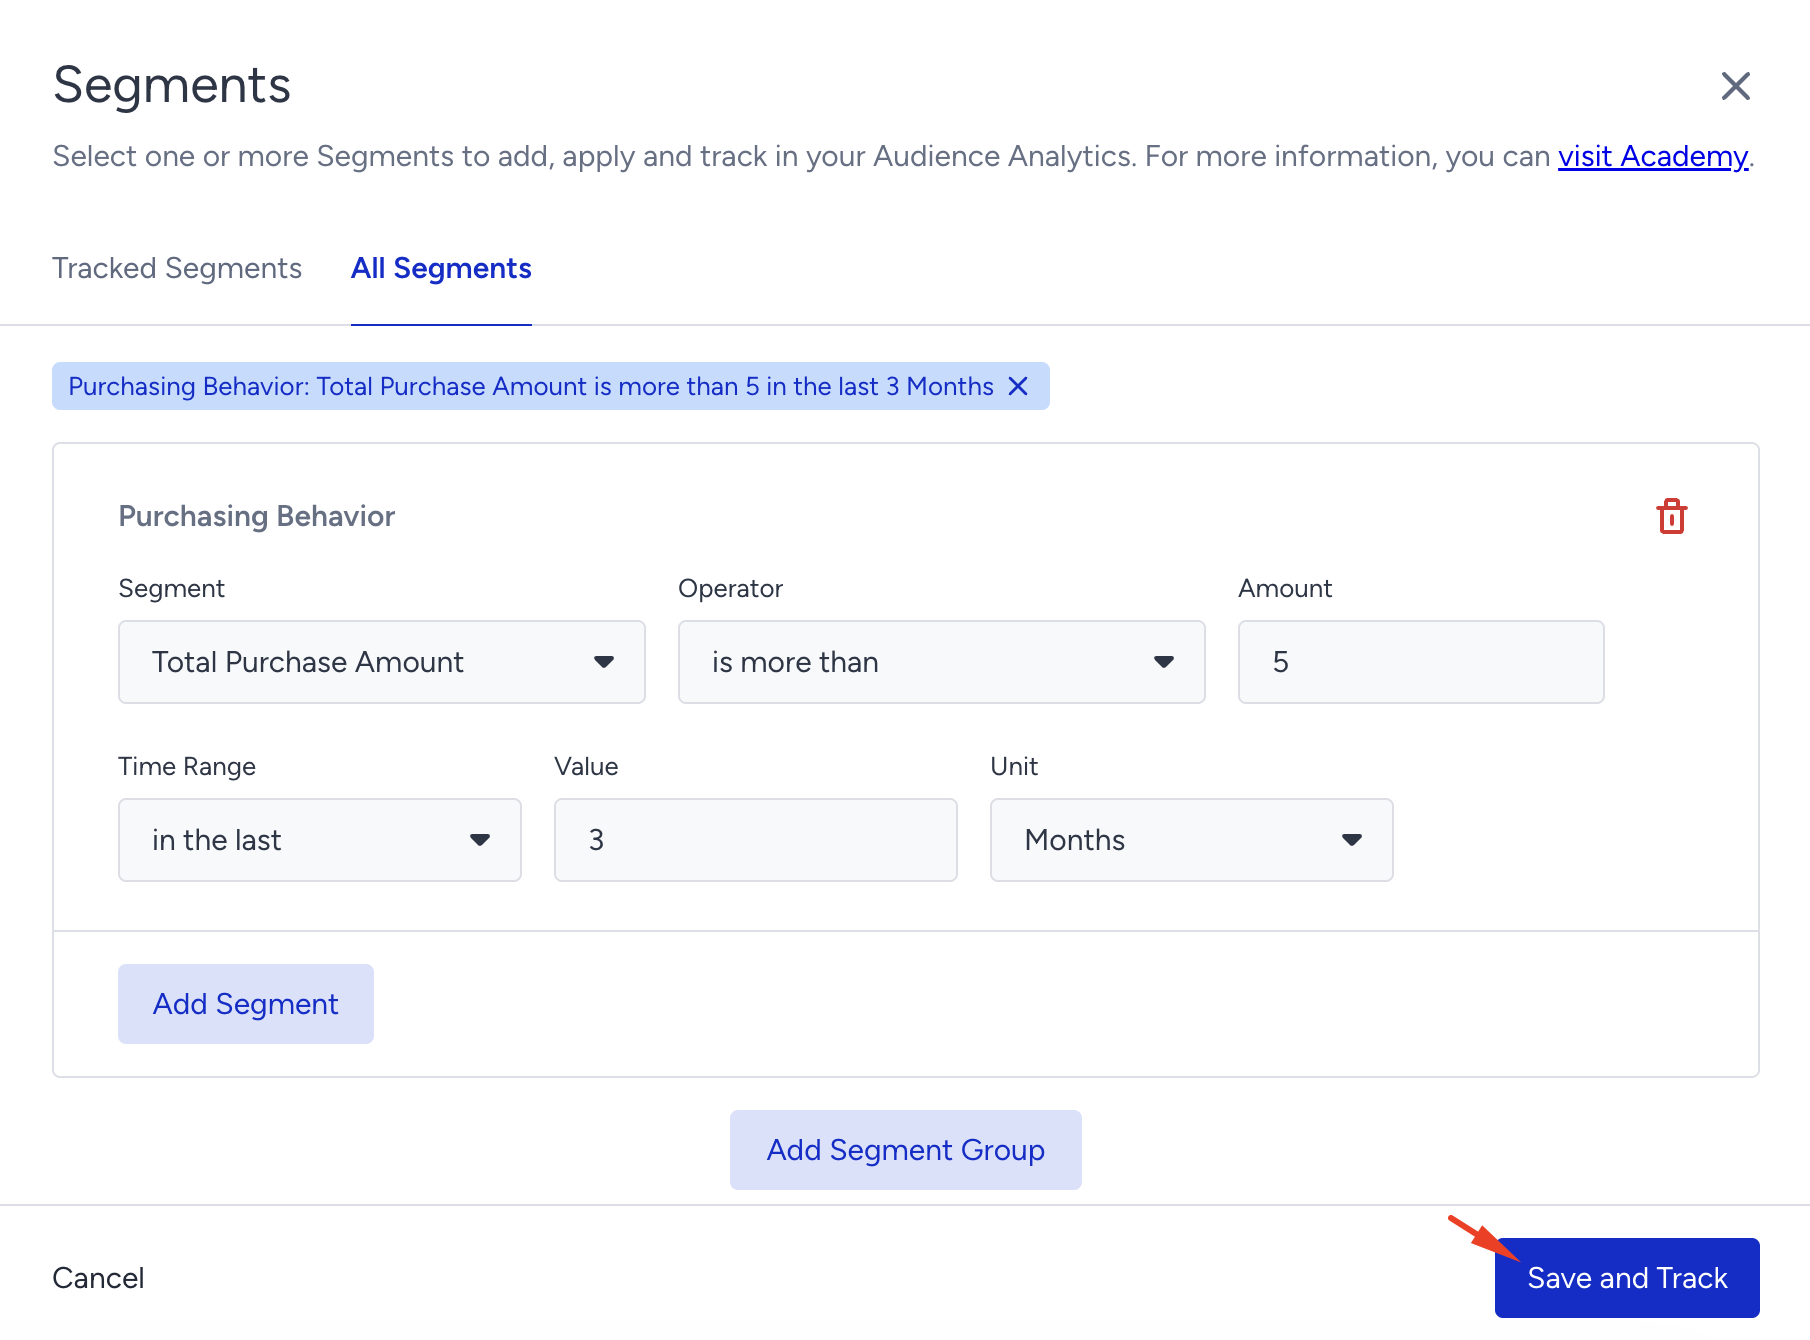
After creating the segment, click the Save and Track button.
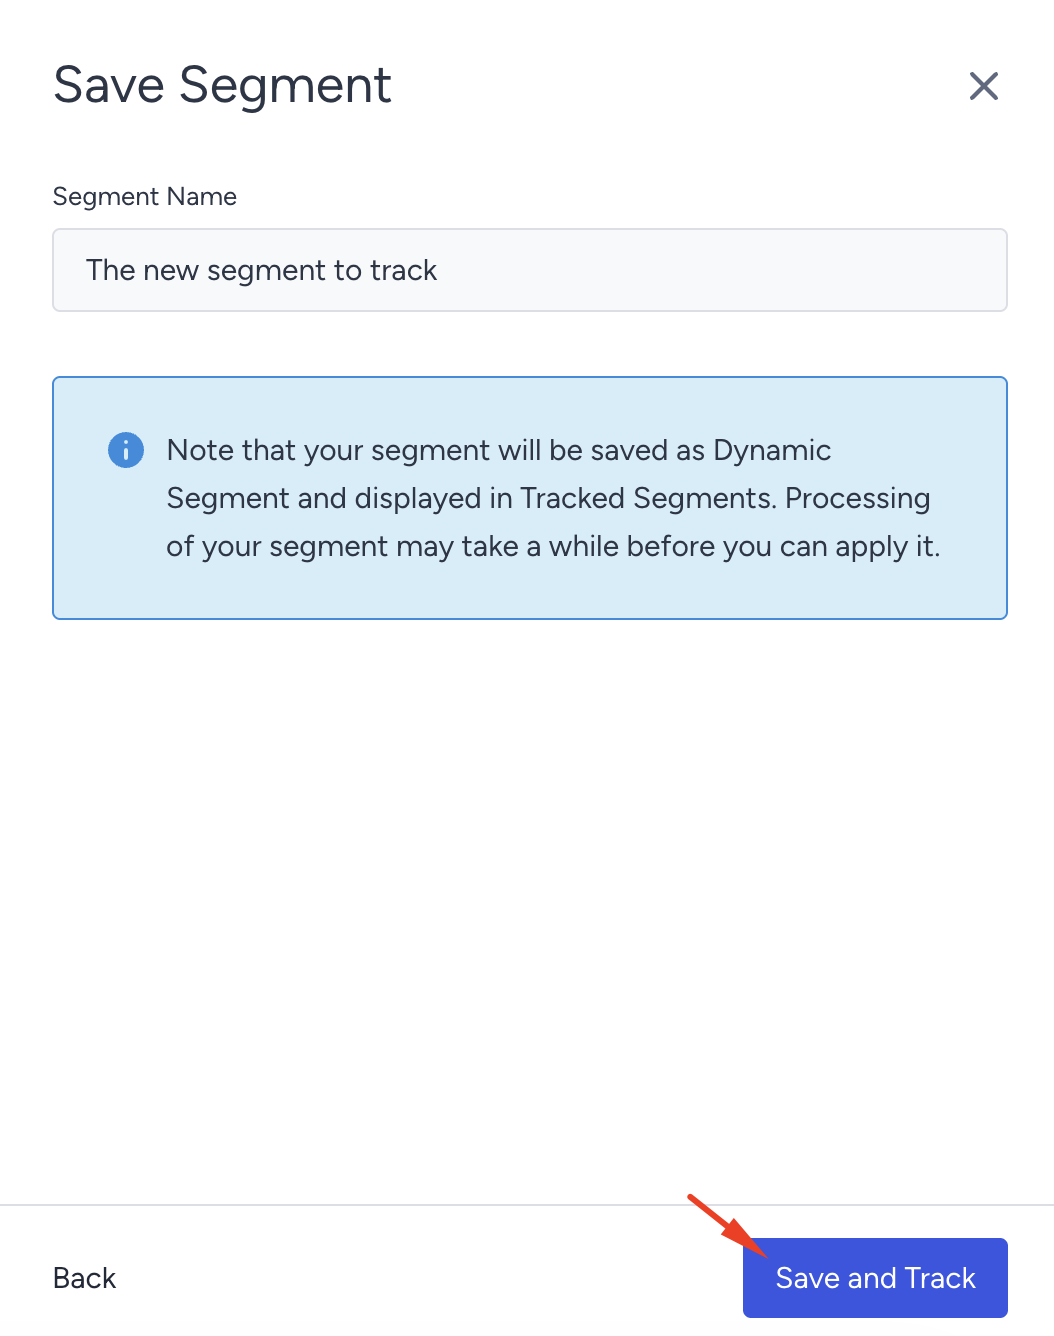
Your segment will be saved as a Dynamic Segment and displayed in Tracked Segments. Enter a segment name and click the Save and Track button.
Once it's confirmed, a success toaster will appear. You'll be notified by email when the tracked segment is ready.
You can also use this newly created Dynamic Segment in your campaigns later on.