your title goes here
Suggested Reading: For further details on web push stats, refer to Web Push Channel Analytics.
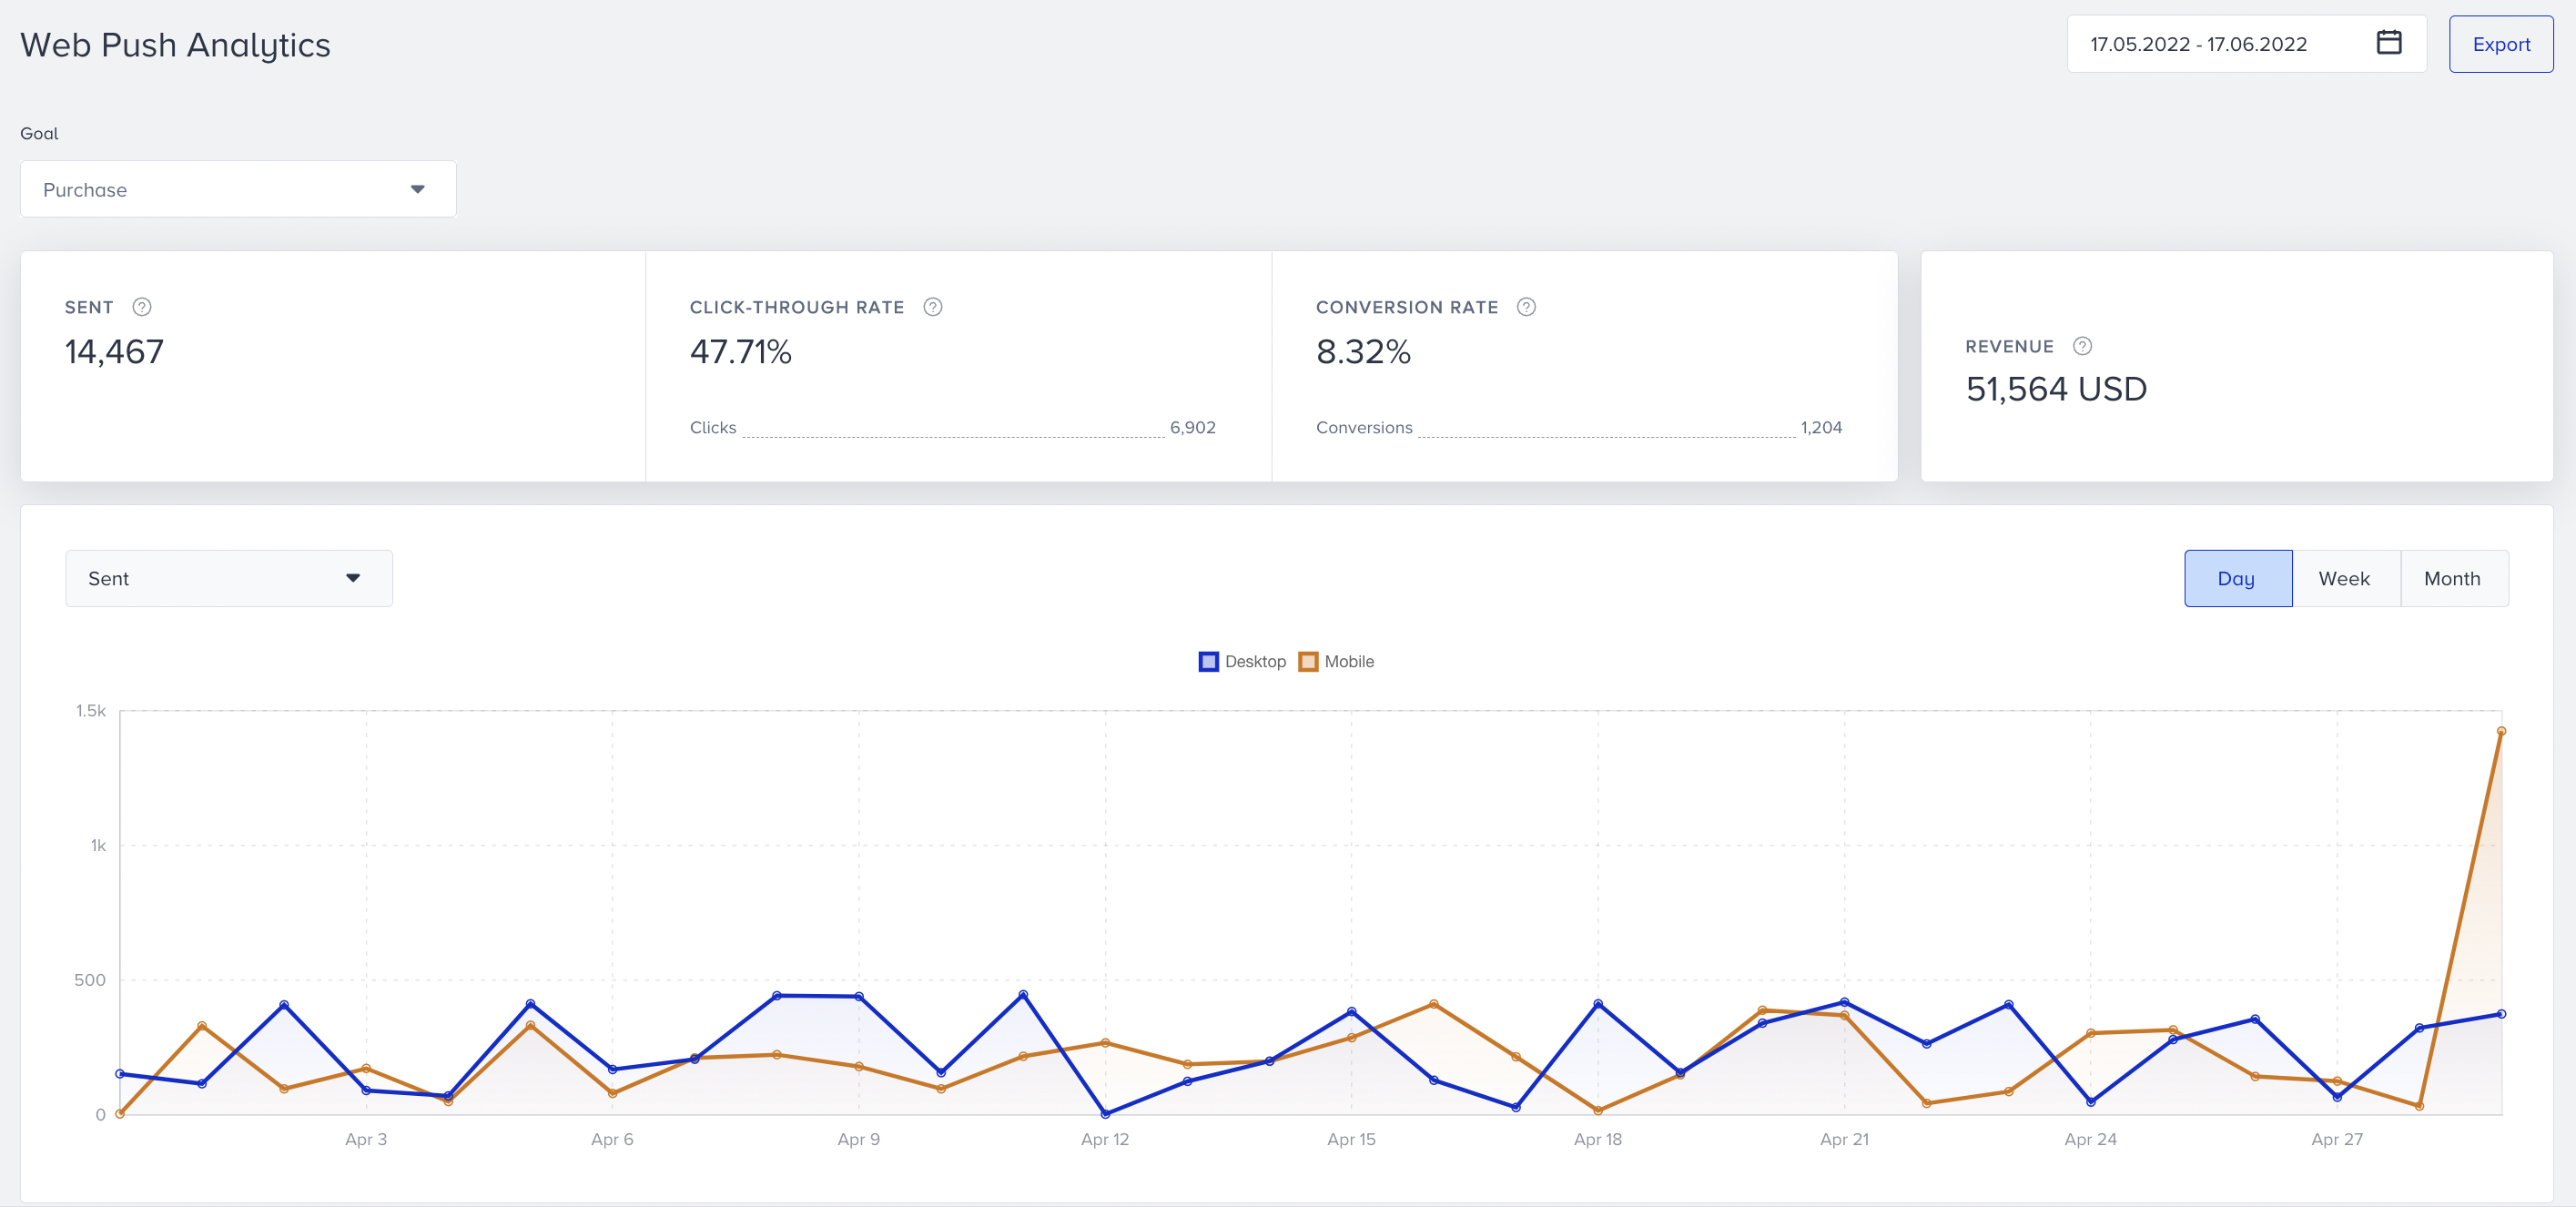
You can evaluate the results of your Web Push channel with Web Push Analytics and Live Stats.
Web Push Analytics
You can evaluate each web push (element) you add to your journey flow while it is running.
You can see the Sent, Click, Click Rate, Conversions, Conversion Rate, and Revenue metrics, along with their trends.
Live Stats
After you launch your journey, you can see the Arrived and Reachable figures on the Web Push element on the canvas.
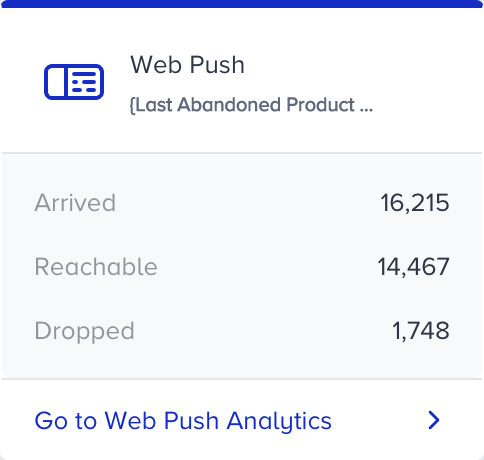
- Arrived displays the number of users who have arrived at the Web Push element.
- Reachable displays the number of reachable users on Web Push.
- Dropped displays the number of unreachable users on Web Push.