Each campaign has its own analytics page. You can filter analytics by date range, goal, report type (View-Through or Click-Through), and platform (iOS, Android, or both). You can also export results as reports.
At the top of the page, summary metrics display Users, Conversion Rate, Total Clicks, and Revenue.
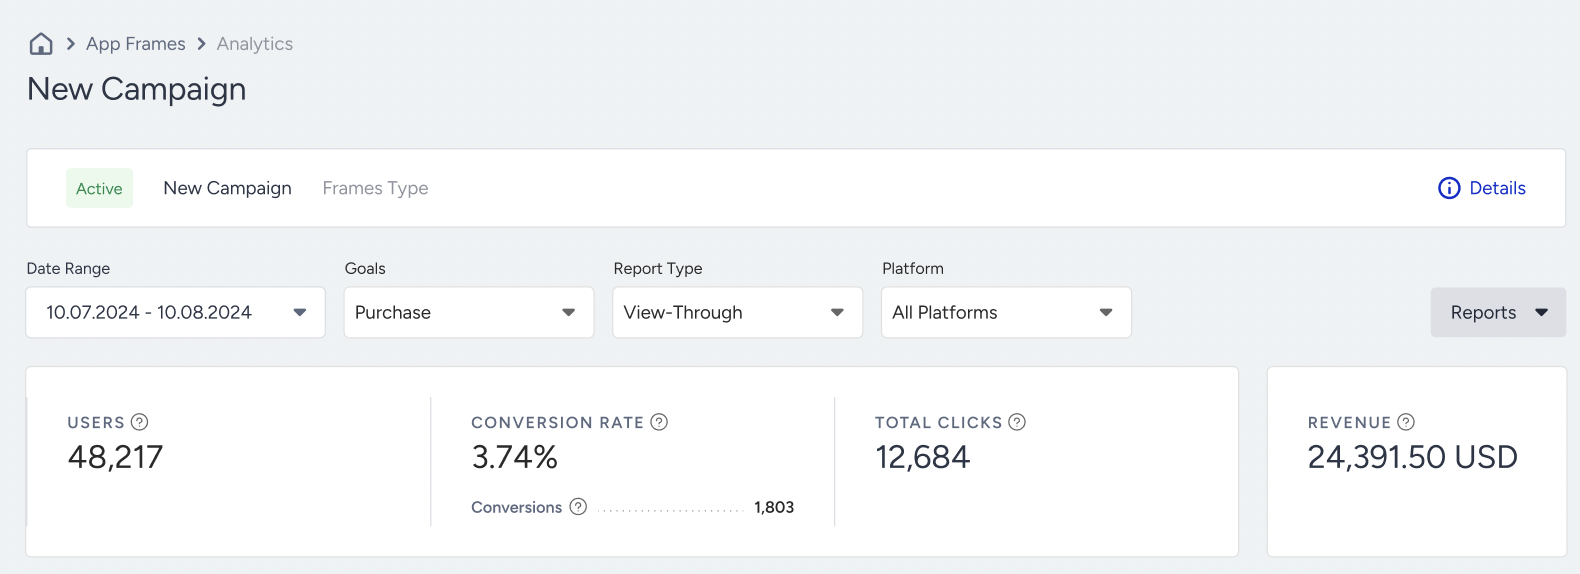
Users: The number of unique users who viewed your campaign.
Conversion Rate: The percentage of conversions to the impressions.
Conversions: The number of successful goal accomplishments.
Total Clicks: The total number of times that the users clicked the links in your campaign.
Revenue: The total value of the purchases made via your campaigns.
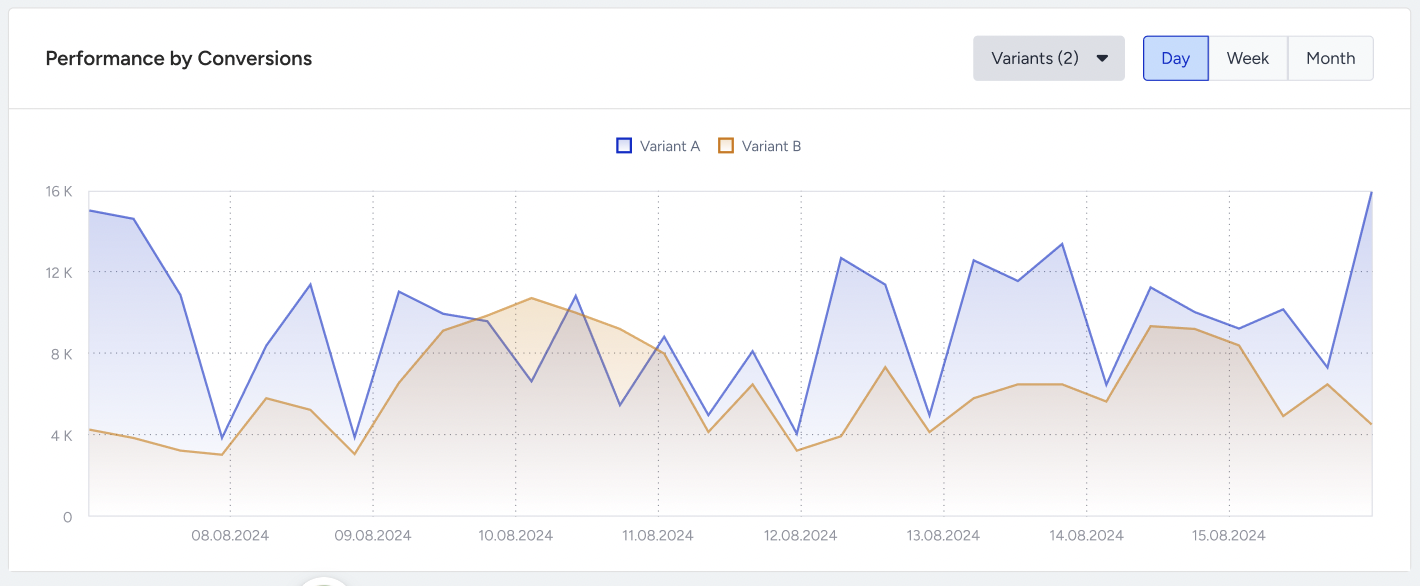
Below the summary, the analytics page includes the Performance by Conversions chart for the selected metric, grouped by day, week, or month, with variant breakdowns.
The Performance by Elements shows the number of clicks each element received.
.png)
In the last section, the Variant Metrics table displays each variant's performance on the selected metrics.
.png)