Once you launch your app card, you can monitor its performance via campaign-level analytics.
Metrics
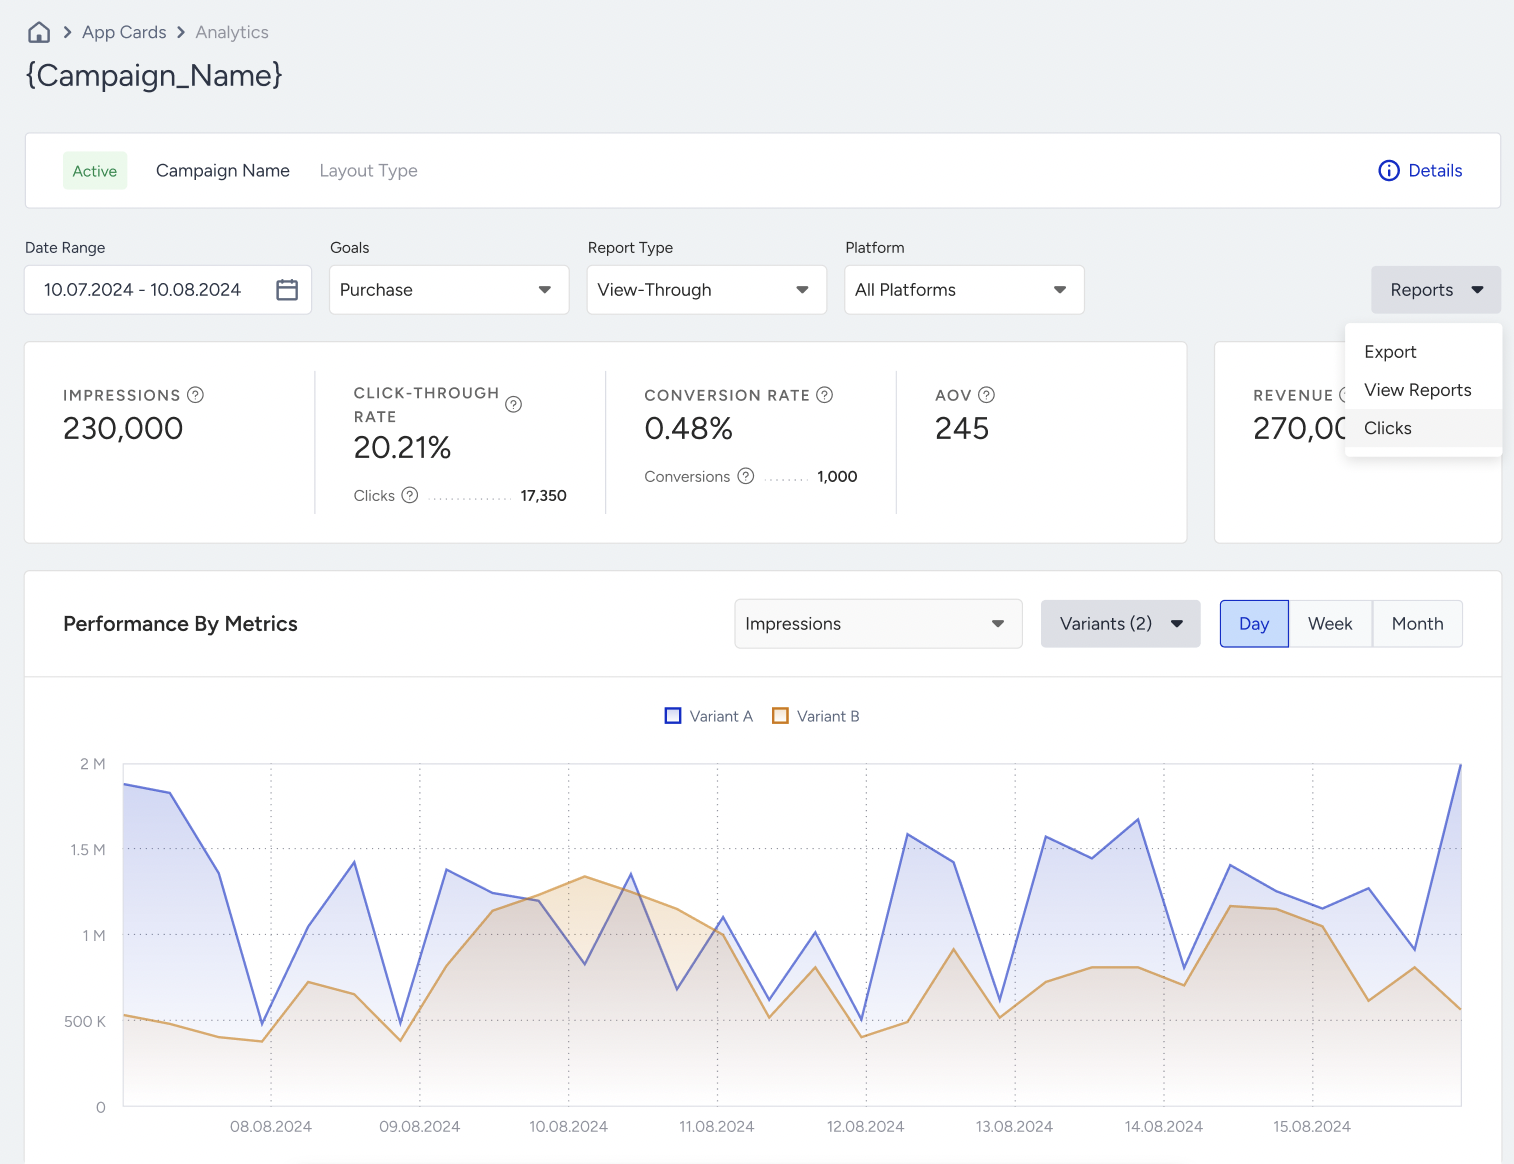
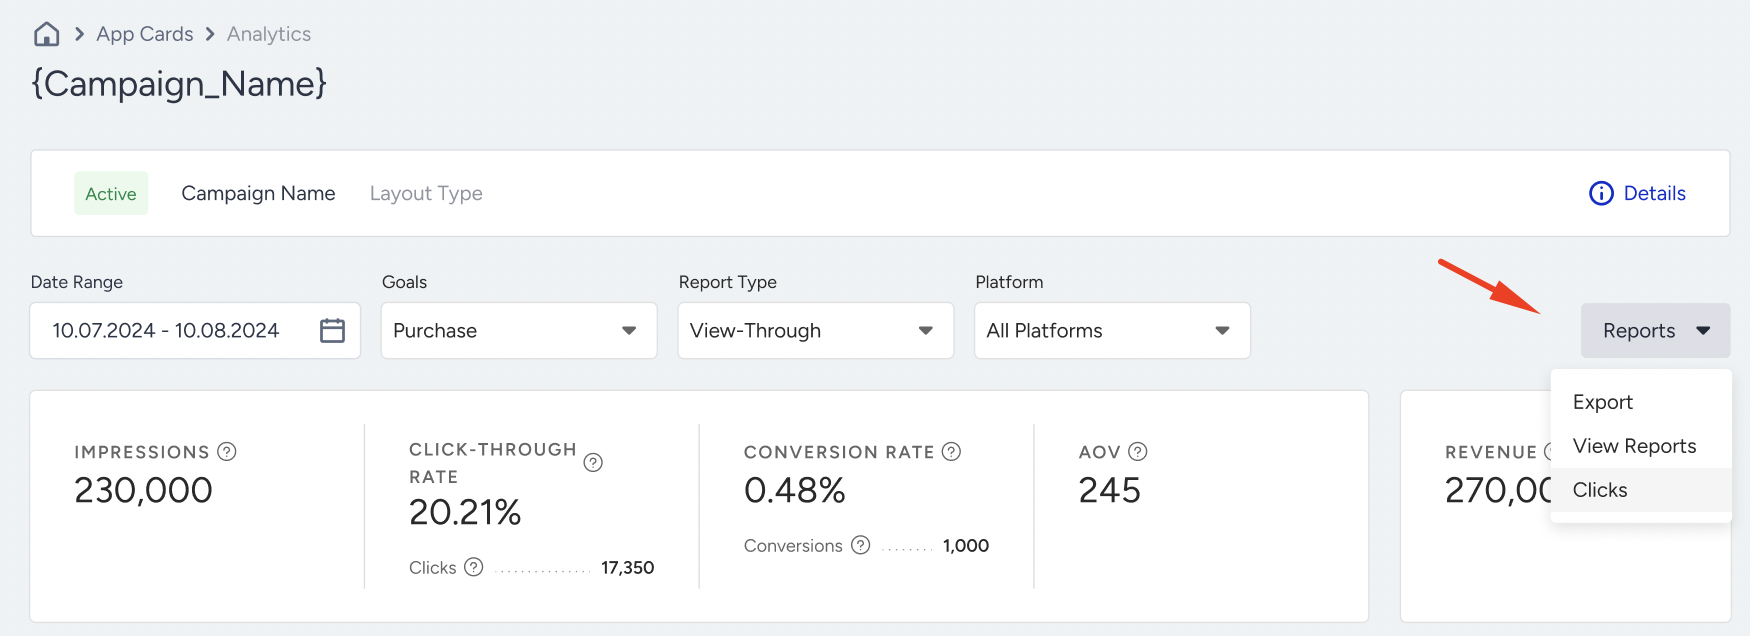
You can track the following metrics on this dashboard.
Impressions: The number of times that the users viewed your campaigns.
Clicks: The number of times that the users interacted with your variants.
Click-through Rate: The percentage of the Clicks to the Impressions.
Conversion Rate: The percentage of the Conversions to the Impressions.
Conversions: The number of goal completions that occurred within the defined duration after the message was viewed during the given date range.
Revenue: The total value of the Purchases made via your variants.
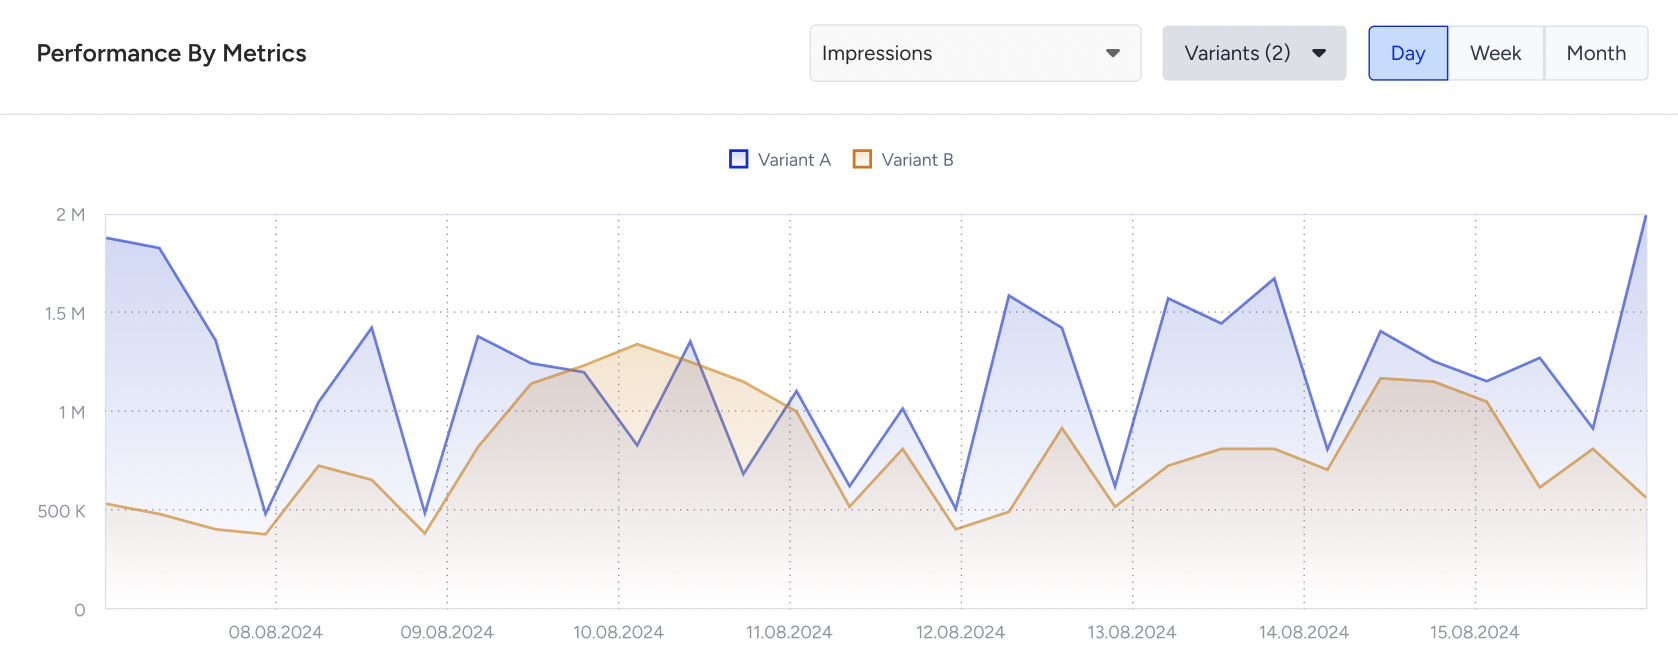
Performance by Metrics
You can compare the performance of variants based on impressions and conversion metrics.
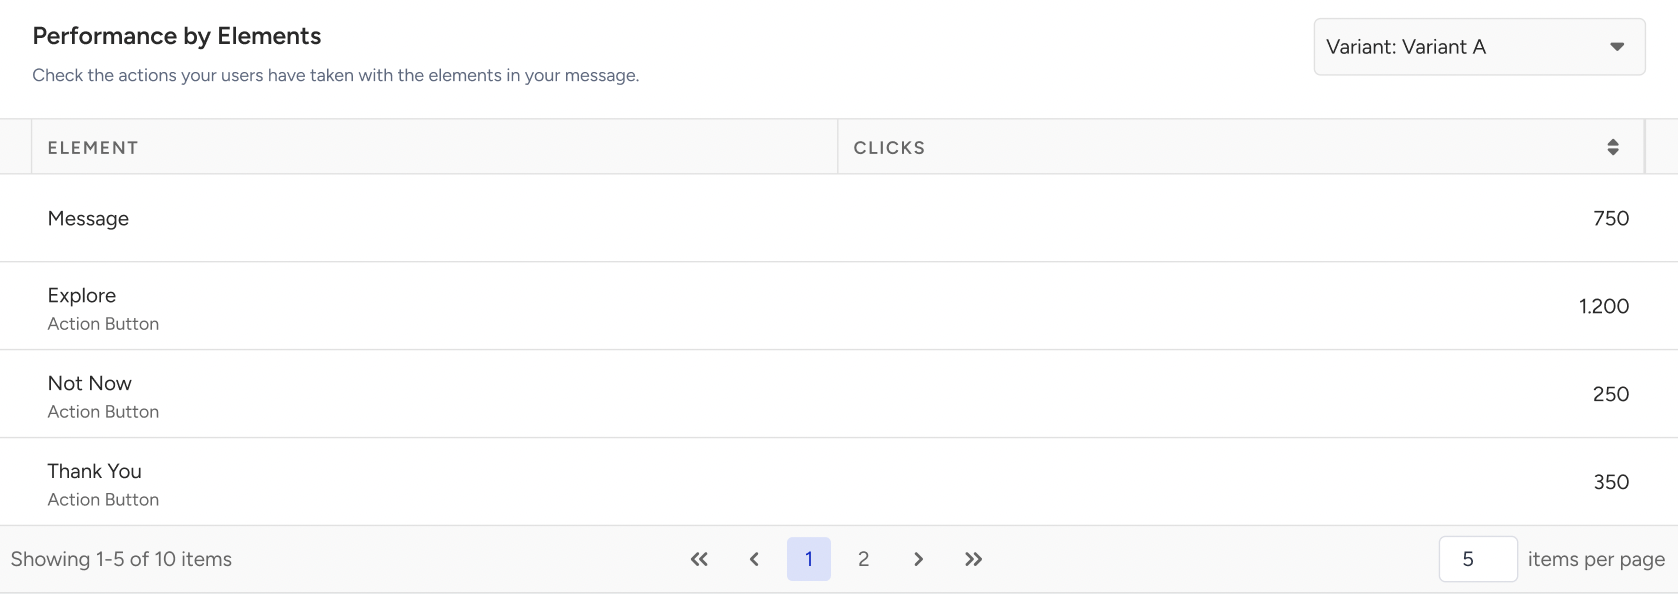
Performance by Elements
Performance by Elements is the number of Clicks to each element in your message design.
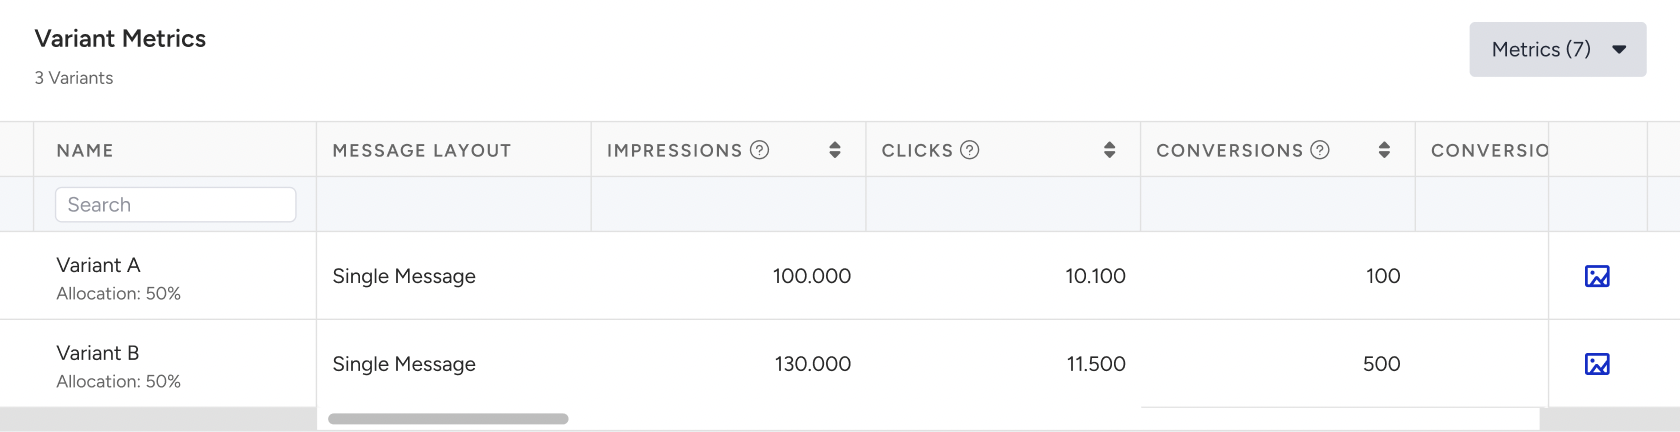
Variant Metrics
You can view a full metrics breakdown for each variant, along with related campaign elements such as images.
Filters and exports
You can filter the analytics based on date range, goals, report type, and platform.
You can export campaign analytics, including clicks.
The system provides the read/unread status for each message. This allows you to differentiate message states and implement corresponding UI or logic in your apps.
You can use the read/unread information for various use cases as follows:
Displaying visual indicators (e.g., "new" badge for unread messages)
Showing unread message count as a badge on the inbox icon or tab
Prioritizing unread content at the top of the inbox