Data Availability Note:
Widget, strategy-level, and product group metrics became available on April, 14, 2026. Behavior by selected date range:
Entirely before April 14, 2026 – These metrics are not shown on the analytics page.
Includes April 14, 2026 – These metrics are not shown on the analytics page.
Entirely after April 14, 2026 – Metrics are shown for all days in the range.
The Smart Recommender Analytics page shows how each key metric fits into the bigger picture: you can see how much revenue you’re generating (both direct and assisted), how many orders contain recommended products, and what your product engagement funnel looks like, starting from impressions, through clicks and add-to-carts, all the way to final purchases.
In this guide, you’ll learn how to interpret each element on the page so you can monitor the health and effectiveness of your recommendation strategies at a glance.
You can also find answers to the following questions:
To see the performance of Smart Recommender Campaigns with specific metrics and detailed reporting, navigate to Reports > Smart Recommender Analytics to reach this dashboard.
Personalize metric calculations: The Attribution Window
The Web Smart Recommender aims to "create a product purchase” that can occur within days or weeks after the user engages with a recommended product. The time between these two actions is dynamic and can be changed at any time.
Purchases are matched with the most recently clicked product in local storage (via the referred-products object) within the selected attribution window (e.g., 7 days).
To view the performance of Smart Recommender campaigns, Insider One offers a dynamic setup that lets you customize the “time allowed between an engagement (click) and the goal action (purchase),” known as the Attribution Window.
The attribution window enables you to see the true performance. For example, imagine you are a fast-moving goods retailer, and your customers complete a purchase on the same day, or even in the same session. However, a furniture retailer's customer can complete their order in 14 days or even within a month. If both companies use the same 7-day attribution window, the recommender analytics won’t include the furniture customer's purchase of a recommended product on the 10th day after the click. Therefore, you won’t be able to see the true performance. Hence, select the window span that best reflects your customers' behavior to tailor your analytic metric calculations to your end-users' behavior.
The attribution window is the time allowed for an end user to complete the purchase of a clicked product. It can be the same session, 1 day, 7, 14, 30, or 90 days.
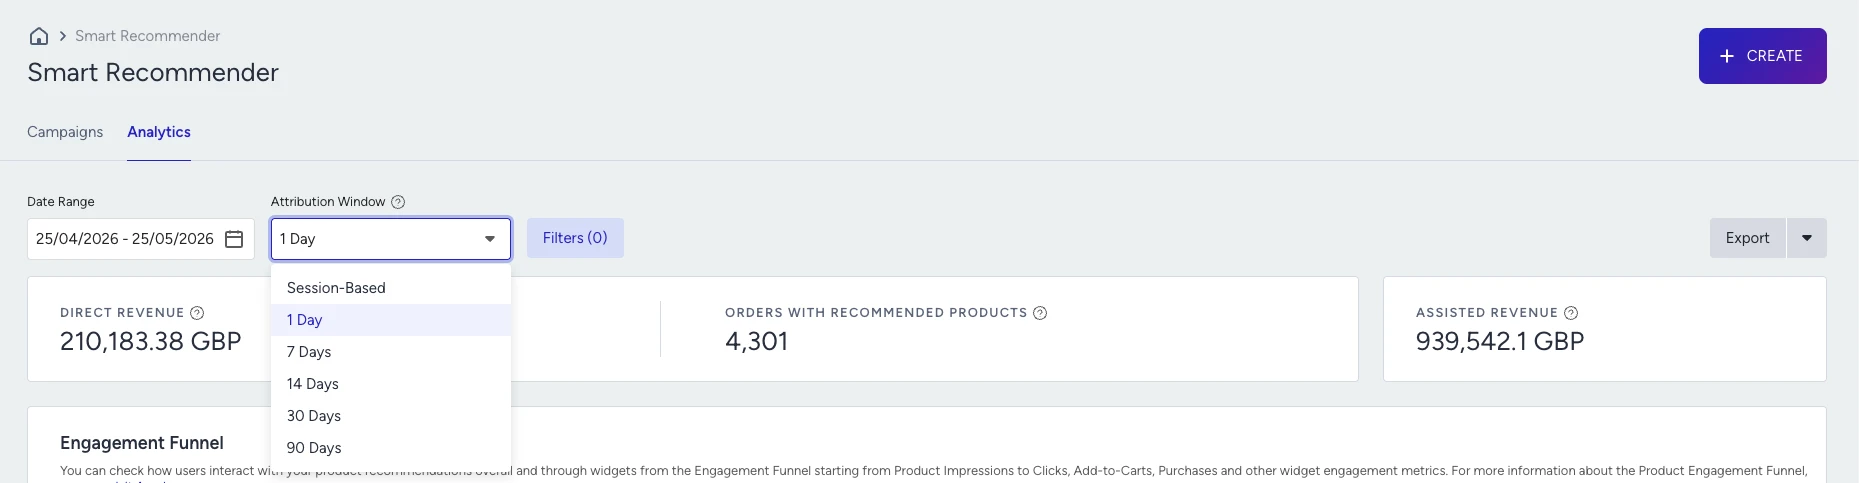
Session-based: The session starts when the user lands on the website and is terminated after 30 minutes of inactivity. Campaigns and products with click and purchase logs sharing the same session ID will be counted as a session-based conversion. Insider One sends one viewable impression of the event per session. However, a user can have multiple clicks, add to carts, and purchases from the same campaign in the same session.
1 Day: Purchase must be completed within the following 24 hours of the click event.
7 Days: Purchase must be completed within the following 7 days of the click event.
14 Days: Purchase must be completed within the following 14 days of the click event.
30 Days: Purchase must be completed within the following 30 days of the click event.
90 Days: Purchase must be completed within the following 90 days of the click event
How is the attribution window applied to direct revenue?
Events | Click | Purchase | Revenue |
|---|---|---|---|
Day 1 | Product 1 | ||
Day 5 | Product 2 | Product 1 | Revenue 1 |
Day 8 | |||
Day 13 | Product 2 | Revenue 2 | |
Day 25 | Product 3 | Product 3 | Revenue 3 |
Product 1 was clicked on day 1 and purchased on day 5, indicating that the end user took 4 days to complete the conversion funnel.
Revenue 1 will be added to direct revenue when selecting a 7, 14, 30, or 90-day attribution window.
Product 2 was clicked on day 5 and purchased on day 13, which means it took the end user 8 days to complete the conversion funnel.
Revenue 2 will be added to direct revenue after selecting a 14, 30, or 90-day attribution window.
Product 3 was clicked on day 25 and purchased on the same day, but not during the same session, which means it took the end user one day to complete the conversion funnel.
Revenue 3 will be added to direct revenue when selecting a 1, 7, 14, 30, or 90-day attribution window.
Filter your results
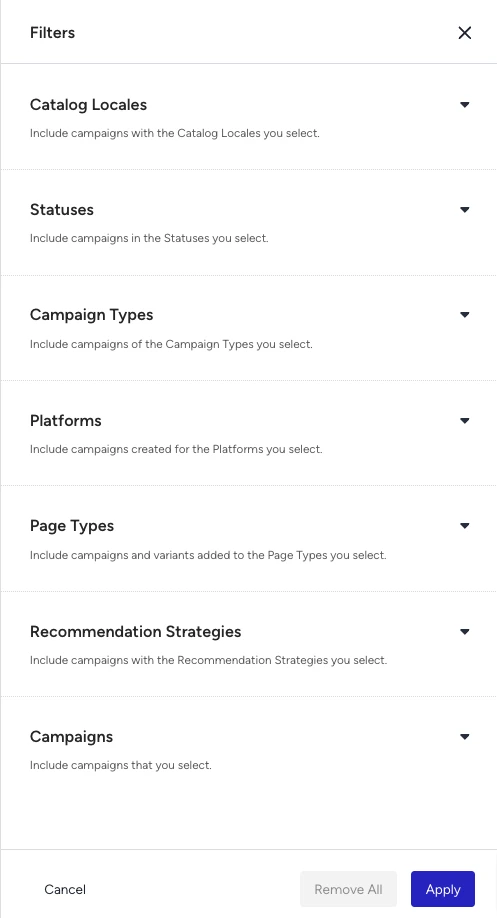
To narrow down the Smart Recommender Analytics results, you can use the date picker and the Filters button.
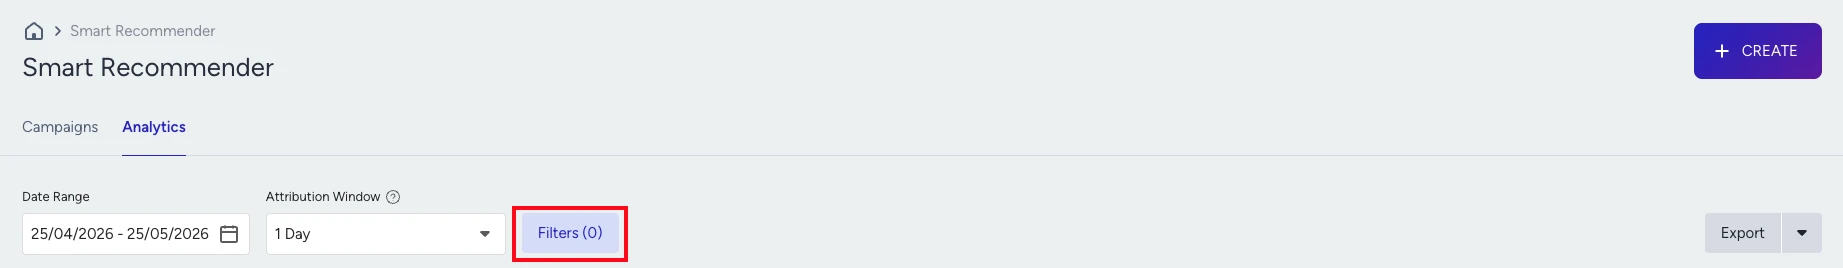
You can apply page type, platform type, and campaign status filters. These filters enable you to list campaigns on the same page and platform types for a reasonable comparison.
Compare the Date Range
You can compare two distinct date ranges (each up to 90 days) side by side:
See the increase or decrease rates on Engagement Funnel Metrics across the two ranges.
Comparison is available for each metric table: Campaign and Variant Metrics, Product Metrics, Group Product Metrics, and Category Metrics.
The metrics for each selected date range are shown on separate tabs.
Comparison is ideal for:
Seasonal analysis (e.g., Black Friday vs. a regular week)
Measuring the "discovery effect" or assisted revenue across different periods
Revenue Performance
Using direct and assisted revenue metrics, you can separately visualize the "discovery” and “direct attraction” effects of Smart Recommender. 
Direct Revenue is the total revenue from products clicked in a recommendation widget and purchased by the user within the selected days of the attribution window. As the attribution window increases, more time will be available for a click to convert, so higher direct revenue is expected. For example, if a shopper purchases two units of Product D at 50 USD each after 7 days of clicking the same product in the recommendation widget, the direct revenue is 100 USD.
Orders with Recommended Products metric includes only completed checkouts where at least one purchased item was originally shown in a Smart Recommender widget and clicked before purchase. You can compare this number with your total checkout count to see how recommendations are infused into your orders.
Assisted Revenue, or discovery revenue, shows the total revenue from purchases of products that were not clicked in the recommendation but were purchased in the same session after clicking any product from the widget. This represents the discovery effect of recommendations. For example, a shopper clicks Product E, then checks out with Product F within 30 minutes. The revenue from Product F is recorded as assisted. If they also buy Product E, that portion is direct (and no assistance for E itself). For example, a shopper clicks Product G and Product H from the carousel, then checks out both items. They generate one order with recommended products.
Engagement Funnel
The user's journey, which begins with the first click on a Web Smart Recommender and concludes with the purchase of a recommended product, is visualized as a funnel on the Product Engagement Funnel.
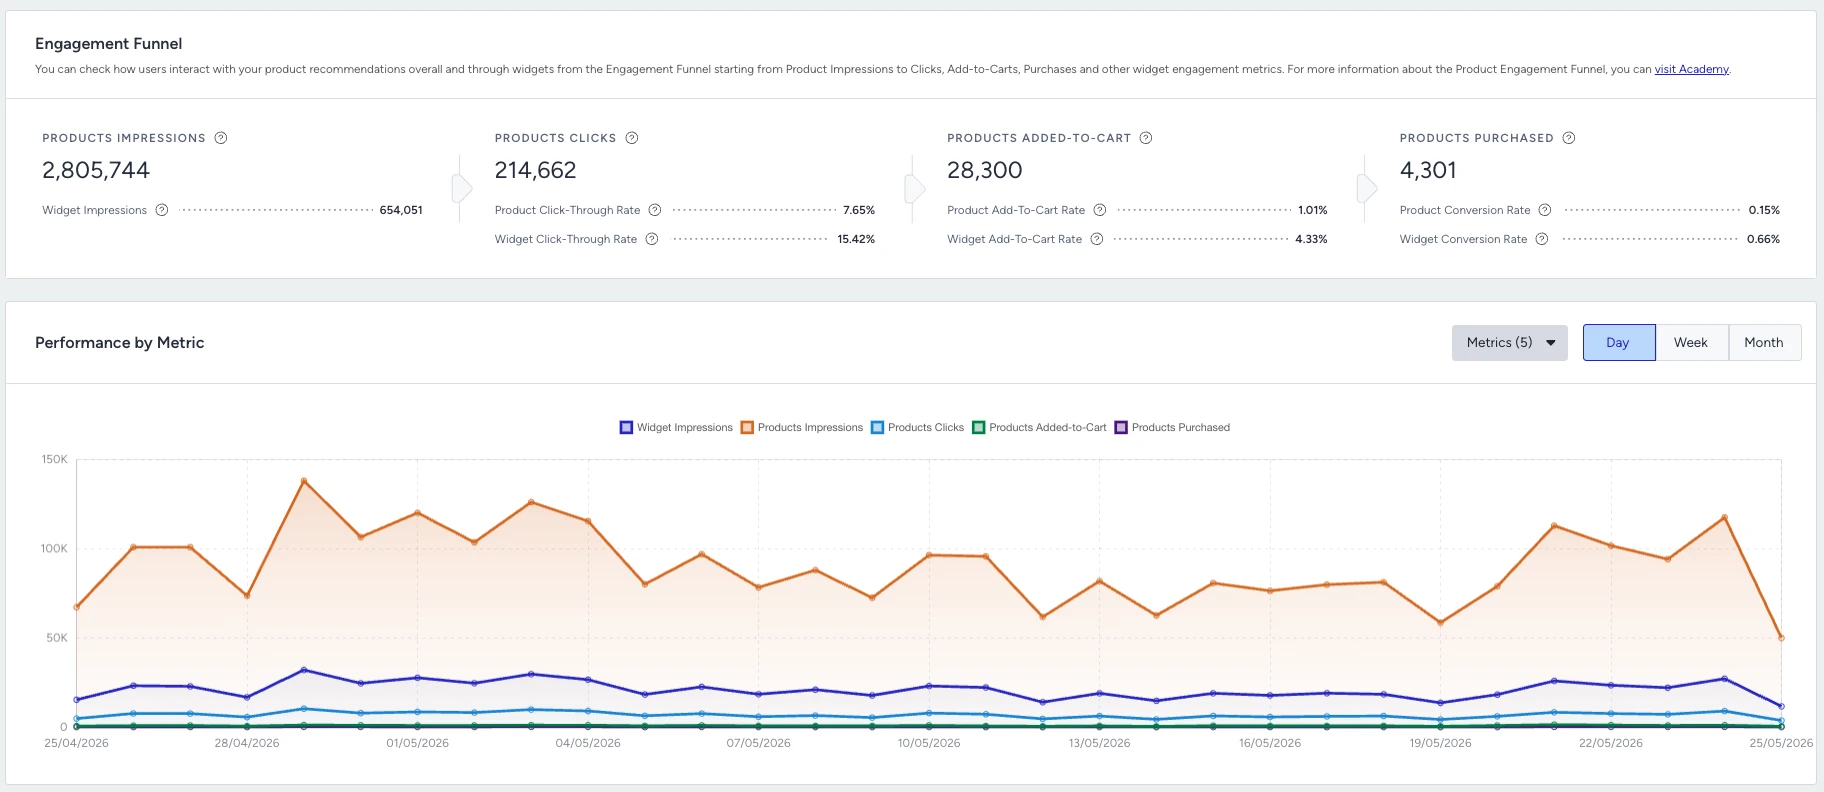
Product Impressions: When a recommended product is at least 50% visible on a shopper’s screen, it’s logged as an impression. If your carousel has 15 products (5 per slide), the first 5 generate impressions as soon as they become ≥50% visible. Swiping to the next slide logs new impressions for the next 5 products. Revisiting the same slide within 30 minutes (the same session) does not produce duplicate impressions.
For example, suppose 10 shoppers each scroll through 2 slides (5 products per slide). They collectively produce 10×(5+5) = 100 product impressions, assuming none re-viewed the same slide within 30 minutes.
Product Clicks: Only clicks on an actual product card. Arrows, close buttons, or blank spaces in the carousel do not count. Each valid click logs a product click event. If the user clicks “Add to Cart” directly on the carousel, Smart Recommender first logs a product click, then an add-to-cart event.
For example, a shopper clicks Product A 3 times in the carousel: you get 3 click events. If they also press “Add to Cart” on Product A, you immediately see 1 additional add-to-cart log.
Product Add to Cart: Logs whenever the user adds a recommended product to their cart within the valid time window (up to 30 days after the last click). Two main cases:
Directly from carousel – Tapping “Add to Cart” on the recommended product.
After visiting product page – If the user clicked the recommended product, landed on the product page, and added it to the cart within 30 days.
Add to carts are not unique, they are SKU quantity based, which means each individual SKU that is added to cart will be counted as an ATC. For example, a user clicks product A from the widget, and adds 3 of product A in their cart. Insider One count this as 3 add to carts from that campaign.
For example, let’s say a shopper clicks Product B today but only returns to the product detail page 5 days later and adds it to the cart. As it’s under 30 days, that add-to-cart event is attributed to Product B’s recommendation click.
Product Purchases: If a shopper clicked a recommended product, then purchased that same product or its variant (e.g., different color or size) within the set time window (session/1 day/7 days/14 days/30 days/90 days), each unit bought is considered a direct purchase.
Purchases are not checkouts, they are number of products that are purchases. Purchases are not unique, they are SKU quantity based, which means each individual SKU that is purchased will be counted as a purchase. For example, a user clicks product A from the widget, and purchases 3 of product A in a checkout. Insider One counts this as 3 purchases from that campaign.
For example, a shopper clicks Product C once and ends up buying 4 units of that exact item in a single checkout. That counts as 4 product purchases for direct conversion.
PCTR Rate (Product Click Through Rate): PCTR Rate = Product Clicks / Product Impressions, and measures how often displayed products are clicked.
PATC Rate (Product Add-to-Cart Rate): PATC Rate = Product Add to Cart / Product Impressions measures how often viewed products are added to cart.
PCR (Product Conversion Rate): PCR = Product Purchases / Product Impressions measures, among the items that were actually viewed, how many were eventually purchased.
Following metrics Product Click, Product ATC, and Product Conversions are not session-unique, meaning these actions by user will be counted each time even if it's the same product in the same session.
Product Impressions vs. Widget Impressions
Product Impression: Logged when a recommended product is at least 50% visible on a shopper's screen. Logged for each product separately.
Widget Impression: Logged when a recommendation widget is at least 50% visible on a shopper's screen. Logged only once per widget per session.
One product impression per product per session (30-min window)
Swiping carousel slides generates new product impressions for newly visible products
Revisiting the same slide within 30 minutes does not produce duplicate impressions
For example, 10 shoppers each scroll through 2 slides of 5 products → 10 × 10 = 100 product impressions; 10 widget impressions.
Product Clicks vs. Widget Clicks
Product Click: Logged when a recommended product is clicked. Logged for each product separately. Not session-unique, each click counts.
Widget Click: Logged when a widget is clicked by a shopper. Logged only once per widget per session.
Arrows, close buttons, or blank carousel spaces do not count. Clicking "Add to Cart" directly on the carousel logs a click and an add-to-cart event.
Rate Metrics
Metric | Formula | Measures |
|---|---|---|
PCTR (Product Click-Through Rate) | (Product Clicks / Product Impressions) × 100 | How often displayed products are clicked |
WCTR (Widget Click-Through Rate) (new) | (Widget Clicks / Widget Impressions) × 100 | How often a widget itself is engaged with |
PATCR (Product Add-to-Cart Rate) | (Product Add-to-Carts / Product Impressions) × 100 | How often viewed products are added to cart |
WATCR (Widget Add-to-Cart Rate) (new) | (Product Add-to-Carts / Widget Impressions) × 100 | How often a widget drives add-to-carts |
PCR (Product Conversion Rate) | (Product Conversions / Product Impressions) × 100 | How often viewed products are eventually purchased |
WCR (Widget Conversion Rate) (new) | (Product Conversions / Widget Impressions) × 100 | How often a widget drives conversions |
Important Note on Variant Product Metric Collection
A user might click on a red shirt from the Web Smart Recommender campaign. Then, they can change the size or color of this shirt and proceed the journey with the blue color of the recommended shirt. In this case, Insider One compares the clicked and purchased products to make sure that they have the same group code and are variants of each other. Consequently, add to cart and purchase logs of the variant product (blue shirt as in the example) will be added to the originally recommended and clicked product’s (red shirt as in the example) metrics. In essence, even if the user substitutes the recommended product with a variant, the revenue and engagement metrics associated with the variant will still contribute to the overall metrics. This approach ensures that no revenue is lost in the process.
For example, a user is recommended the L size of a t-shirt. After going to the detail page, the user decides and purchases the M size. In this case, the sale of the M size is written to the overall recommendation revenue and the campaign revenue which has recommended L size product.
Campaign Analytics
The Campaign Analytics table enables you to create relations between Smart Recommender campaign parameters, such as page type, algorithm, and other relevant metrics, and performance.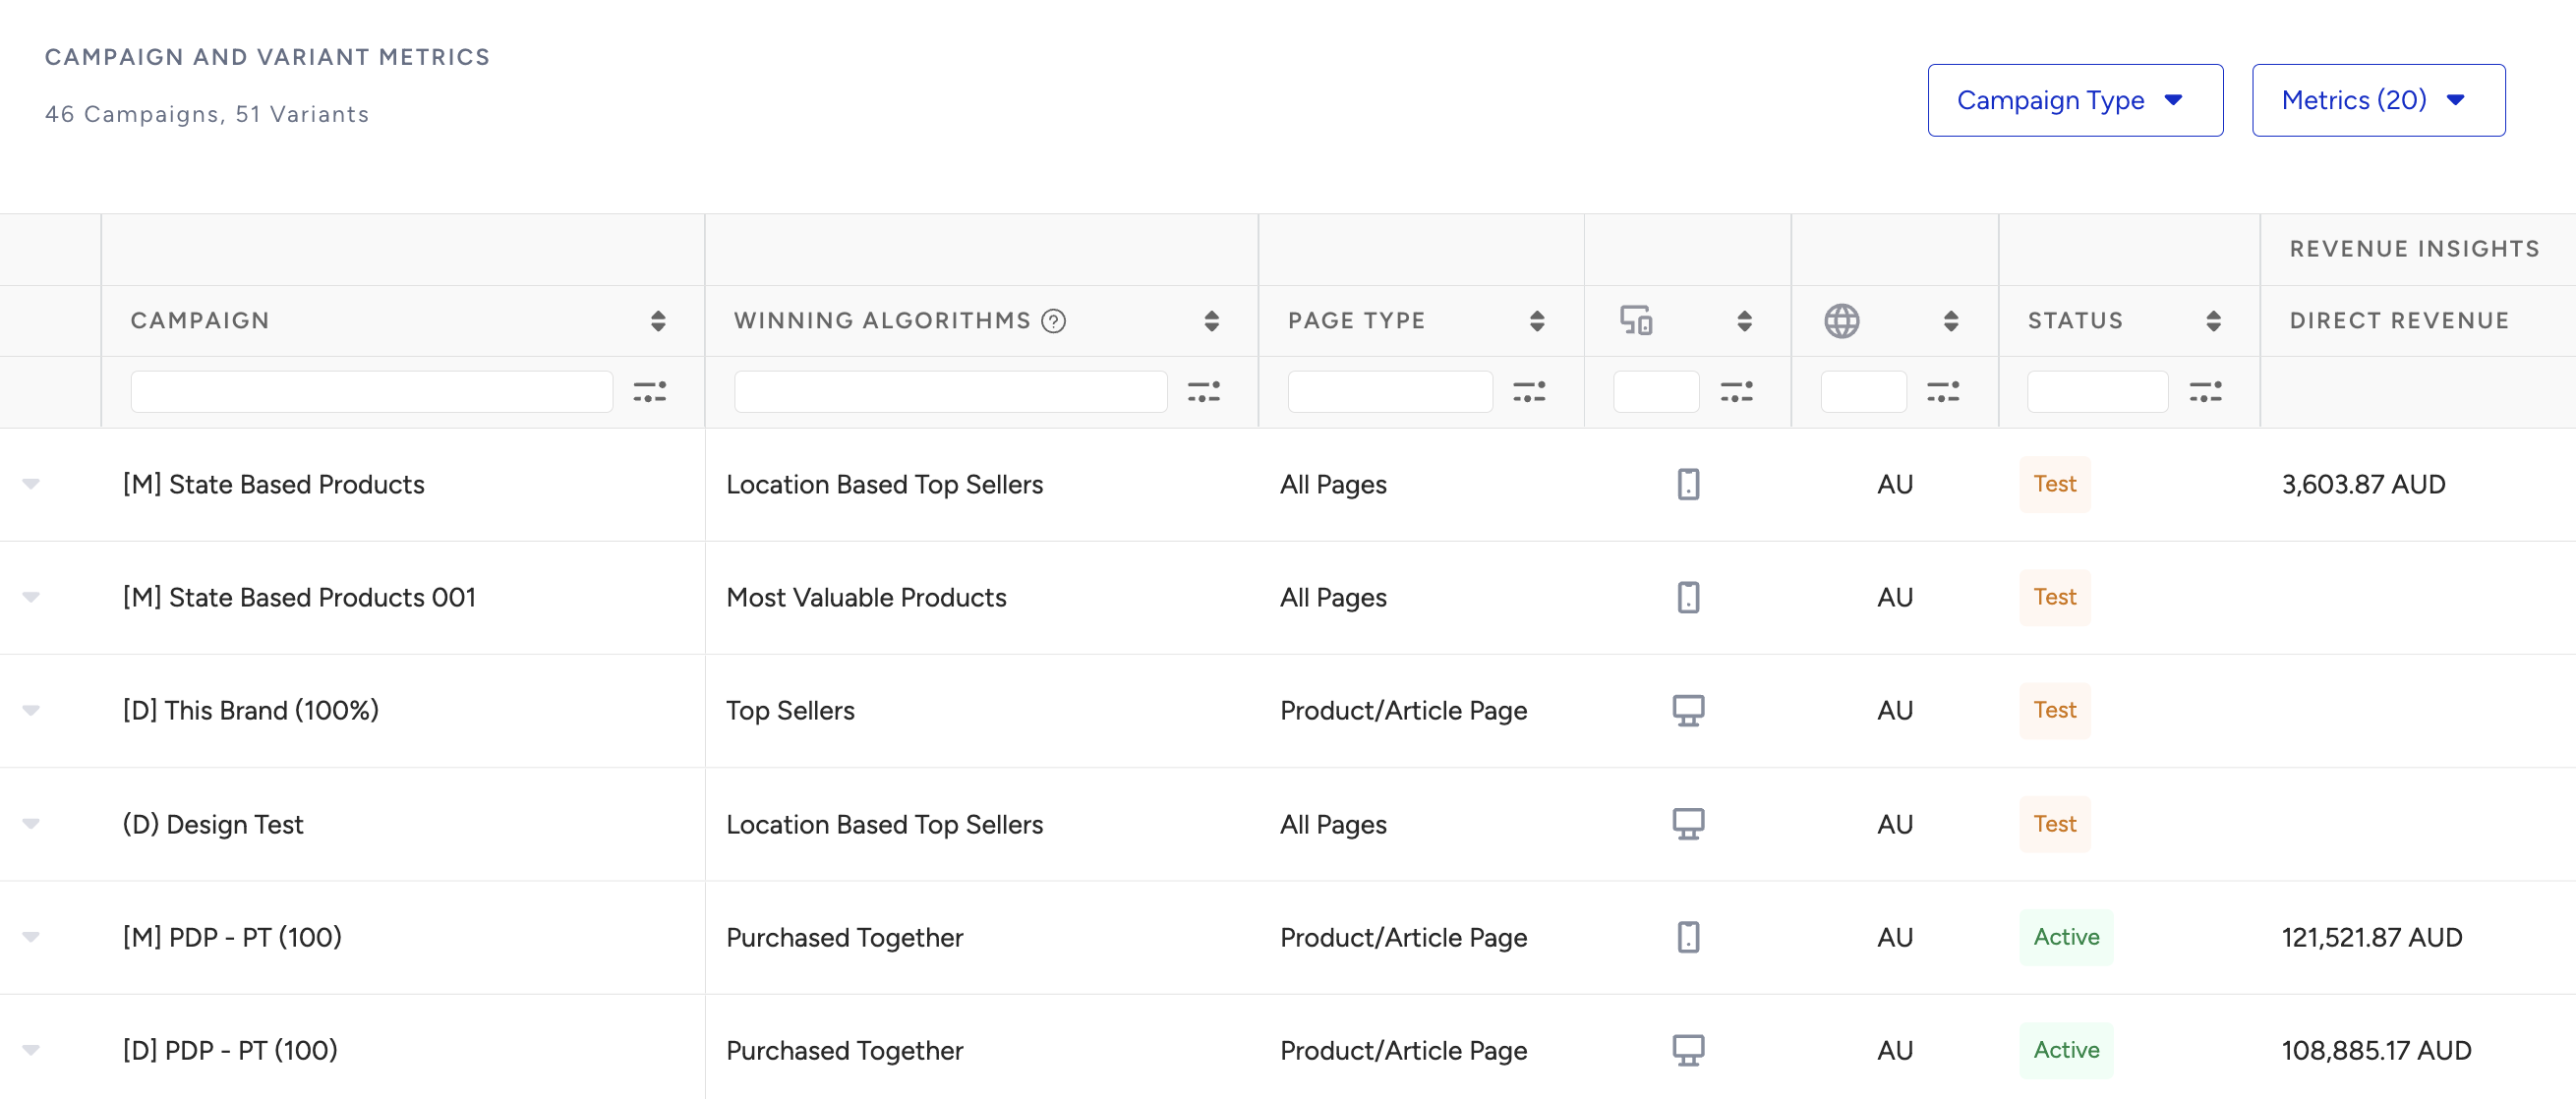
You can compare the results to see which strategy performs the best on your category or cart page. You can also see the breakdown of variants within a campaign, along with its performance metrics, which allows you to select the best-performing variant and improve your campaign strategies.
The main rows in the table are the Web Smart Recommender campaigns, and the nested rows are the variants within each campaign. To look at the variant performances of a campaign, click on the main row, and variants will be listed in the nested part.
This table is where your experimentation resides, and the metrics you obtain here, such as Direct Revenue, Assisted Revenue, Product Impressions, Product Click-Through Rate, and Product Conversion Rate, demonstrate the effectiveness of those choices.
Imagine this like your testing lab: each campaign can include multiple variants, and each variant is a combination of:
A strategy (Algorithm, exclusions, filters, etc.)
A placement (Product page, Home page, etc.)
A widget design (1-row carousel, grid layout, hero slider, etc.)
For more use cases to get more value from campaign analytics, you can visit Interpret the Smart Recommender Analytics Results.
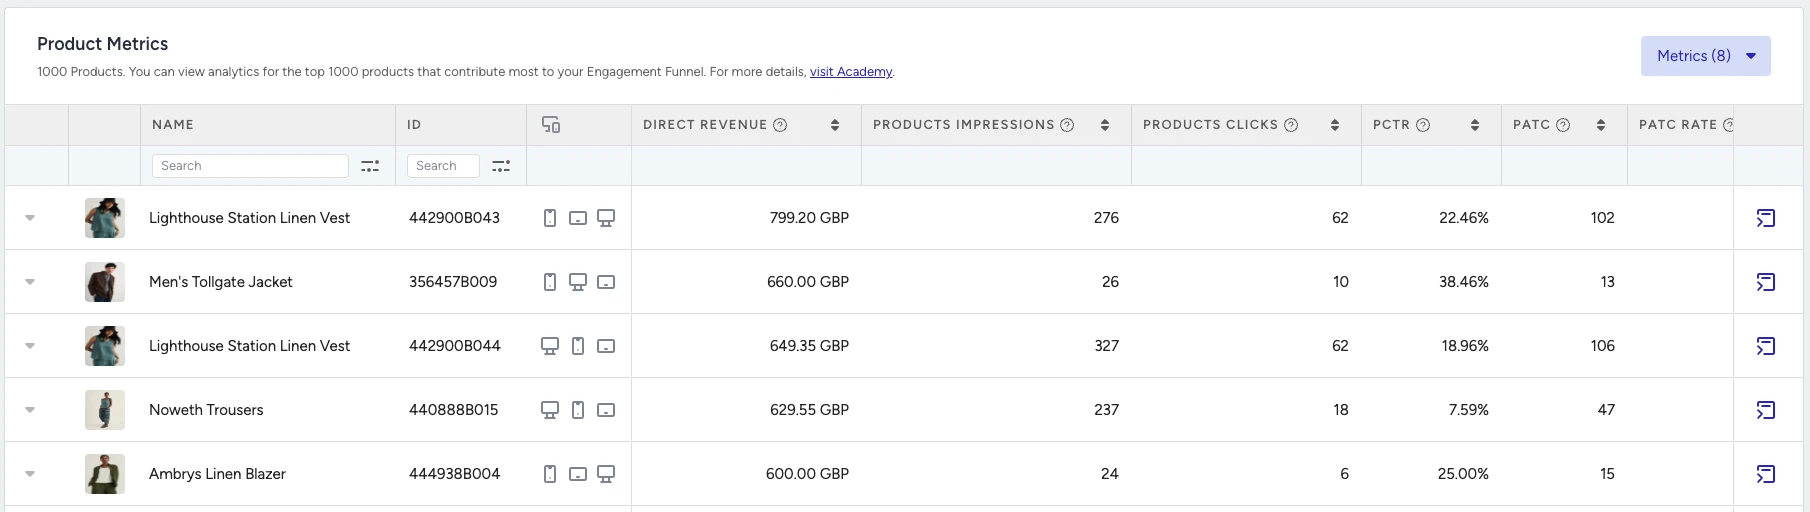
Product Metrics
This section is where individual product performance speaks for itself. Here you can:
See which recommended products actually generated revenue
Evaluate product-level click-through, add-to-cart, and conversion rates
Identify which items look attractive (high CTR) but don’t convert (low PCR)
In addition to campaign analytics, recommendations provide insights into product performance. The Product Analytics table shows the top 1000 products by revenue, in descending order.
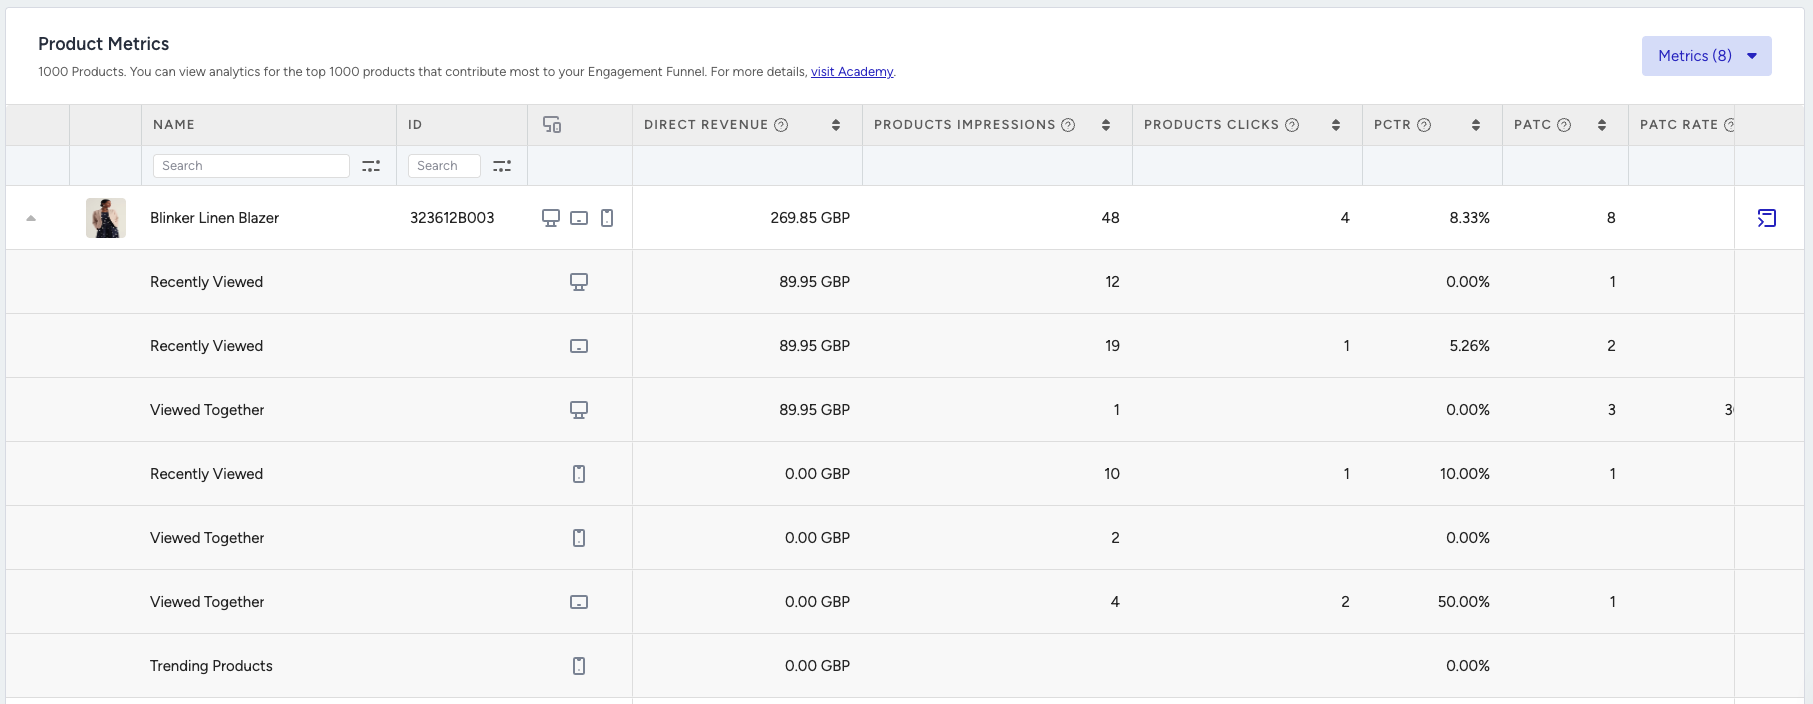
You can see revenue generated by product sales and your user’s engagement (impression, click, add to cart, and purchase) with that product using different recommendation algorithms. In addition to the performance metrics, the product analytics table enables transparency into algorithm-product relationship-based performance. This feature provides more insights into how an algorithm performs for a given product or which products drive more engagement than others.
When you click on a product on the product analytics table, you can see the algorithms that have recommended it and generated revenue. In other words, the algorithm's outputs will be clear, helping you gain insights into which products are more valuable to your users.
For more use cases to get more value from product analytics, you can visit Interpret the Smart Recommender Analytics Results.
Product Group Metrics
Smart Recommender Analytics reports product variants in a way that reflects real customer behavior. Performance is measured at the Group Code level to capture how different variants contribute.
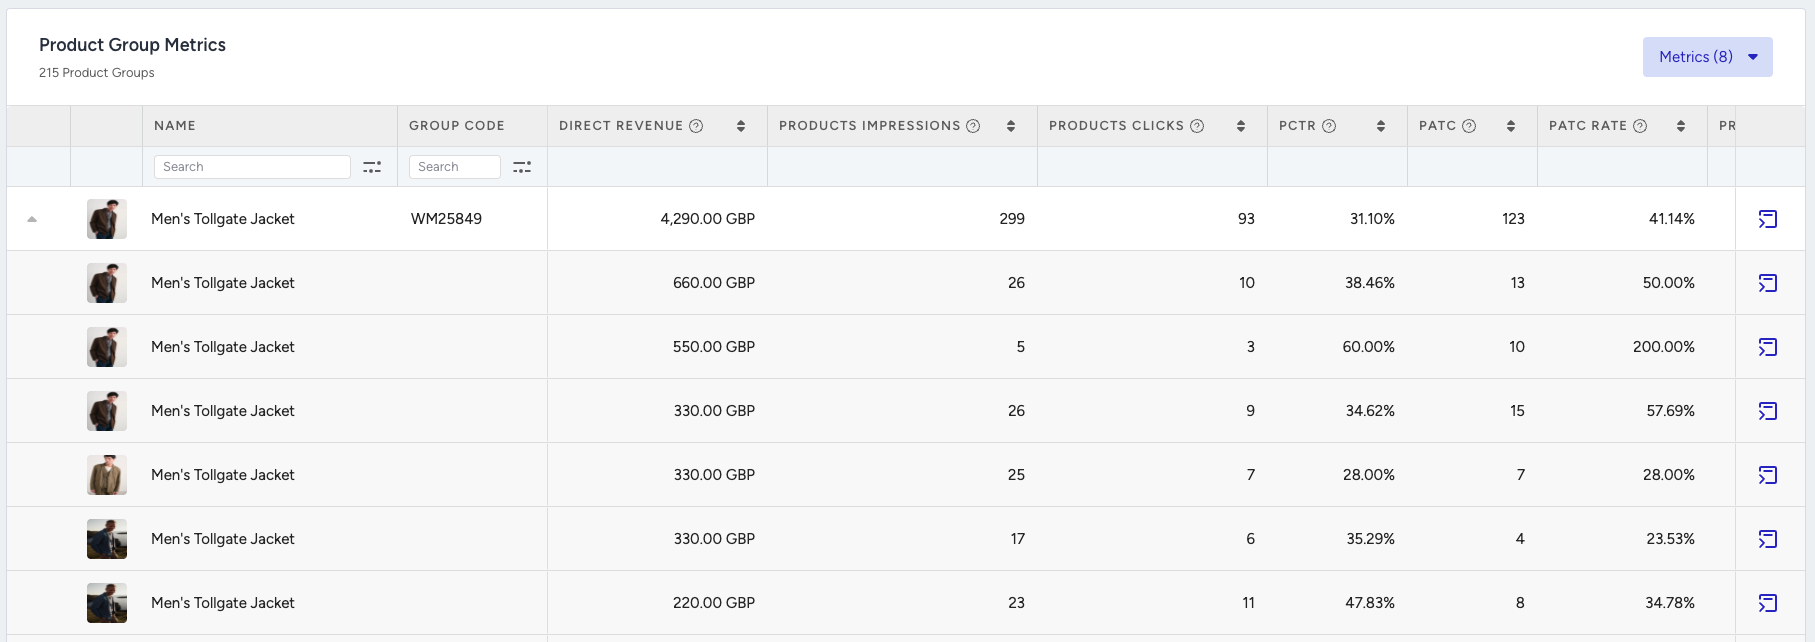
For example, if a shopper sees a Red Shirt (L) but buys a Blue Shirt (M) from the same group, the sale is correctly attributed to the product group while still recognizing variant behavior.
Category Metrics
The Category Metrics section rolls up the performance of recommended products by category, such as “Shoes,” “Electronics,” and “Women’s Clothing.” You get:
Recommended Product Counts (how many products were pushed)
Impressions, CTR, ATC, CR
Direct Revenue per category
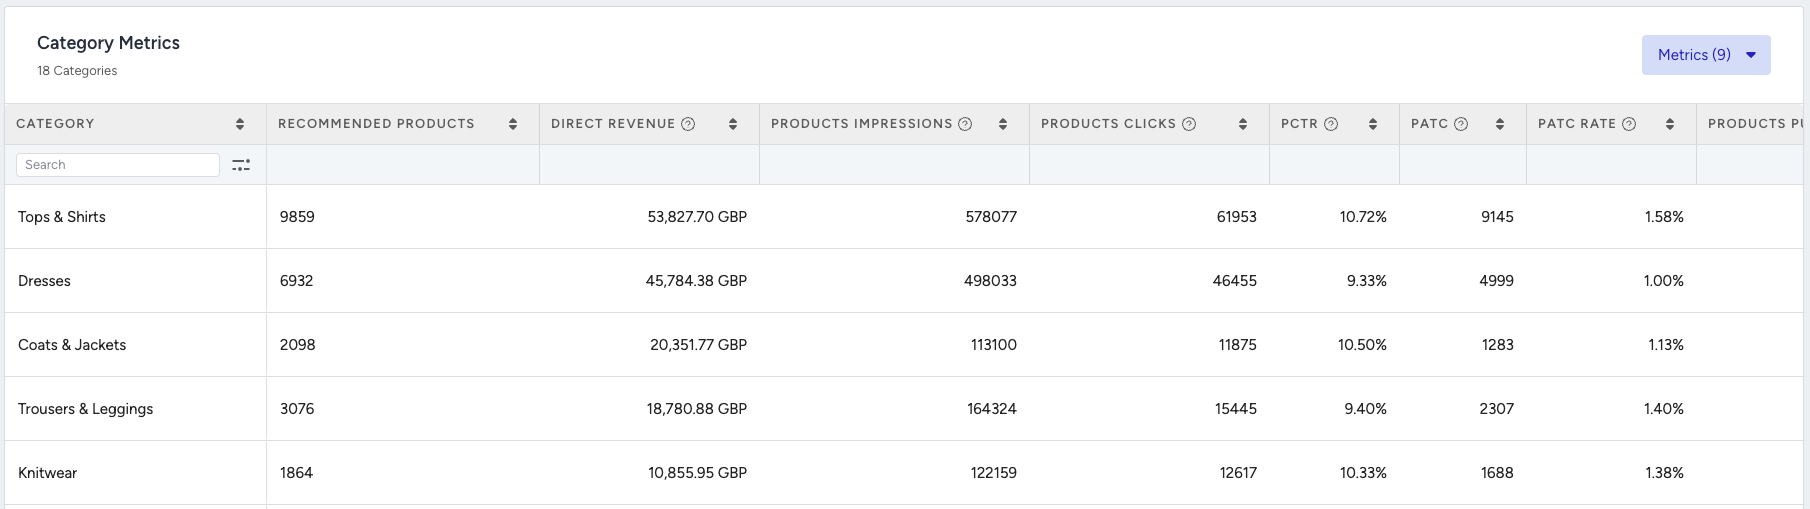
Seeing the number of products recommended from that category and the total revenue generated from the sale of recommended products, category analytics can help you understand which element of your taxonomy performs best in recommenders, especially in terms of revenue and Click-through Rate (CTR).
Do not sum all the revenue or other metrics in this table. This table is generated by attributing a metric collected for a product to all categories within the product's category tree. For example, a shirt has three categories: Top Wear, Short Sleeves, and Shirts. If a user clicks on or purchases a product, all categories associated with that product receive the same metric. Therefore, when a user interacts with a shirt, the "Top Wear", "Short Sleeves", and "Shirts" categories receive one click.
For more use cases to get more value from category analytics, you can visit Interpret the Smart Recommender Analytics Results.
Export your results
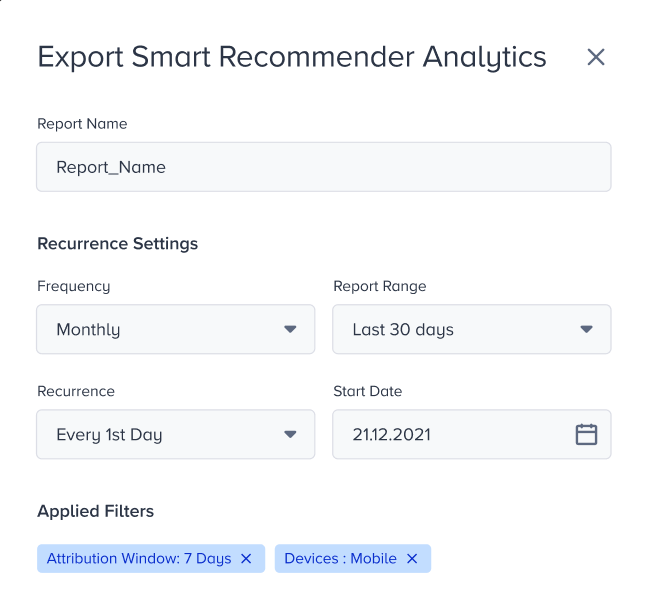
You can create single and recurring reports for your Smart Recommender Analytics. When exporting, the overall page filters you applied are displayed in the export modal. You can change them if you like.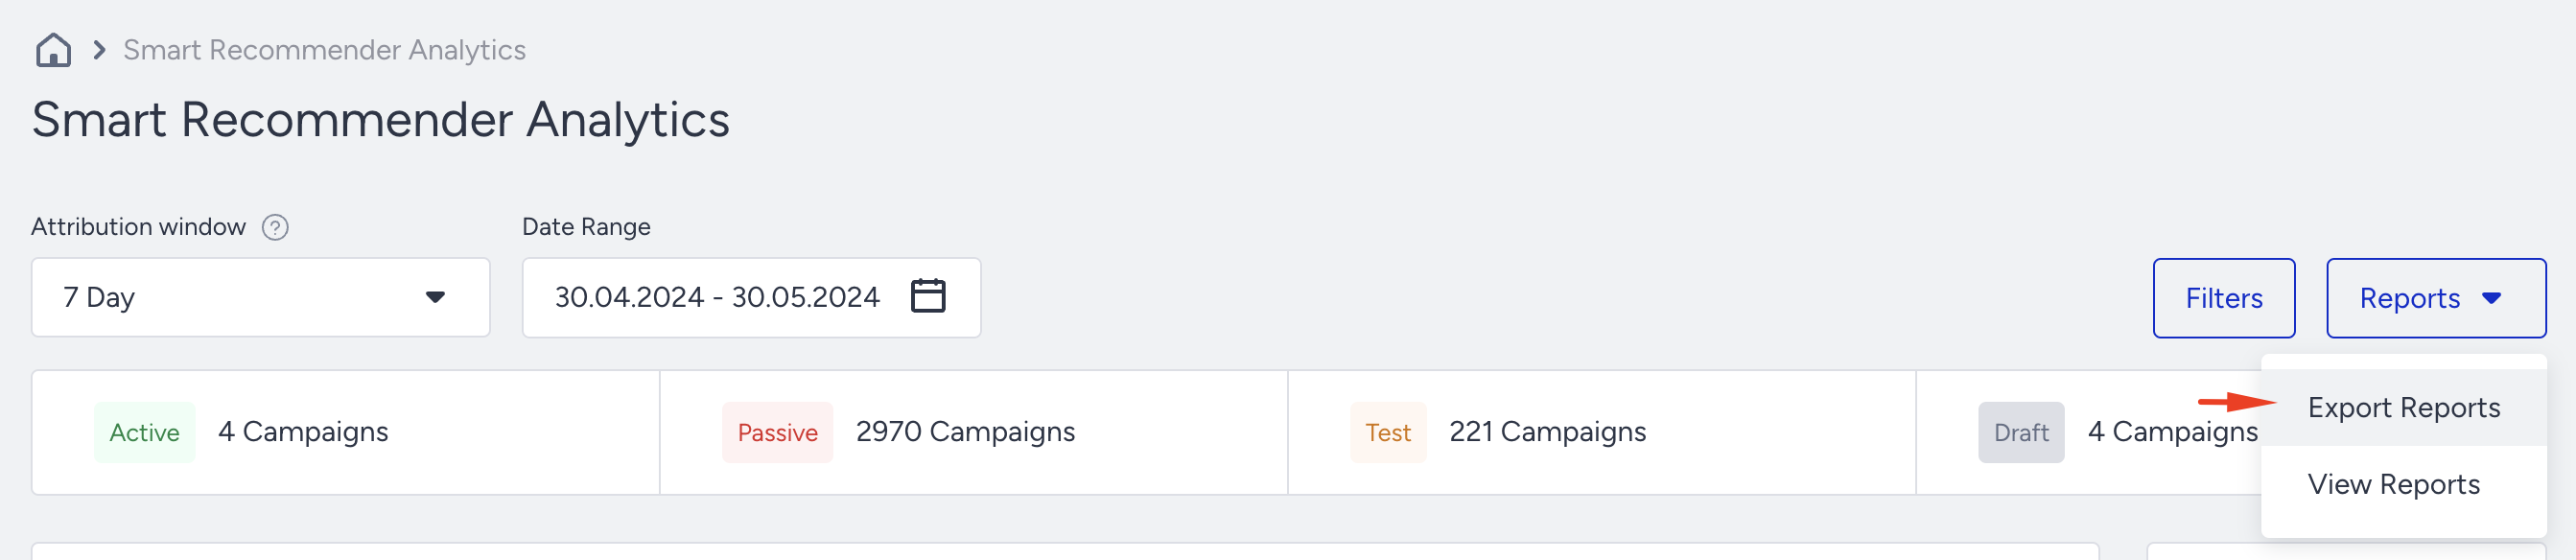
Single Report: The report is generated immediately with the filters applied on the page and shown in the “Reports” drawer, which you can access later. Single reports are stored for one week and then deleted from the created reports section.
Scheduled Report: The scheduled report type offers recurrence settings in the drawer modal. You can adjust the frequency, report range, recurrence period, and start date. Together with the applied filters, the configuration of the recurring report setting is complete.
To ensure the most accurate readout, do not sum the revenues of all categories directly. Since a product can belong to multiple categories, the same revenue may appear in multiple rows.