Smart Recommender's Campaign-Level A/B Testing feature helps you evaluate the performance of each campaign and its variants through side-by-side comparisons, including against a control group. This report provides a structured approach to measuring uplift, conversion impact, and revenue contributions based on your selected conversion goals and attribution window.
The logging logic used in A/B testing differs from that in the general Smart Recommender Analytics dashboard. This report is specifically designed for variant vs. control comparisons, where the control group does not log product-level impressions or clicks. For detailed product-level analytics, refer to the Smart Recommender Analytics.
This article covers the answers to the questions below:
What makes Smart Recommender A/B Testing different
Smart Recommender uses product-based event tracking (impression, click, and purchase) for each variant. Impressions are only logged when a product card is at least 50% visible in the user’s viewport, and clicks are only logged when a product is interacted with.
In contrast, control group users never see a recommendation widget. They:
Do not generate product impressions or clicks.
Only contribute to site-level conversion metrics (purchases, AOV, etc.).
This structure enables an accurate no-exposure baseline, offering a clean comparison point for measuring uplift from recommendations.
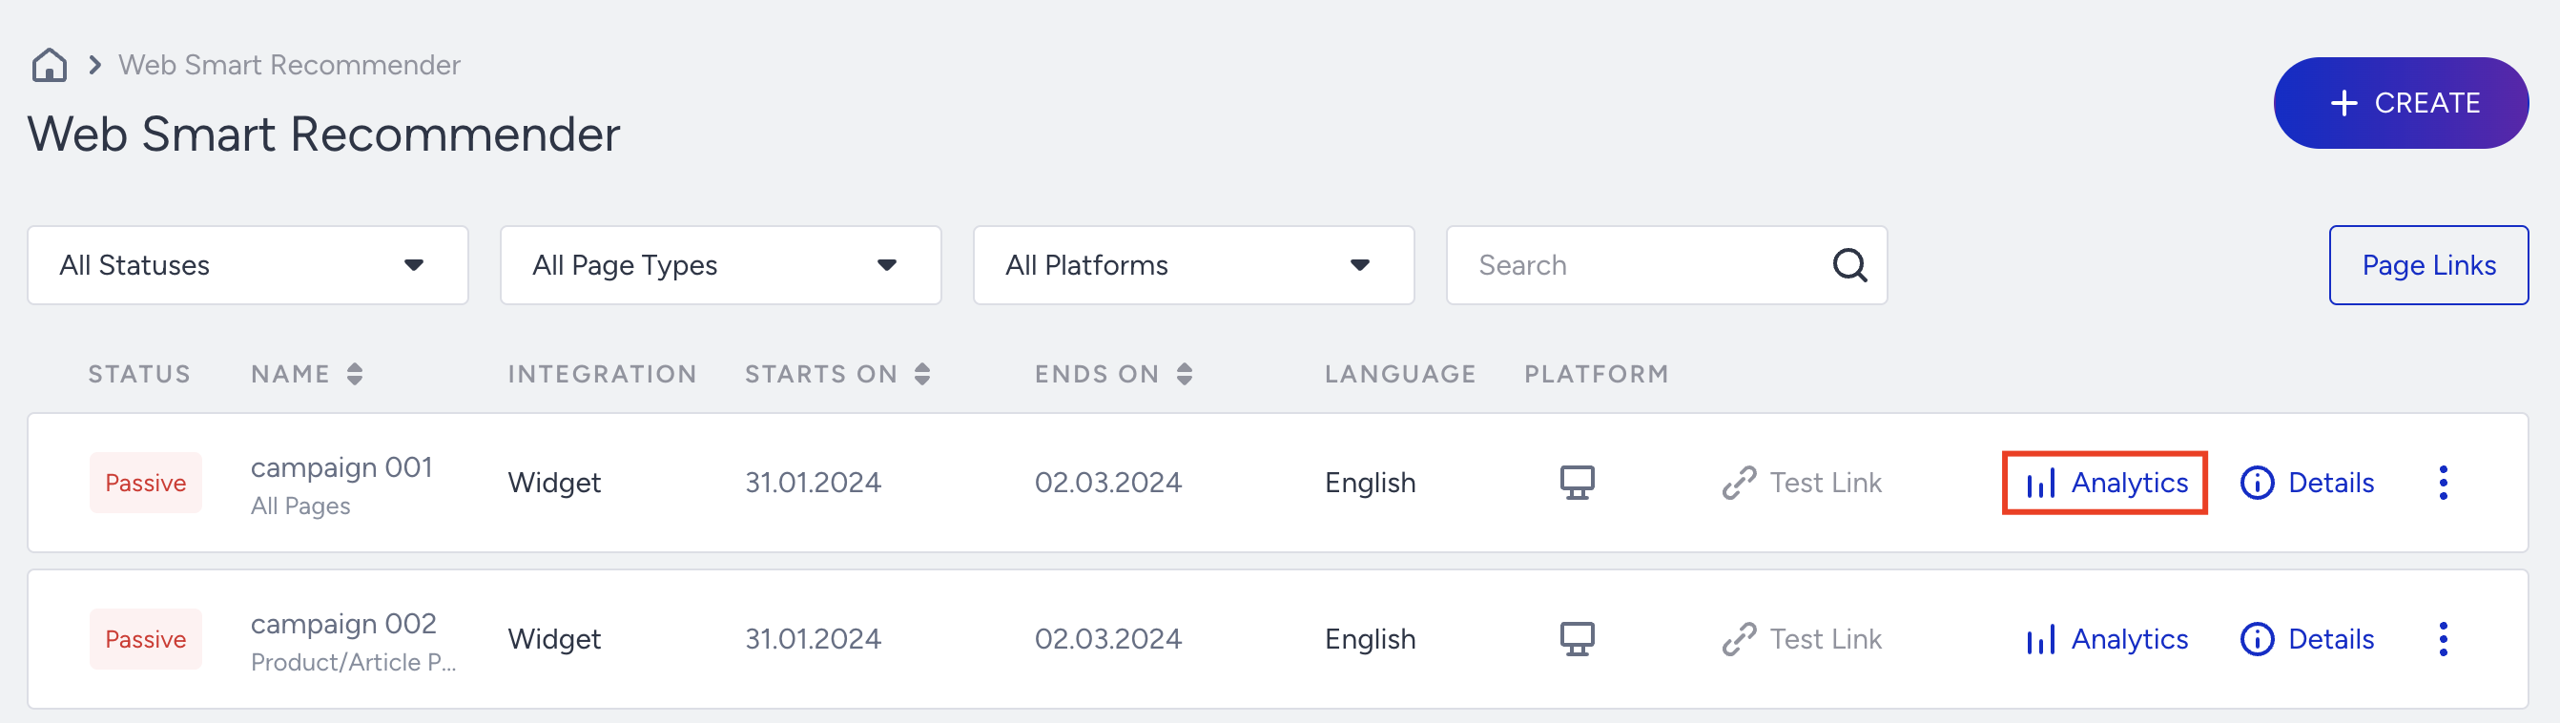
To access A/B testing analytics for a campaign, go to the Smart Recommender campaign listing page, then click the Analytics button for the relevant campaign.
Filter your results
Once you're in the analytics view, you can filter your results by:
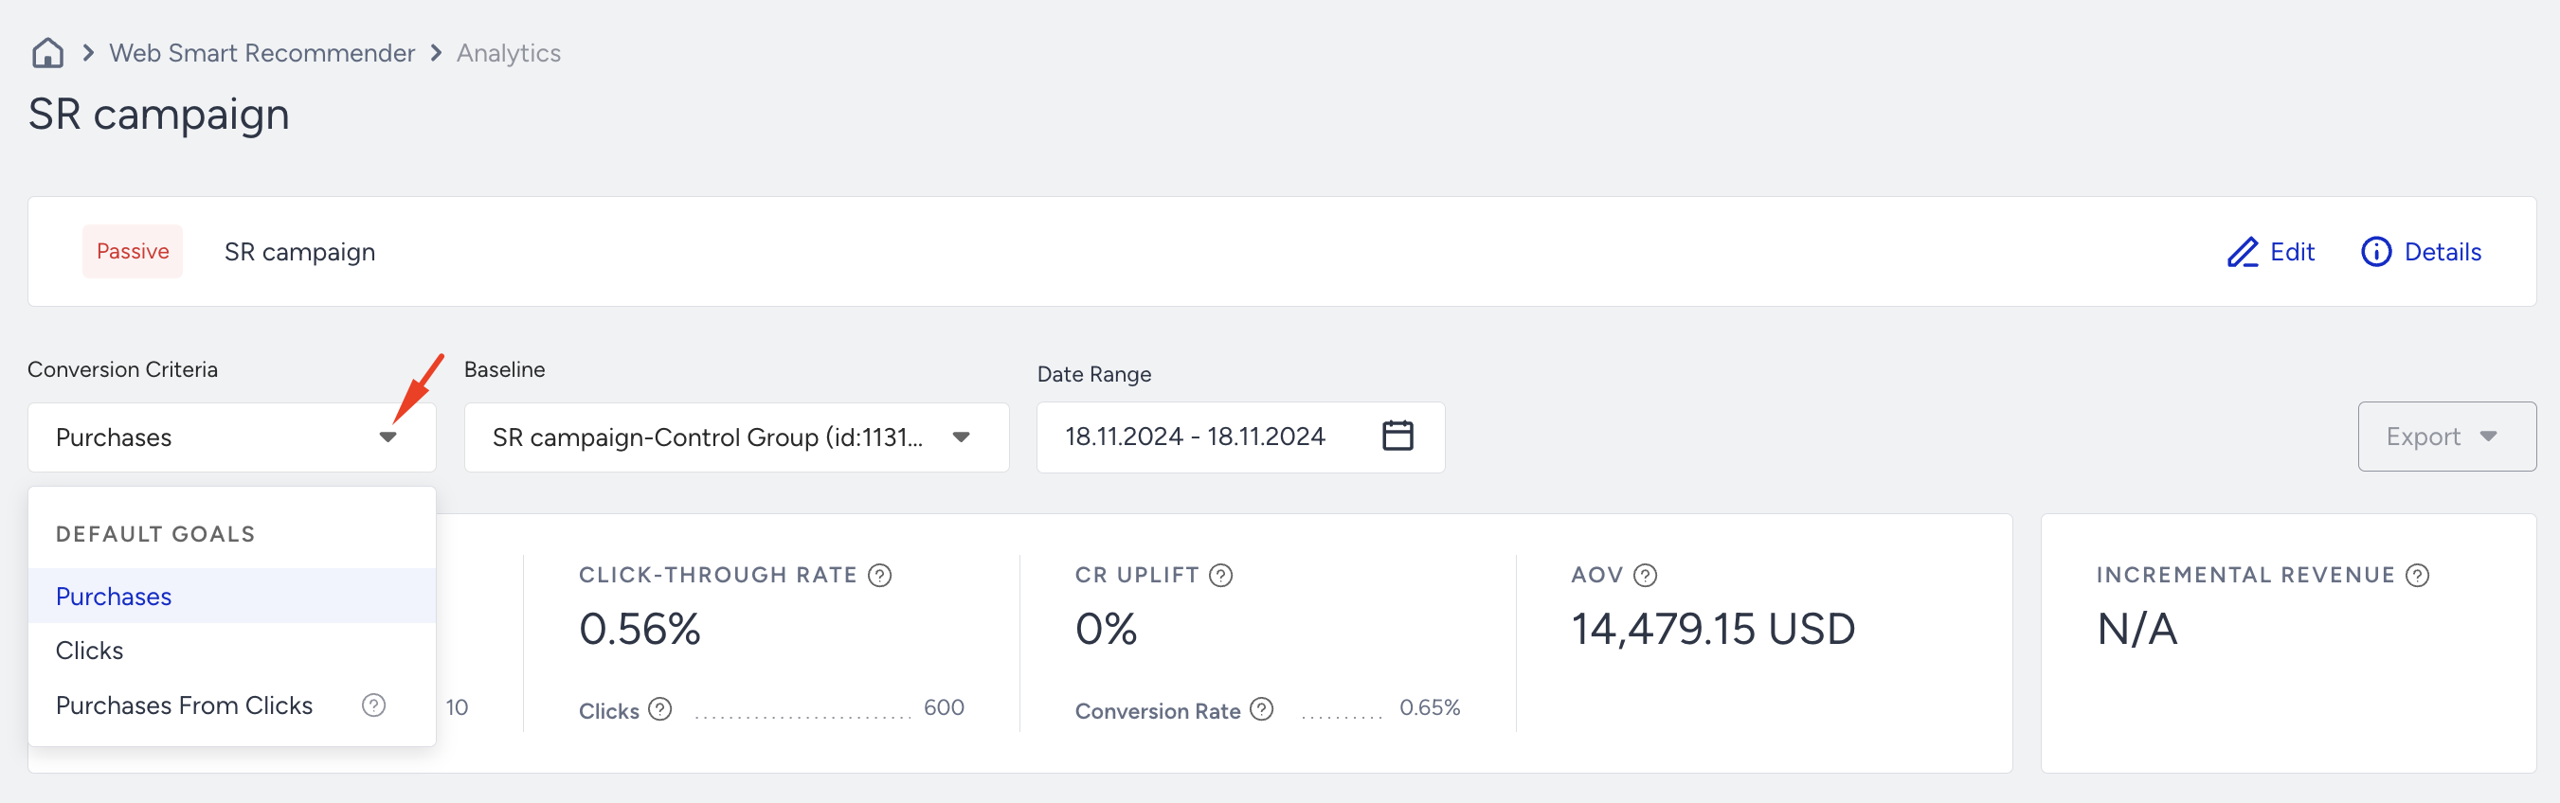
Conversion Criteria (goal metric): Choose from metrics such as Purchases, Clicks, or Purchases from Clicks.
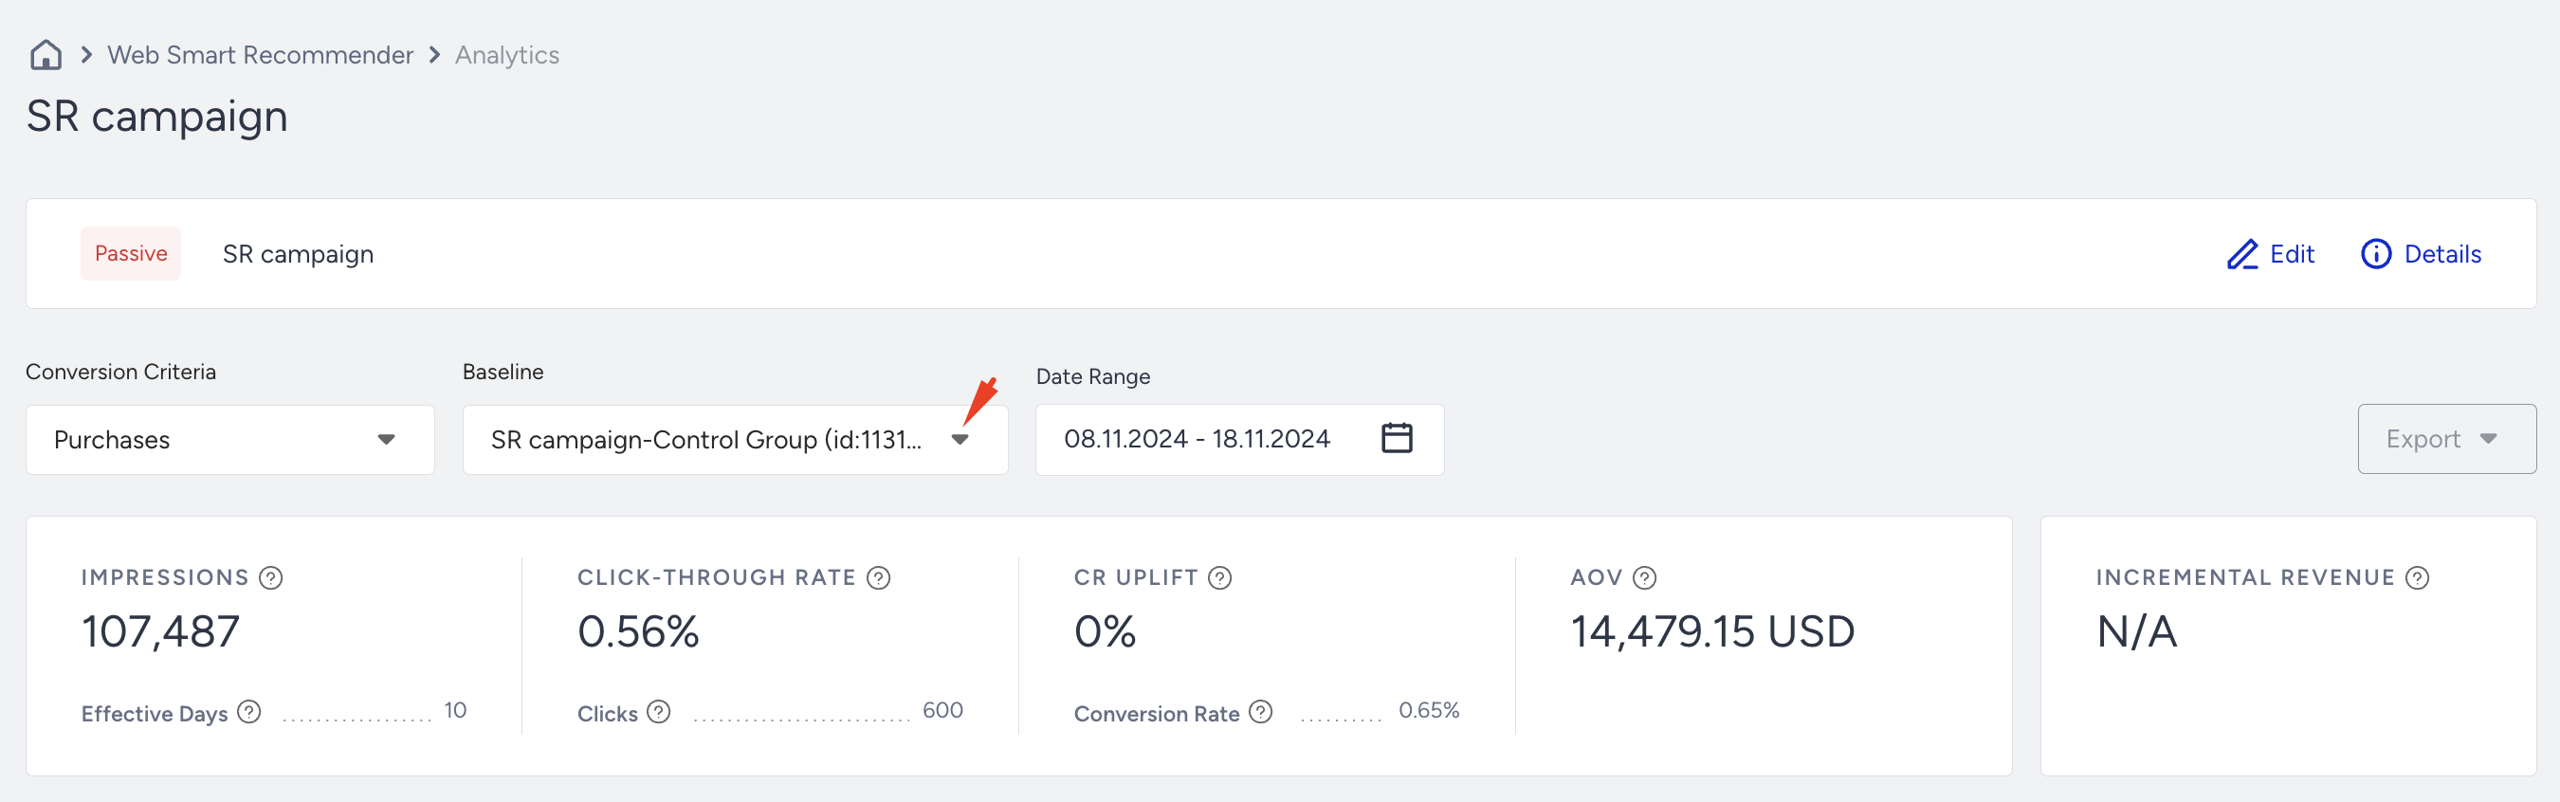
Base Group (Baseline Variant): Choose a variant or control group as the comparison point.
Date Range: Select the date window to analyze your experiment over time.
All metrics shown will adjust based on these selections.
You can also select the Variant to see its detailed analytics from Base Group.
When you select Goal, Base Group, and Date Range, you can analyze your campaign's results accordingly.
Summary Metrics
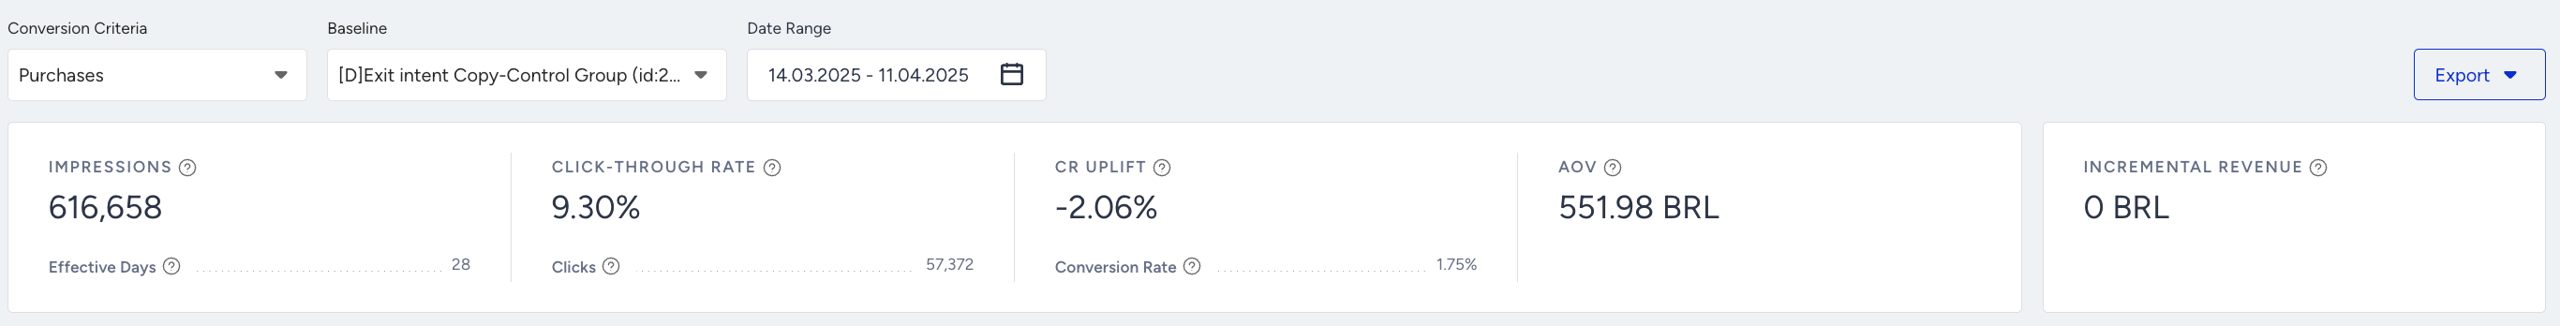
Conversion Criteria: Select the goal you want to evaluate: Purchases, Clicks, or Purchases from Clicks. This affects all conversion-based metrics on the page.
Example: If you select "Purchases", revenue will include all site purchases after an impression. If you choose "Purchases from Clicks", only purchases made after a user clicks the widget are counted.
Impressions: Number of sessions where a user was eligible to see the widget on the target page. One impression per session is logged—even if the widget isn’t actually seen (e.g., below the fold).
Example: A user visits a category page matching the campaign rules but leaves without scrolling and viewing the campaign. That still counts as one impression. If they come back 40 minutes later, another impression is counted.
Effective Days: Number of days a variant received at least 10 impressions.
Example: A variant active for 10 days, but only reached 10+ impressions on 6 of them = 6 Effective Days.
Click-Through Rate (CTR): CTR measures the percentage of impressions that result in clicks.
Example: If 100 users triggered impressions and five clicked, CTR = 5%.
Clicks: Logged when users click anywhere inside the widget (not just product cards). One click per re-eligibility period is logged.
Example: If a user clicks the carousel arrow, it might count as a click (depending on widget configuration). Clicking the same widget again in the next session will log another click.
CR Uplift: CR Uplift measures the percentage increase in Conversion Rate (CR) compared to a defined baseline (e.g., control group or previous performance).
Example: If Control CR = 2% and Variant CR = 3%, uplift = +50%.
Conversion Rate: Conversion Rate measures the percentage of impressions that result in conversions, based on the selected goal (e.g., purchase, signup, download).
Example: Using “Purchases from Clicks” as the goal, if 5 purchases happened from 200 impressions, CR = 2.5%.
Average Order Value (AOV): Average Order Value measures the average revenue generated per conversion (order).
Example: If 10 conversions generated 500 USD in revenue, AOV = 50 USD.
Incremental Value: Revenue gained vs. control, weighted by traffic allocation.
Example: If Control earned 500 USD and Variant earned 650 USD with equal traffic, the incremental value = 150 USD.
Metrics Dashboard
The metrics dashboard allows you to visualize data trends for each active variant and the control group.
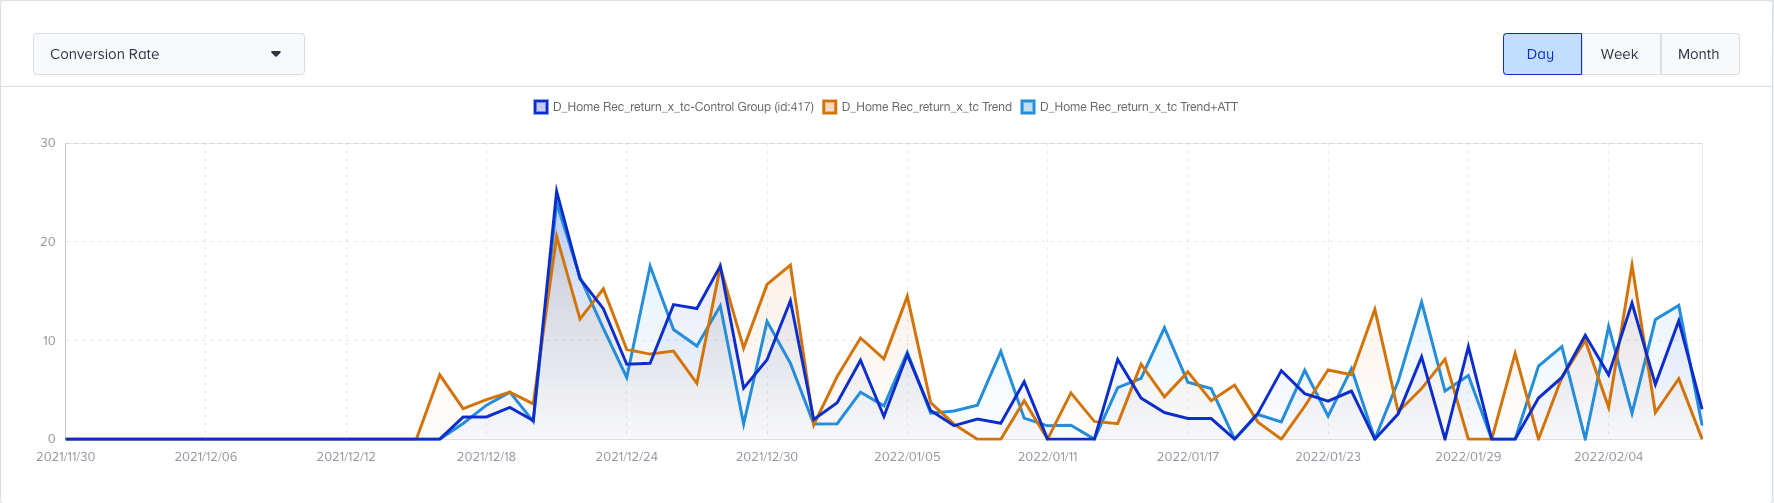
You can choose to view:
Conversion Rate
Conversions
Impressions
Use this dashboard to understand how performance changes over time, especially after strategy changes or variant design updates.
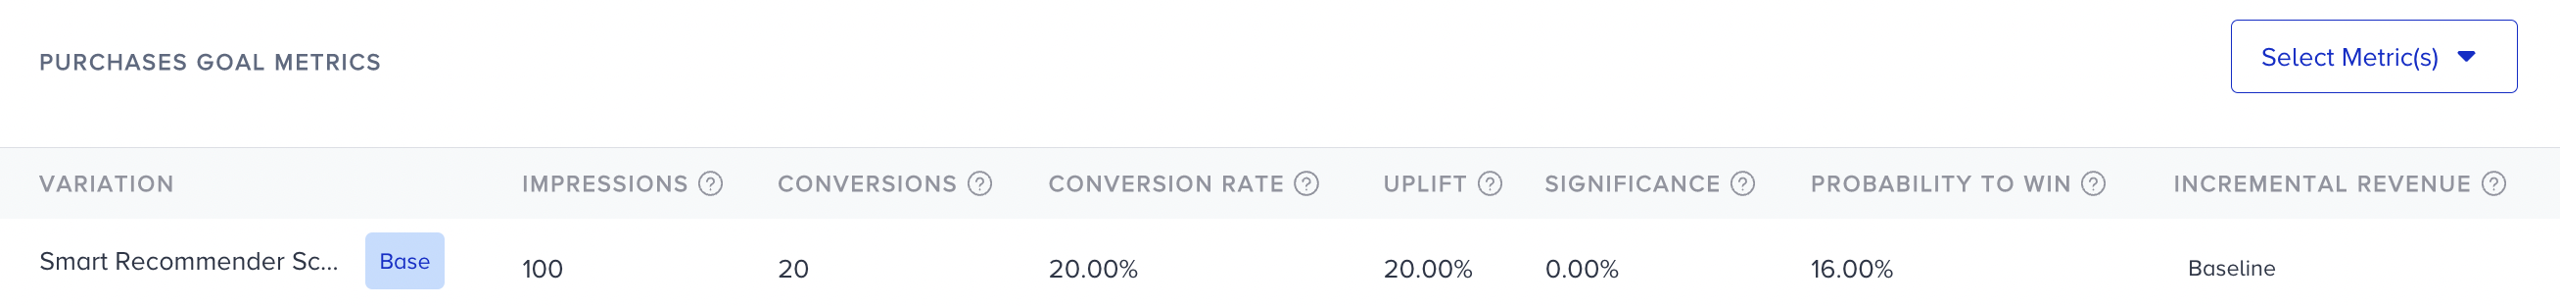
Performance by Conversion Criteria
This section compares multiple variants against the selected baseline (usually the control group), using your chosen conversion goal (purchases, clicks, etc.).
The logging logic used in A/B testing differs from that in the general Smart Recommender Analytics dashboard. This report is specifically designed for variant vs. control comparisons, where the control group does not log product-level impressions or clicks. For detailed product-level analytics, refer to the Smart Recommender Analytics.
Impressions: Session-based count of eligible users (one per session). This is not product-level and doesn’t require 50% visibility.
Example: Even if the user never scrolls to the widget, an impression is logged if they meet campaign rules.
Conversions: Number of selected goal completions (e.g., Purchases from Clicks) after an impression.
Example: If a user clicked the widget and then bought a product after 2 days (within the attribution window), it counts. If they return after 31 days, it doesn't.
Conversion Rate: This metric indicates the percentage of visitors who complete the defined goal (e.g., purchase, signup, form submission) for a given variant.
Example: If 10 conversions happened across 500 eligible sessions, CR = 2%.
Uplift: Conversion Rate Uplift measures the relative improvement (or decline) in conversion rate of a variant compared to the control group.
Example: Control CR = 1.5%, Variant CR = 2.25% → Uplift = +50%
Significance: Statistical confidence that uplift is real. Based on the sample size + difference in CR.
Example: If a variant has 20% uplift but only 30 impressions, the significance will be low.
Probability to Win: Bayesian probability that a variant will outperform all others long-term.
Example: Variant A = 85%, Variant B = 15%. This implies Variant A is highly likely to outperform.
Incremental Revenue: Incremental Revenue measures the additional revenue generated by a variant compared to the control group.
Example: Control earned 5,000 USD, Variant earned 6,200 USD → Incremental Revenue = 1,200 USD
Incremental Conversion: Incremental Conversion measures the additional conversions generated by a variant or personalization group compared to the control group.
Example: Control = 100 conversions, Variant = 130 → Incremental = 30
Revenue: Total revenue from site-wide purchases after an impression, optionally filtered by click behavior (based on selected criteria).
Example: If "Purchase from Click" is selected, only revenue from clicked sessions is counted. If "Purchase" is selected, all revenue post-impression is included.
AOV (Average Order Value): Average Order Value represents the average revenue generated per conversion (or order).
Example: 8,000 USD ÷ 200 conversions = 40 USD
AOV Uplift: Average Order Value (AOV) Uplift measures the relative improvement in AOV of a variant compared to the control group.
Example: Variant AOV = $45, Control = $40 → AOV Uplift = +12.5%
How Campaign-Level Analytics differs from Smart Recommender Product-Level Analytics
Campaign-level (A/B Testing View) Analytics: Strategic test of recommendation logic vs. no exposure.
Smart Recommender Product-level Analytics: Detailed look at how each product performs in recommendation widgets.
Feature | Campaign-level (A/B Testing View) Analytics | Smart Recommender Analytics |
|---|---|---|
Purpose | Test variant vs. control impact | Understand detailed product-level engagement |
Impressions | Session-based, one per user-session | Logged per product when 50% visible in the viewport |
Clicks | Logged per widget | Logged per product card click |
Conversions | Site-wide purchases per impression or click | Direct or assisted purchases per product |
Revenue | Total revenue from all site purchases | Revenue linked to the clicked product only |
Control Group logic | No product logs (no impressions/clicks) | Not used — only in an A/B testing context |
If you're testing overall uplift, use Campaign-level (A/B Testing View) Analytics.
If you're optimizing which products to show or remove, use Smart Recommender Product-level Analytics.
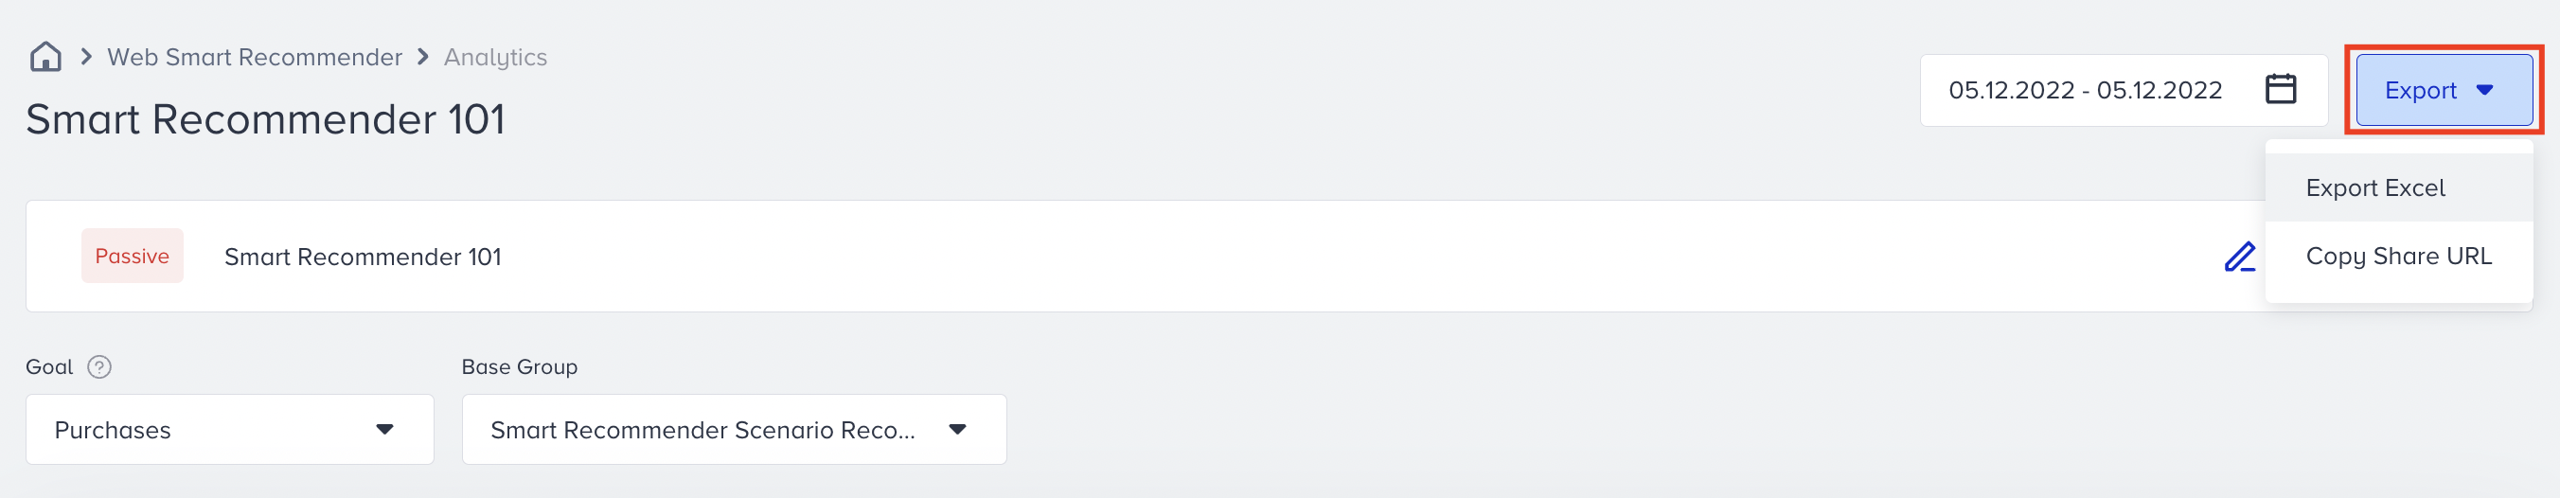
Export your results
You can export Smart Recommender analytics data for the desired time range in two ways: as an Excel file or by copying its URL.