The Queued Conversation Performance Report provides detailed insights into conversations queued when no agents can respond. This report helps you monitor and evaluate queue performance, identify peak hours, and optimize staffing to reduce customer wait times.
The report will generate data for all conversations as of 01.01.2024.
This guide aims to answer these questions:
How can I navigate to the Queued Conversation Performance Report?
What are the Queued Conversation Performance Report metrics?
What are the use cases of the Queued Conversation Performance Report?
What are the FAQs about the Queued Conversation Performance Report?
Navigate to the Queued Conversation Performance Report
1. Log in to your MindBehind Live account.
2. When you are on the Home page, click the Conversation & Agent Analytics tab.
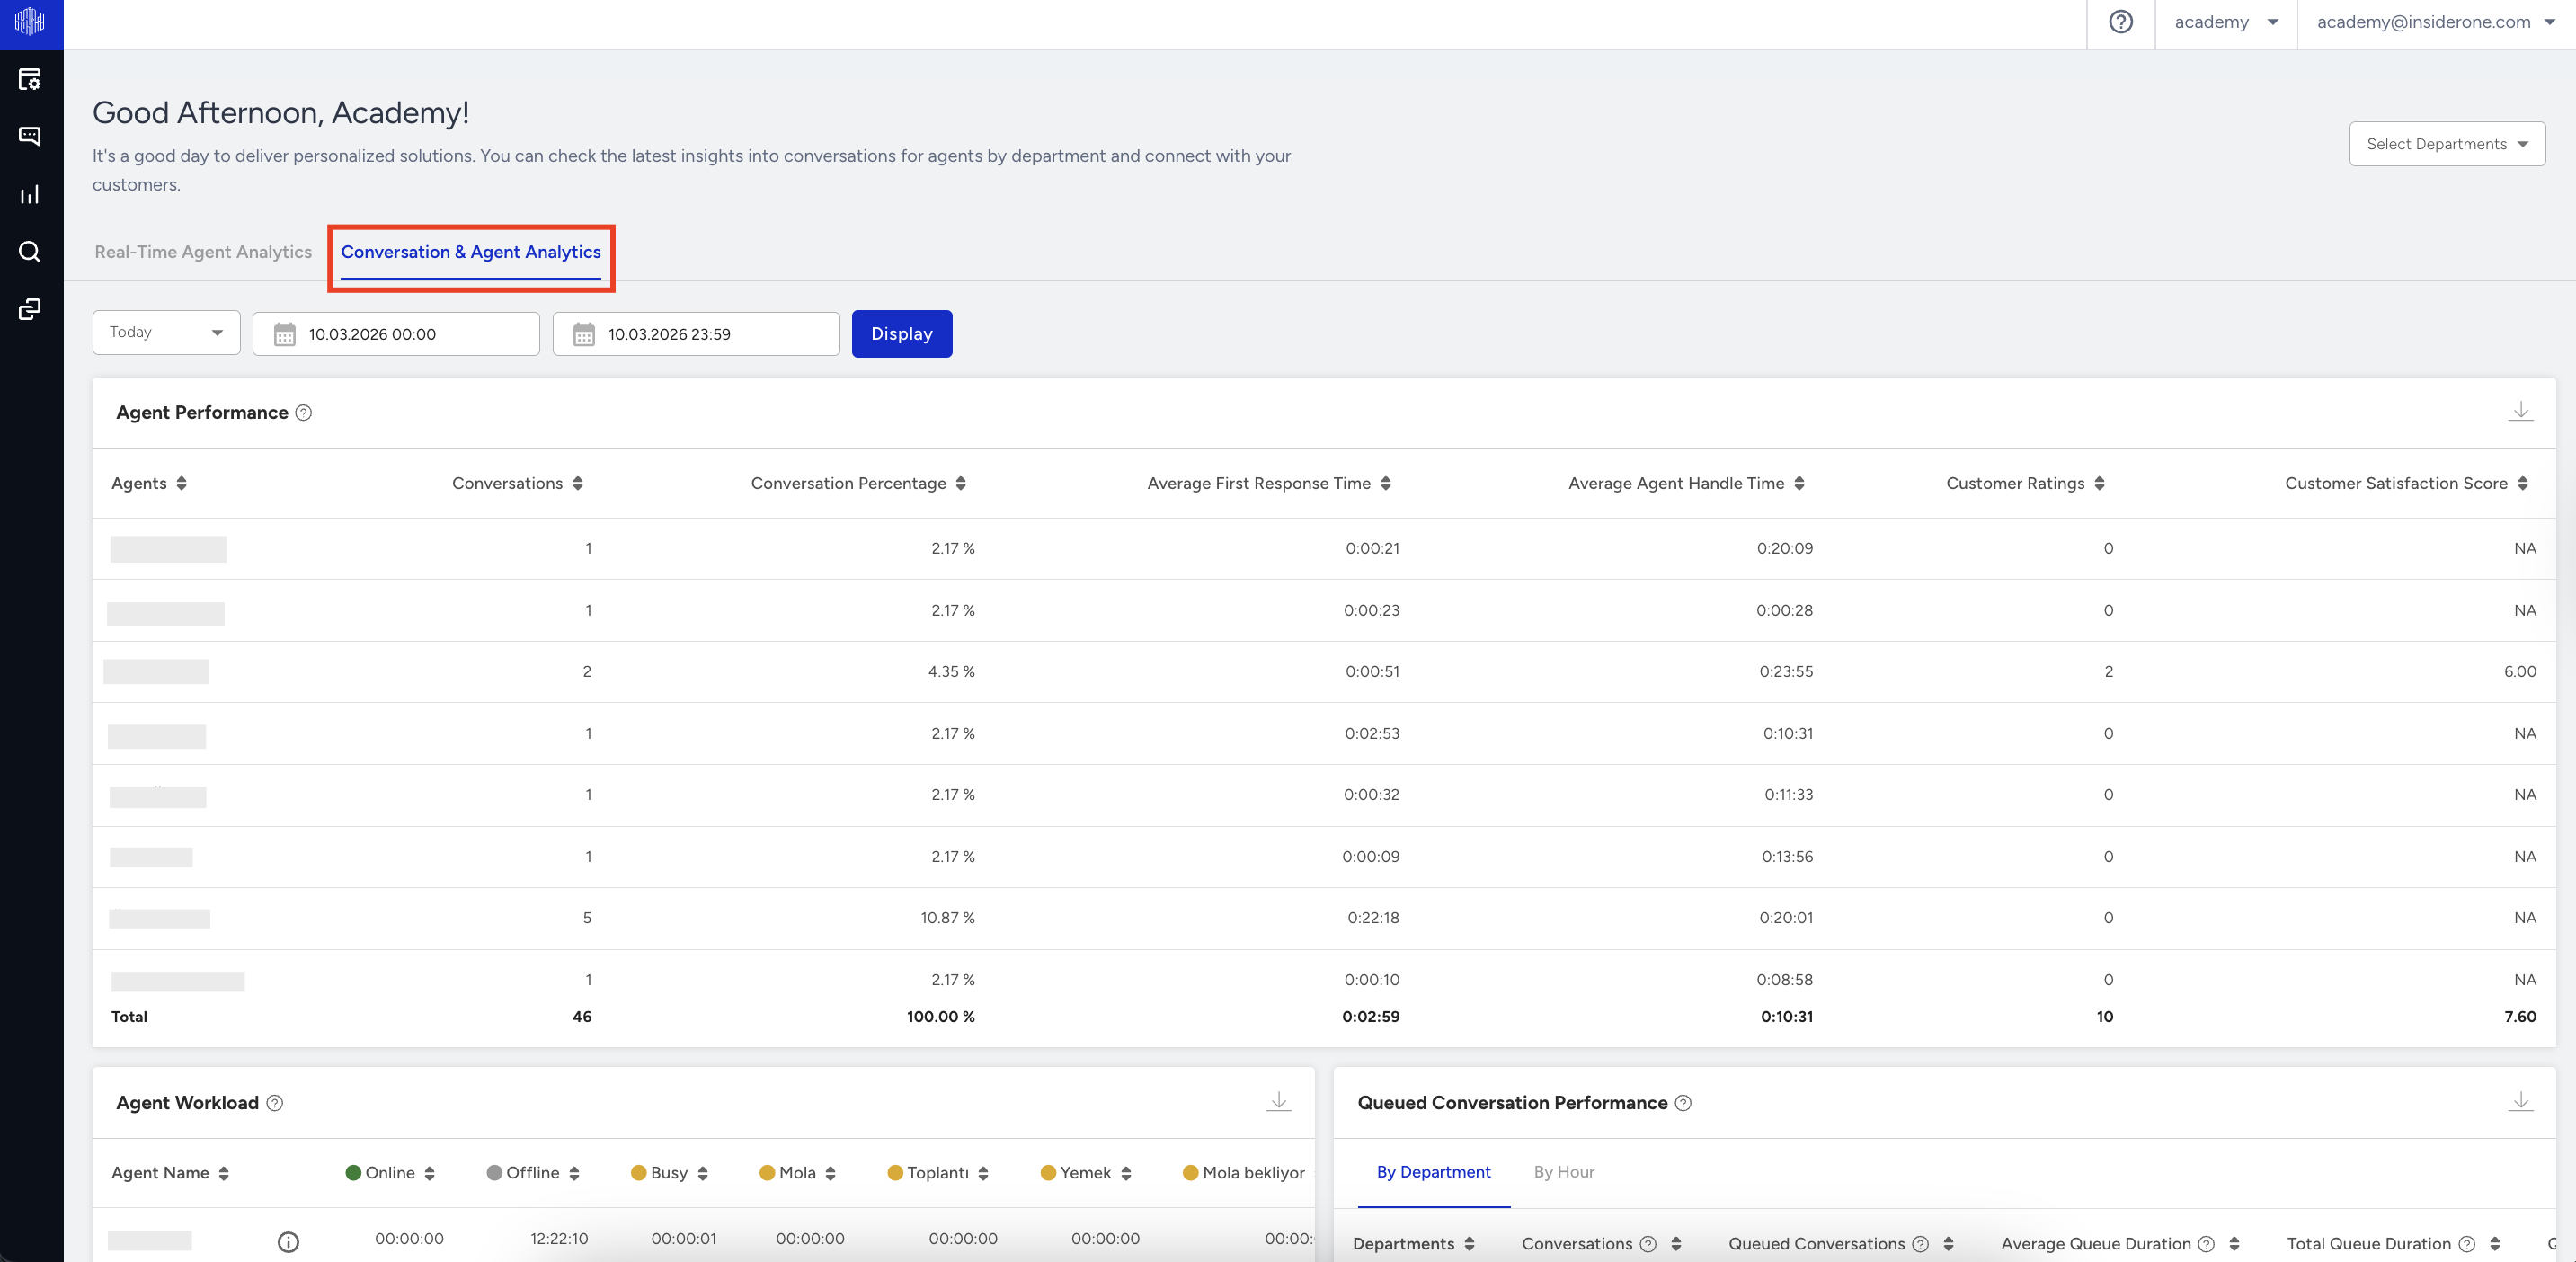
3. Scroll down to the Queued Conversation Performance table.
Queued Conversation Performance Report Metrics
The report is divided into two main sections:
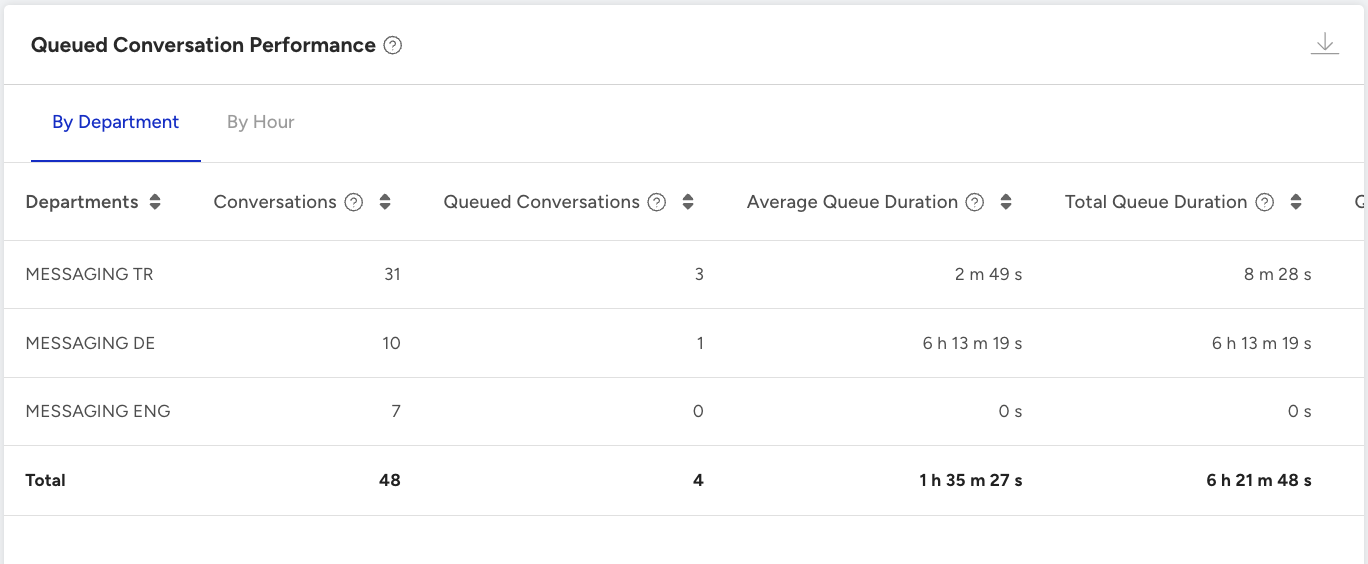
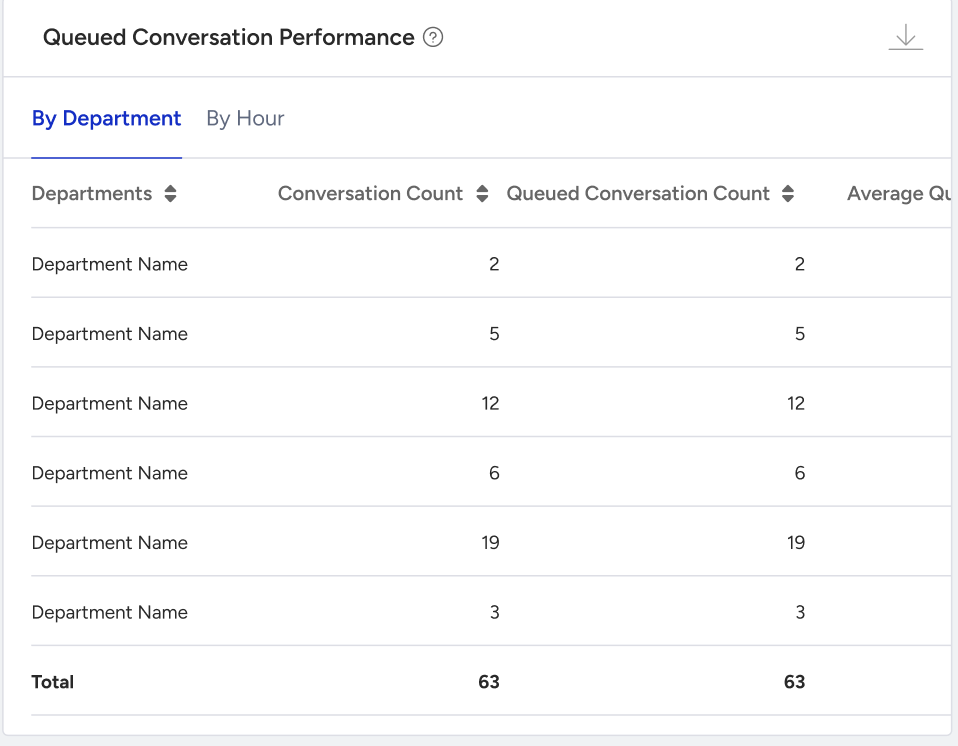
By Department
This section provides an overview of queue performance metrics for each department. The following metrics are displayed in table format.
Metrics | Description |
|---|---|
Department | Department name |
Conversation Count | The total number of conversations received by departments. |
Queued Conversation Count | The total number of conversations waiting in the queue for over three seconds. |
Average Queue Duration | The average duration of conversations waiting in the queue (in HH:MM: SS format). |
Total Queue Duration | The total duration of conversations waiting in the queue (in HH:MM: SS format). |
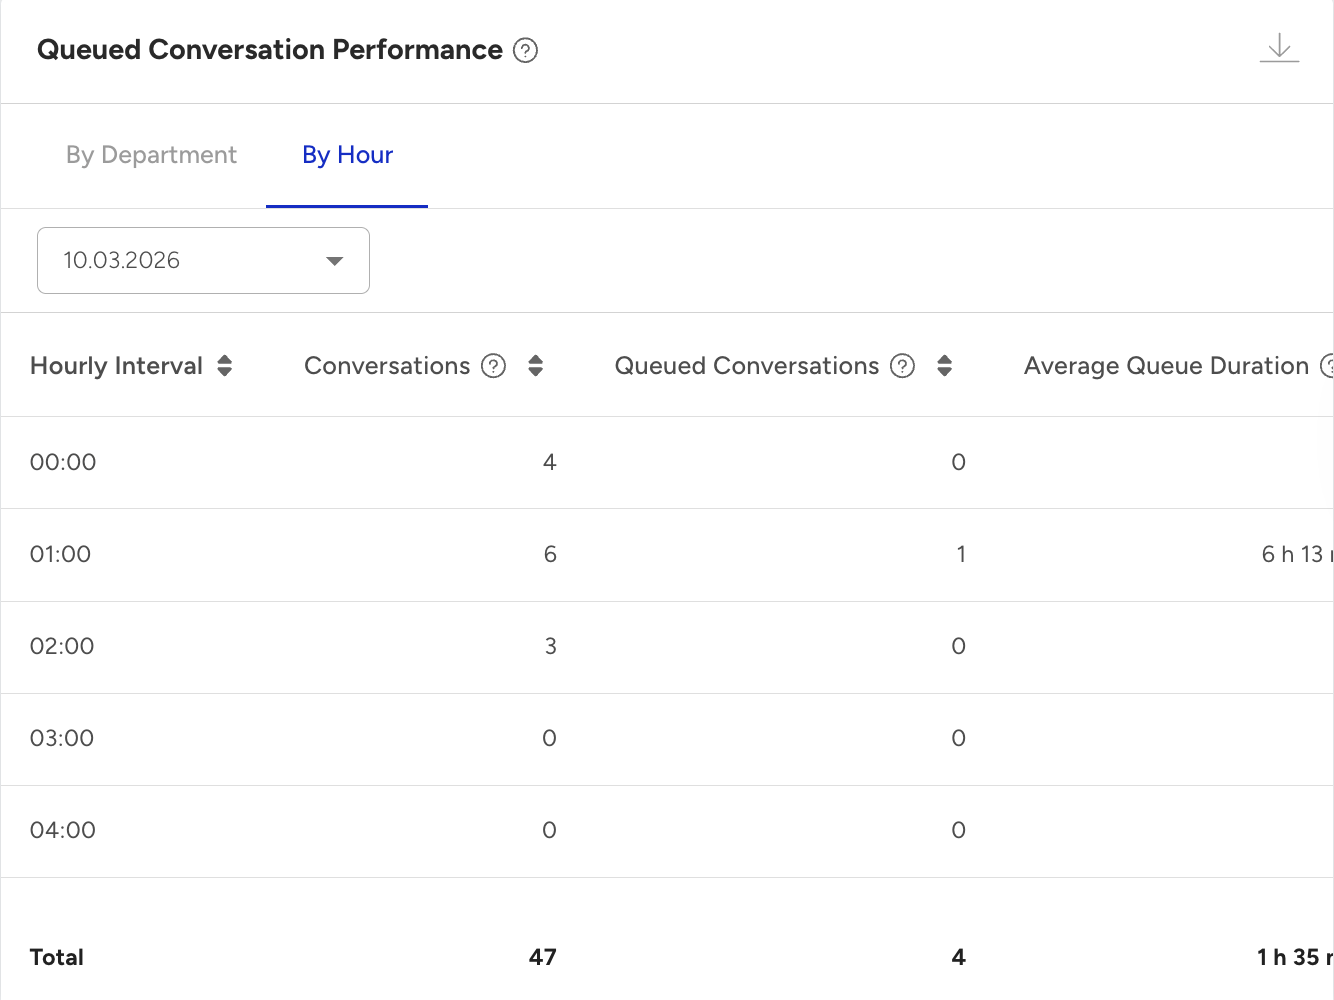
By Hour
This section offers a detailed view of queue performance, with metrics broken down into hourly intervals. The table includes the following metrics:
Metrics | Description |
|---|---|
Time Interval | Hourly interval (e.g., 00:00 - 01:00) |
Conversation Count | The total number of conversations received by departments. |
Queued Conversation Count | The total number of conversations waiting in the queue for over three seconds. |
Average Queue Duration | The average duration of conversations waiting in the queue (in HH:MM: SS format). |
Total Queue Duration | The total duration of conversations waiting in the queue (in HH:MM:SS format). |
- Data storage uses either the handover time or the client’s first response as the reference point. For example, if a conversation starts at 13:00, is assigned to an agent at 13:10, and ends at 14:25, it will be recorded as a queued conversation in the 13:00–14:00 hourly range, not the 14:00–15:00 range. Data is generated only for conversations that have ended.
- If you select a date range of more than one day on the page, the data you will see in this table will only include the start date of the range. When you export the report, it will show the detailed breakdown by day.
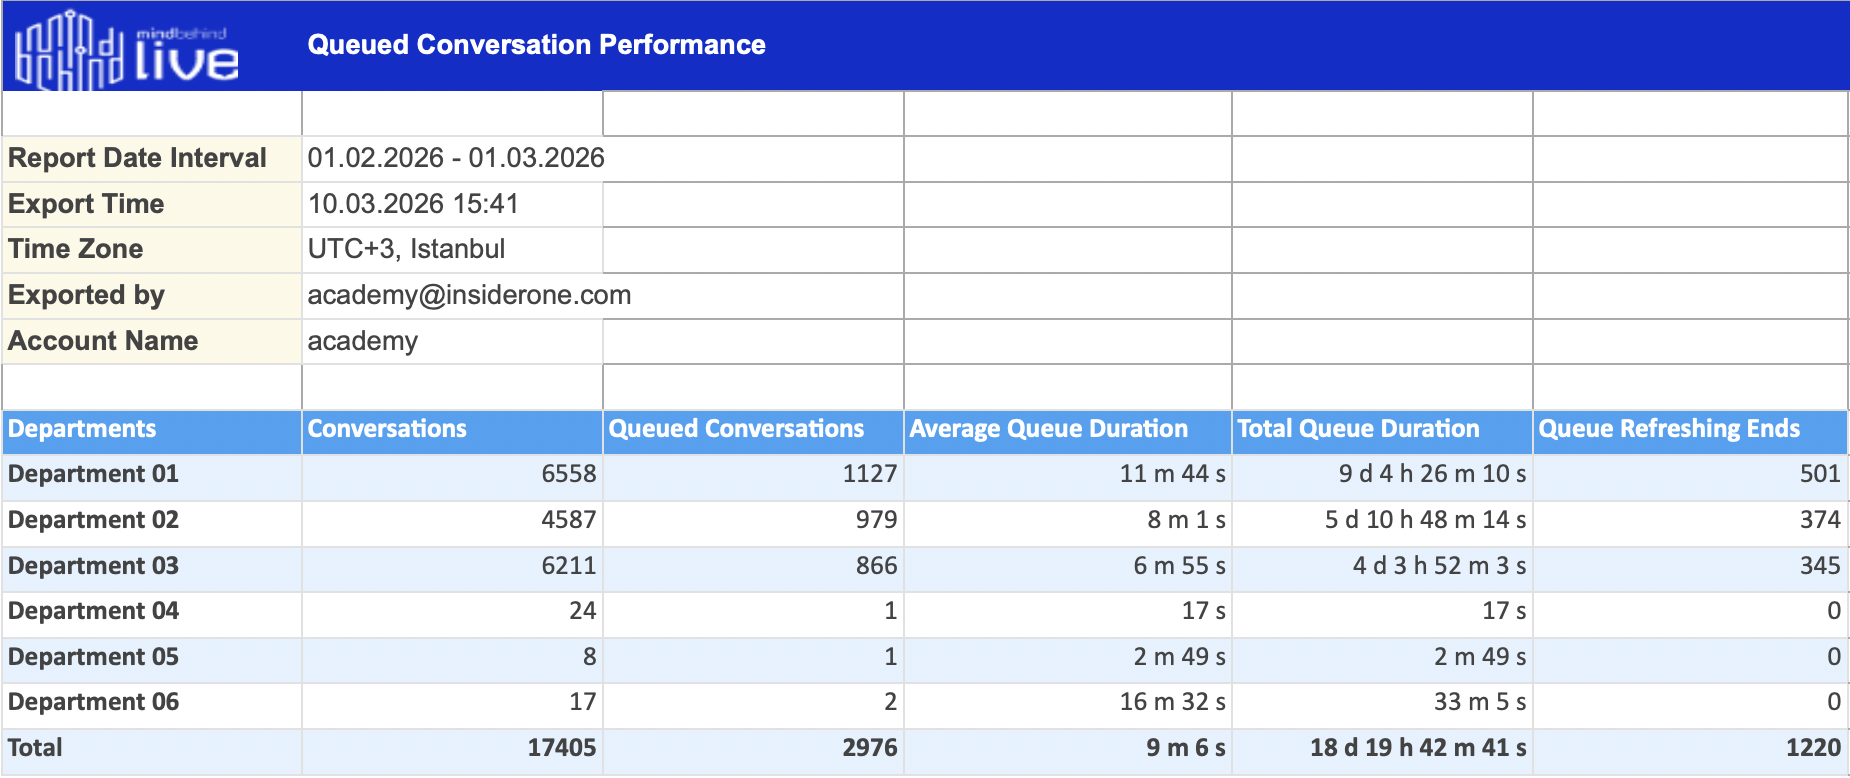
Exported Report File
When you export the Queue Time Report, the file is generated in XLSX format for easy analysis and sharing. The following are the metrics included in the exported file:
Report Date Interval: The date range for which the report data is generated (e.g., 2025-01-01 to 2025-01-15).
Export Time: The exact timestamp when the report was exported (e.g., 2025-01-15 13:32:00).
Time Zone: The time zone used for timestamps in the report (e.g., UTC+3 Istanbul).
Exported By: The email of the individual who generated the export.
Account Name: The name of the company associated with the report.
By Department Summary
The exported file includes the following metrics for the department summary:
Departments: The name of the department.
Conversations: Total number of conversations received by departments.
Queued Conversations: Total number of conversations waiting in the queue for over three seconds.
Average Queue Duration: Average duration of conversations waiting in the queue (in HH:MM:SS format).
Total Queue Duration: Total duration of conversations waiting in the queue (in HH:MM:SS format).
Queue Refreshing Ends: If the Queue Refreshing Ends feature is enabled, conversations initiated through the Web Messenger channel are automatically closed by the system if the user leaves the Web Messenger environment within the defined time period.
The number of conversations closed automatically by the system due to this condition is also included in this table.
By Hour Summary
The exported file also includes the following metrics for the hourly breakdown:
Time Interval: The hourly interval (e.g., 00:00 - 01:00).
Conversation Count: Total number of conversations during this interval.
Queued Conversation Count: Total number of conversations waiting in the queue for over three seconds.
Average Queue Duration: Average duration of conversations waiting in the queue (in HH:MM:SS format).
Total Queue Duration: Total duration of conversations waiting in the queue (in HH:MM:SS format).
Queue Refreshing Ends: If the Queue Refreshing Ends feature is enabled, conversations initiated through the Web Messenger channel are automatically closed by the system if the user leaves the Web Messenger environment within the defined time period.
The number of conversations closed automatically by the system due to this condition is also included in this table.
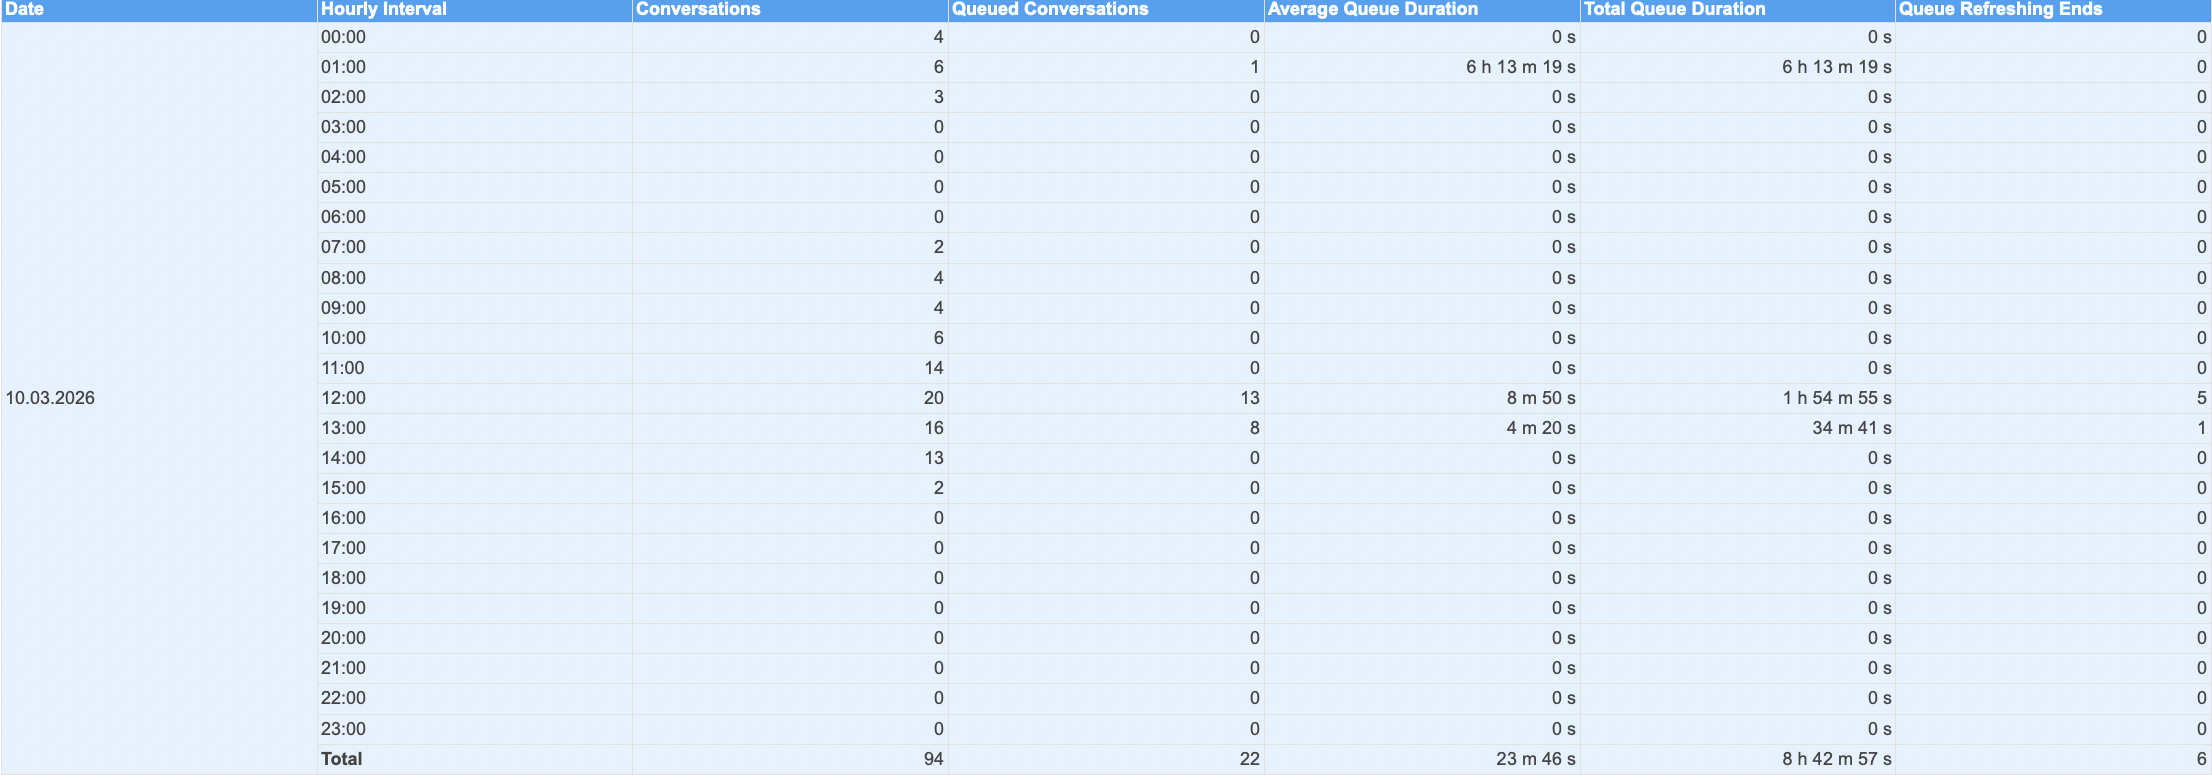
If you generate a report for a date range longer than one day, the metrics displayed in the "By Hour Report" on the platform will reflect total values for the start date. However, the exported file provides a daily breakdown of metrics within the selected range, offering a more detailed view of daily performance. Below is an example of the exported file's structure: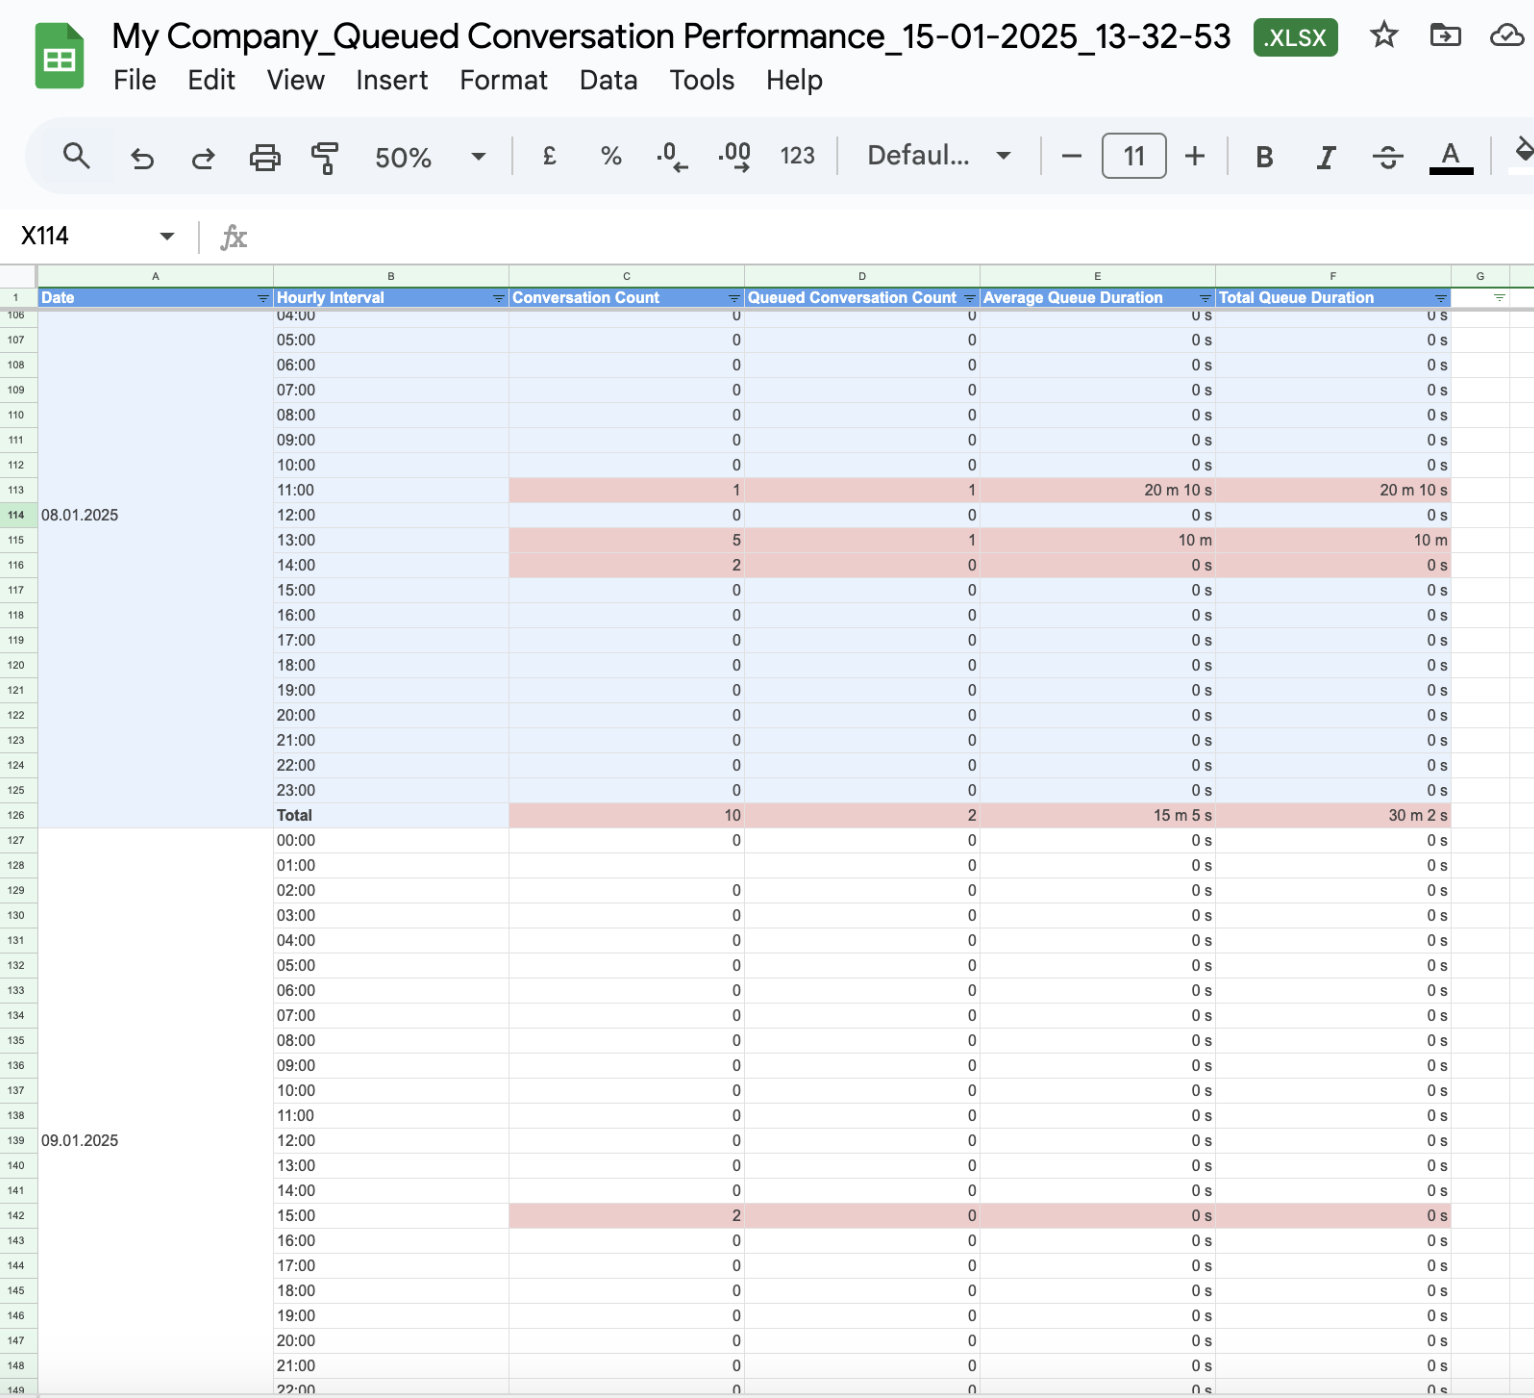
Use Cases
Understanding queue performance is essential for efficient resource allocation and improved customer service. You can refer to the following use cases for leveraging queue metrics to optimize operations and enhance customer experiences:
Identify peak hours: Analyze the hourly breakdown to pinpoint periods with the highest volume of queued conversations.
Optimize staffing: Use department summaries to allocate staff effectively during peak periods.
Enhance customer experience: Analyze trends to reduce average queue times and improve overall service quality.
FAQ
Q: How often is the Queued Conversation Performance Report updated?
A: The report is updated as soon as a conversation is ended to provide near-real-time insights.
Q: Can I export the Queue Time Report?
A: Yes, the report can be exported in XLSX format for further analysis.
Q: Are historical data available in the Queue Time Report?
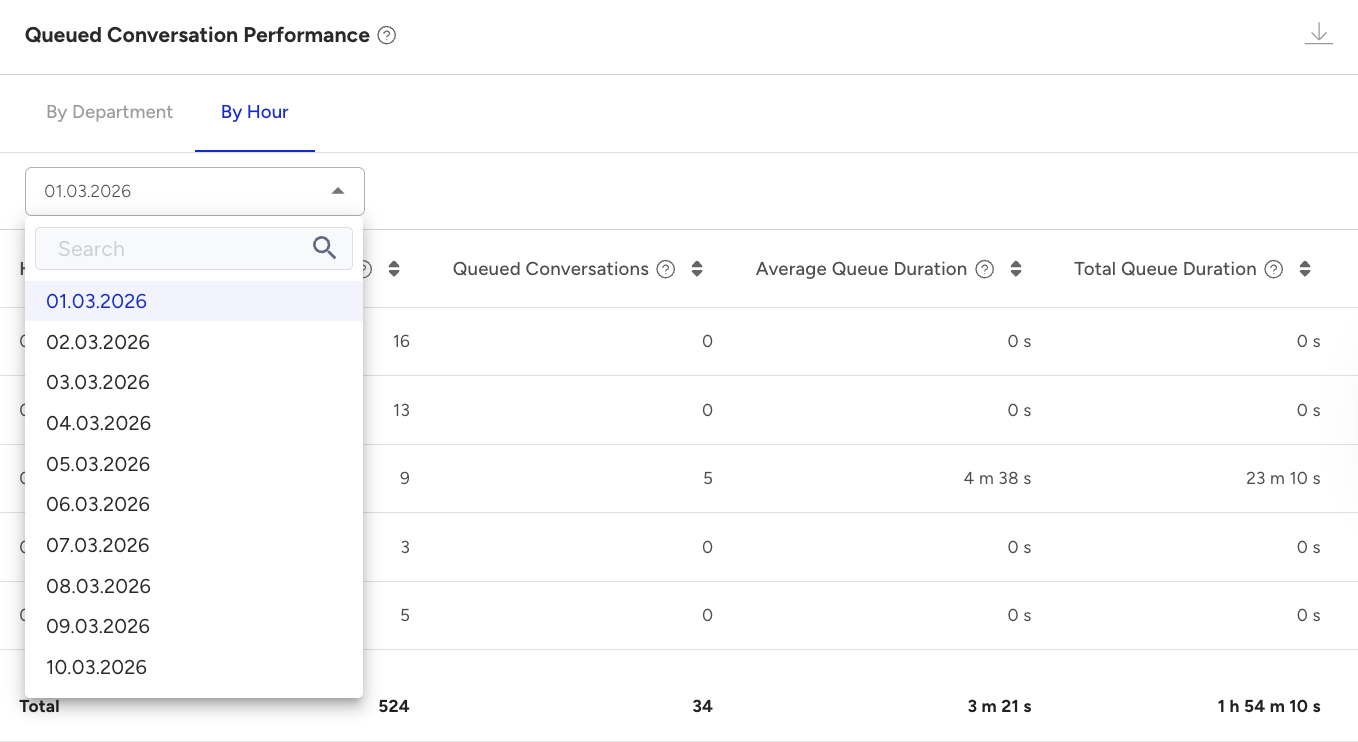
A: Yes, you can view data for a specific date range using the filter option at the top of the page. However, in the hourly breakdown, you will be able to see the Start Date of your selection in the date range.
To view a specific day, select the desired date from the Hour tab.