While Smart Recommender Analytics enables users to see the ROI of all active Smart Recommender campaigns, Campaign-Specific Analytics allows users to track the ROI of each individual campaign according to the campaign goals and the variants created during the design step.
Smart Recommender Campaign Level Analytics allows you to track the ROI of each campaign based on its goals and variants created during the Design step, within the specified time range.
This article covers the answers to the questions below:
- How can I filter the results?
- What are the summary metrics?
- How can I interpret the metrics dashboard?
- What are the goal metrics?
- How can I export the Smart Recommender analytics?
To see the Smart Recommender campaign-level analytics, click on Analytics for your campaign on the Smart Recommender's listing page.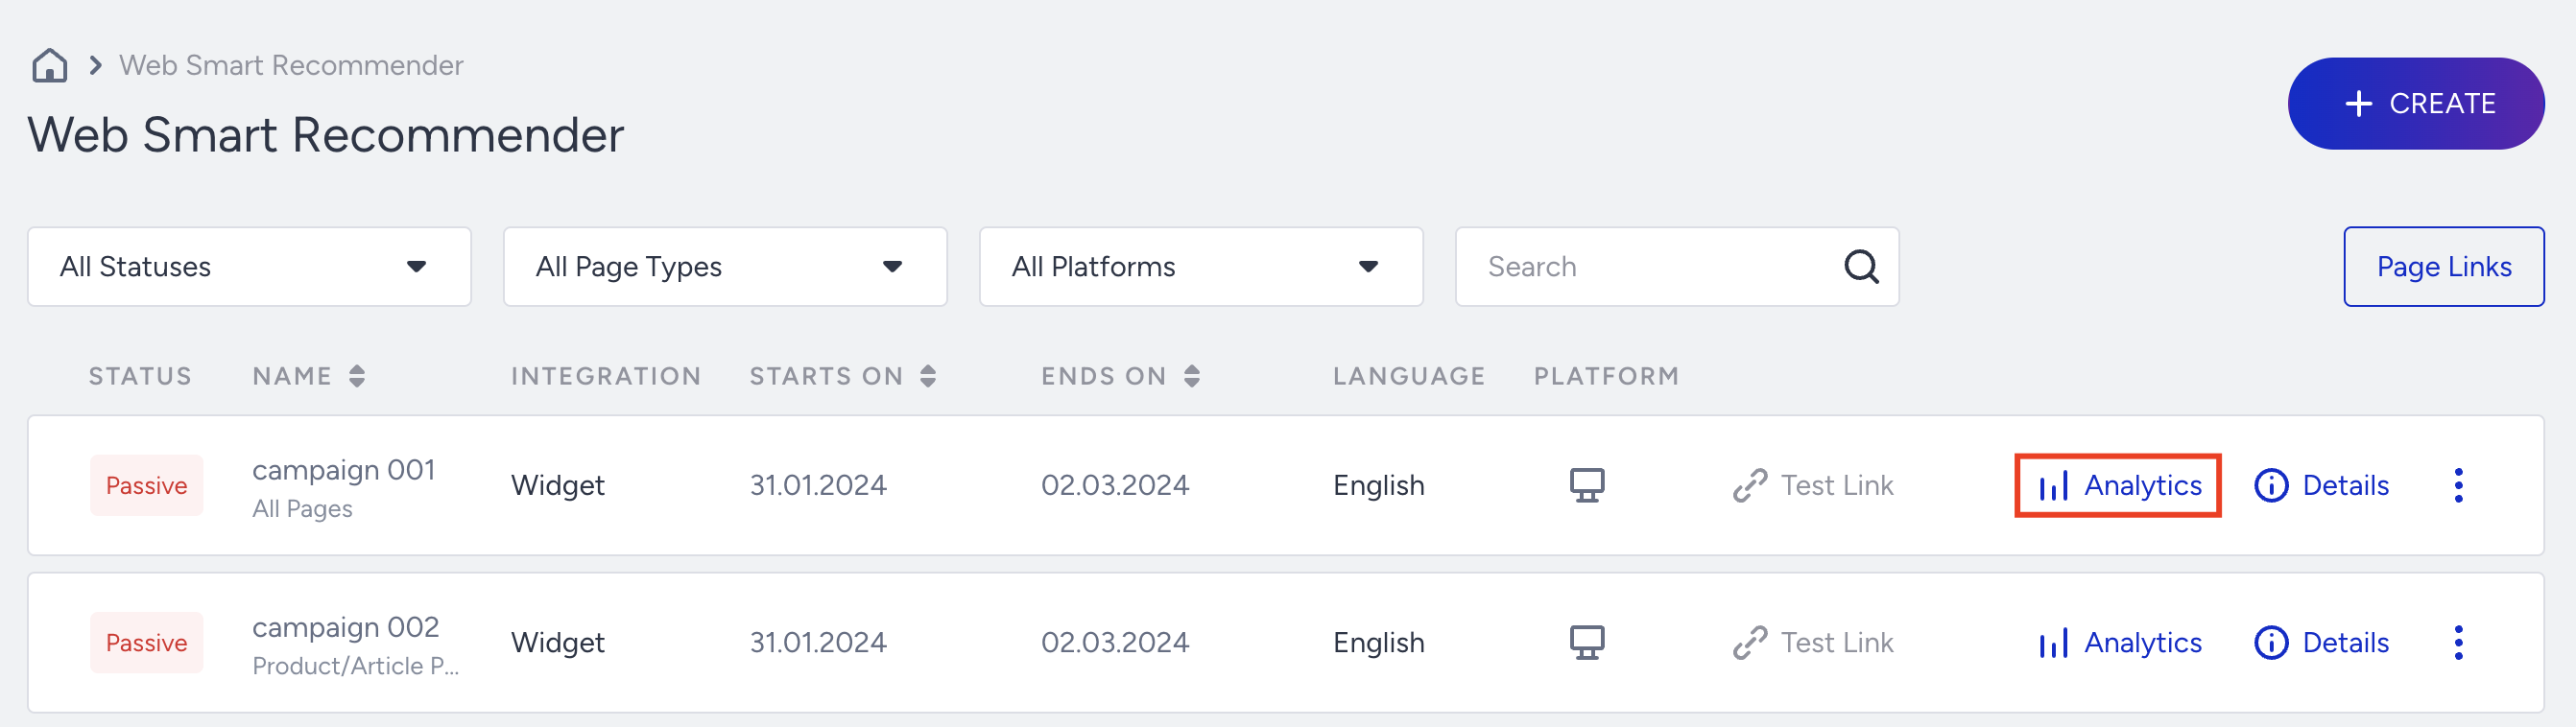
Filter your results
Once you land on the Analytics page, you can select which goal metric you want to see from the Goal dropdown menu.
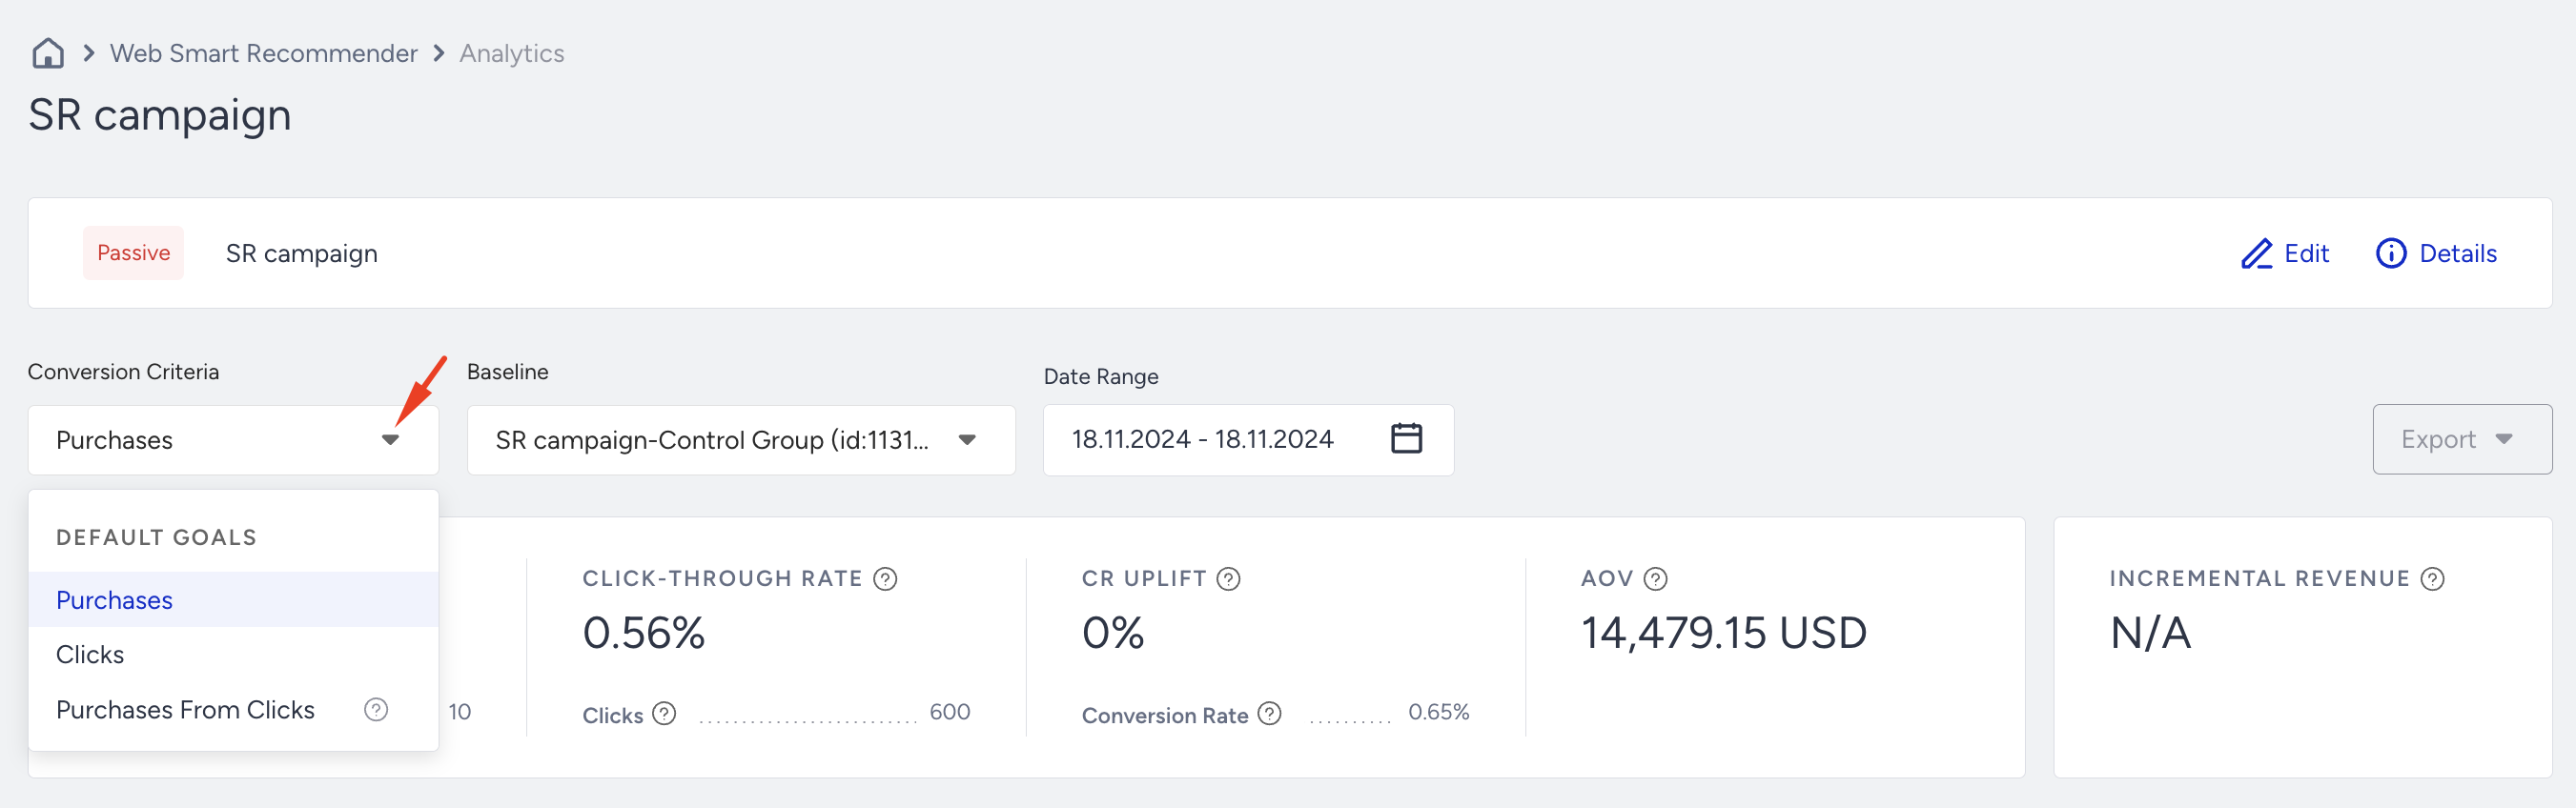
You can also select the Variant to see its detailed analytics from the Base Group.
When you select Goal, Base Group, and Date Range, you can analyze your campaign's results accordingly.
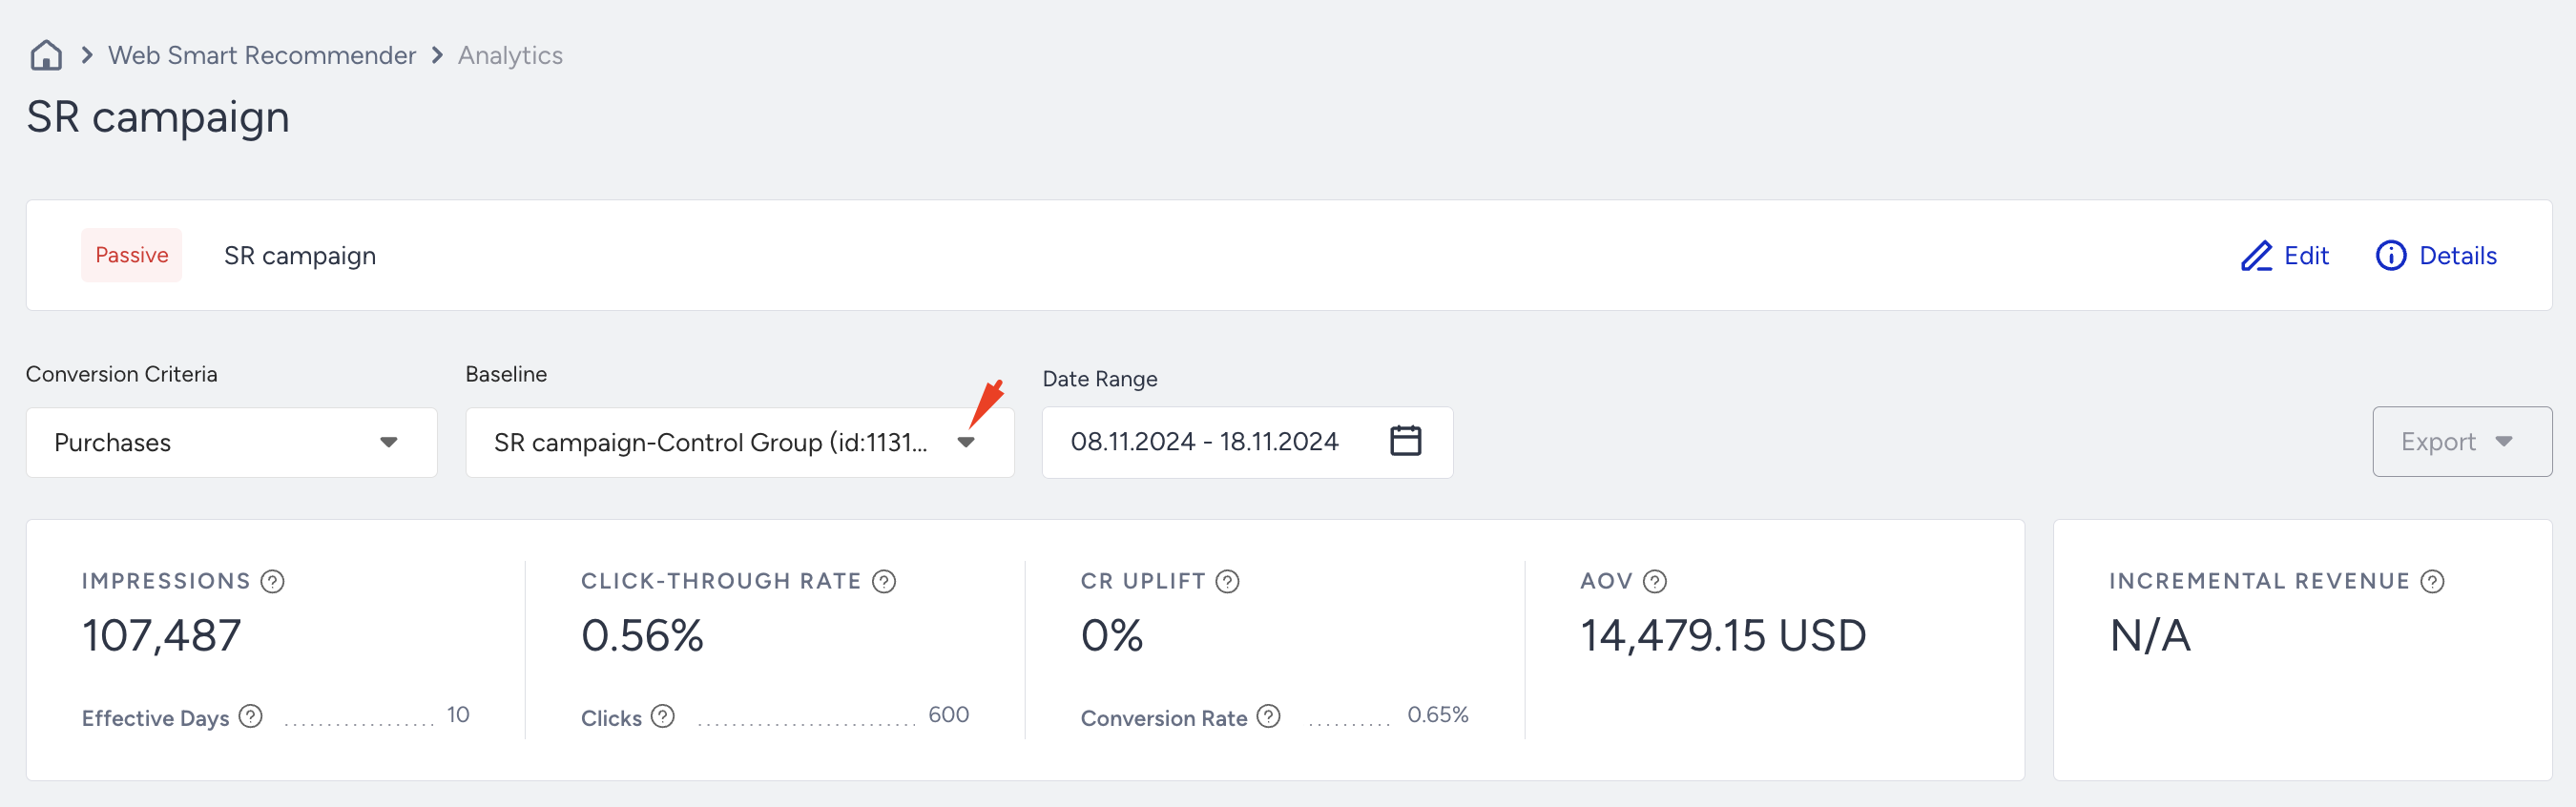
Summary Metrics
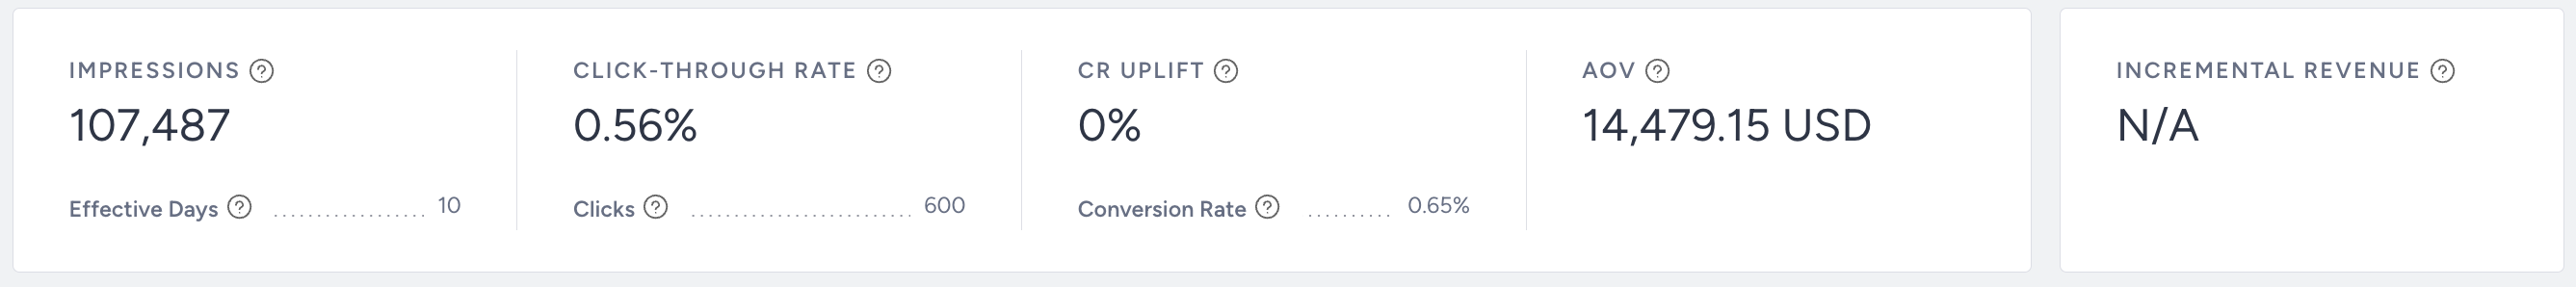
- Impressions: The number of times that the users viewed your variant.
- Effective Days: The number of days at least one variant has been viewed more than 10 times.
- Click-Through Rate: The percentage of clicks to the impressions.
- Clicks: The total number of times the users clicked the links in your variants.
- CR Uplift: The percentage of the conversion rate difference between the variant and the selected baseline group.
- Conversion Rate: The percentage of conversions to the impressions.
- Average Order Value (AOV): The revenue divided by the number of conversions.
- Incremental Value: The extra revenue your variants generated compared to the control group, considering traffic allocations.
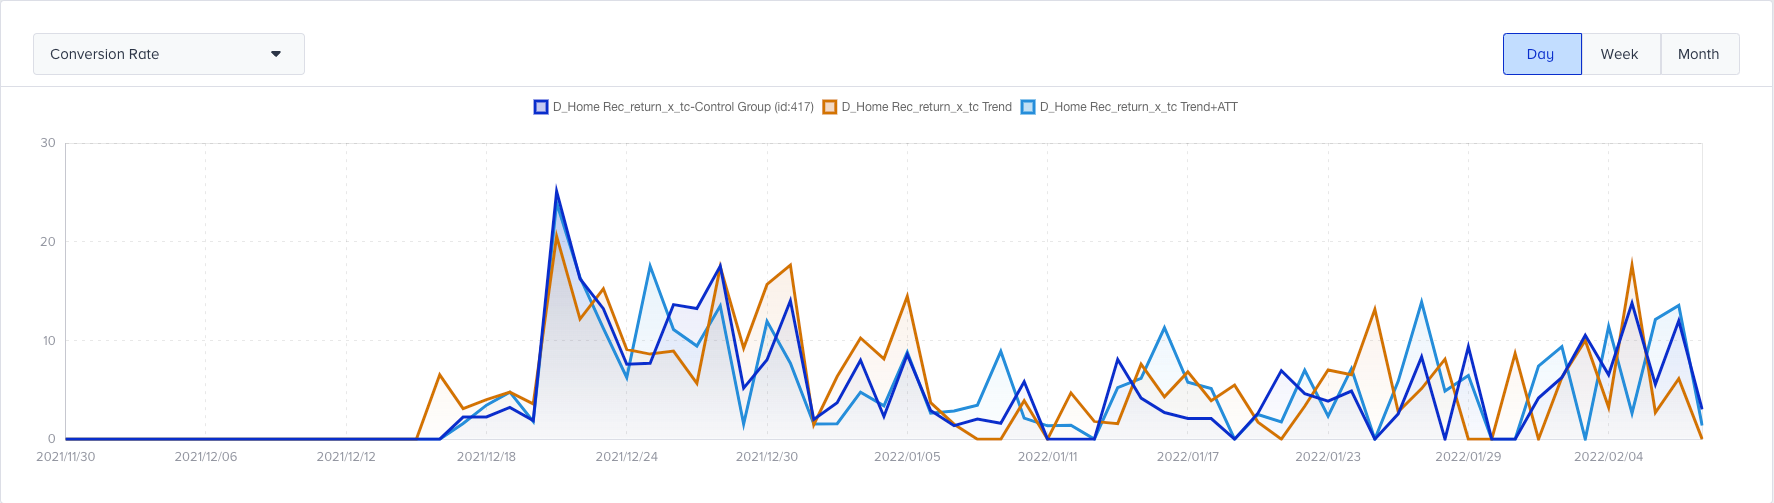
Metrics Dashboard
The Metrics Dashboard provides graphical information about each active variant of your Smart Recommender campaign, including the control group. From the dropdown menu, you can select which information to visualize, choosing from Conversion Rate, Conversions, and Impressions.
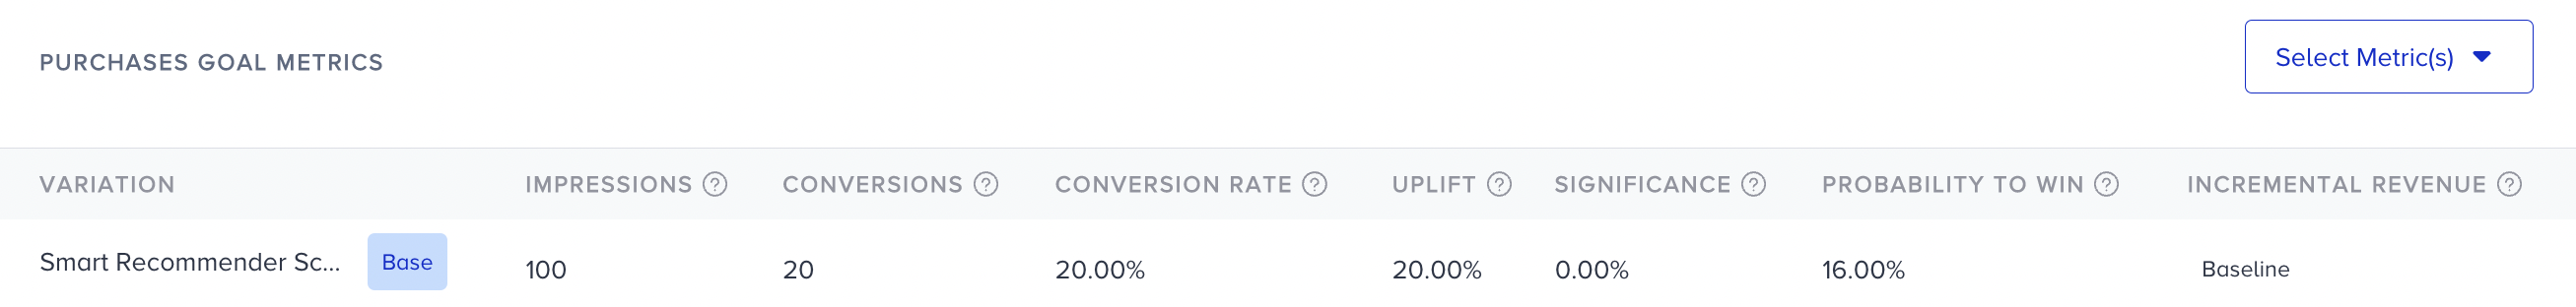
Goal Metrics
From the dropdown menu, you can select Goal Metrics for each active variant in your campaign that you want to display on the dashboard.
- Impressions: The number of times that the users viewed your variant.
- Conversions: The number of successful primary goal occurrences.
- Conversion Rate: This metric indicates the percentage of visitors who complete the goal of your variant.
- Uplift: Conversion rate uplift is calculated by comparing the conversion rate of the variation to that of the control group.
- Significance: Significance is a global statistical term used for A/B Testing reports. It determines whether a report is reliable to take action based on it. Significance depends on the size of the experiment, meaning the number of impressions and the difference in the performance, or, in other words, uplift. The score indicates whether the data is sufficient to continue or end the experiment. For example, if the Significance is <95%, the experiment is insignificant.
- Probability to Win: Probability to Win is the likelihood of this variant to best the other variant(s) in the test. Based on the data collected, this percentage is calculated using Bayesian Significance.
- Incremental Revenue: The extra revenue generated by the variation is calculated by subtracting the control group's value from the variation's value.
- Incremental Conversion: This metric is the number of extra conversions any personalization group generates. It is calculated by comparing the variant's performance to that of the control group.
- Revenue: The value of purchases made from your variant.
- AOV(Average Order Value): The revenue ratio to the total sales.
- AOV Uplift: Average order value uplift is calculated based on the ratio of the average order value of the variation to that of the control group. The difference in average order value performance between the variation and the control group will give this uplift.
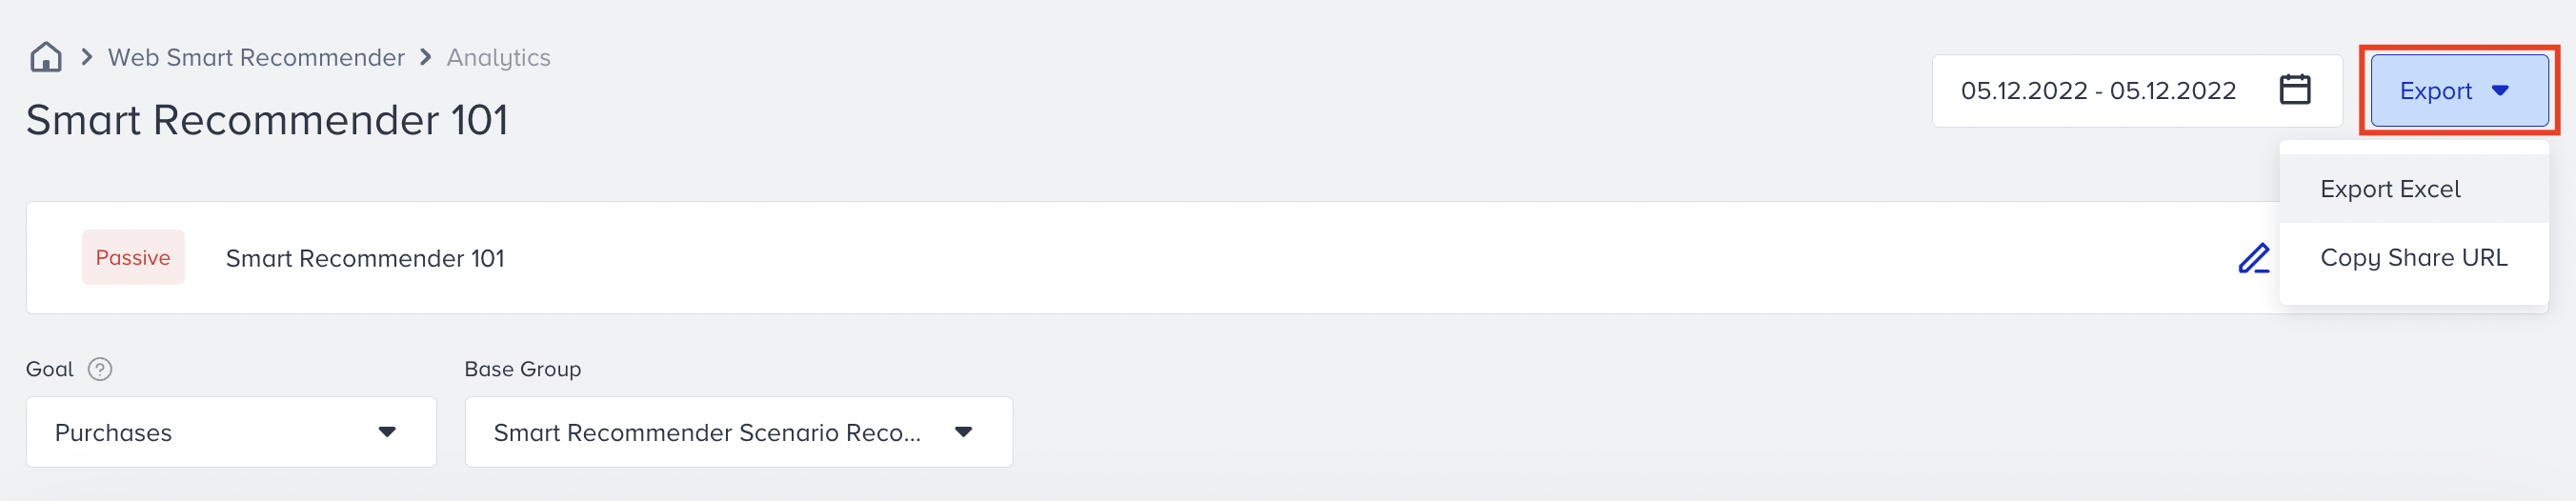
Export your results
You can export Smart Recommender analytics data for the desired time range in two ways: as an Excel file or by copying its URL.