Segment Analytics shows how your audiences change over time. It captures a daily snapshot of each segment's user count and displays it as an interactive trend chart, so you can see whether a segment is growing, shrinking, or holding steady.
You can use Segment Analytics to monitor the health of your most important audiences: track your total user base to catch unexpected drops, follow opt-in segments to measure consent growth, and watch high-value behavioral segments ahead of a campaign launch.
Tracking must be enabled for a segment before any data is collected. Historical data from before tracking was enabled cannot be retrieved. Segment Analytics only shows data from the date tracking started onward. If you untrack a segment, its data will be retained for a limited period and permanently deleted afterward.
Track a segment
To start collecting Segment Analytics data, you need to enable tracking for the segment. You can enable tracking from the Dynamic Segments listing page.
Navigate to Audience > Segments > Dynamic Segments.
To track a segment:
Find the segment you want to monitor on the listing page.
Click the three-dot menu on the right side of the row and select Track Segment, or click the Analytics icon directly in the Actions column.
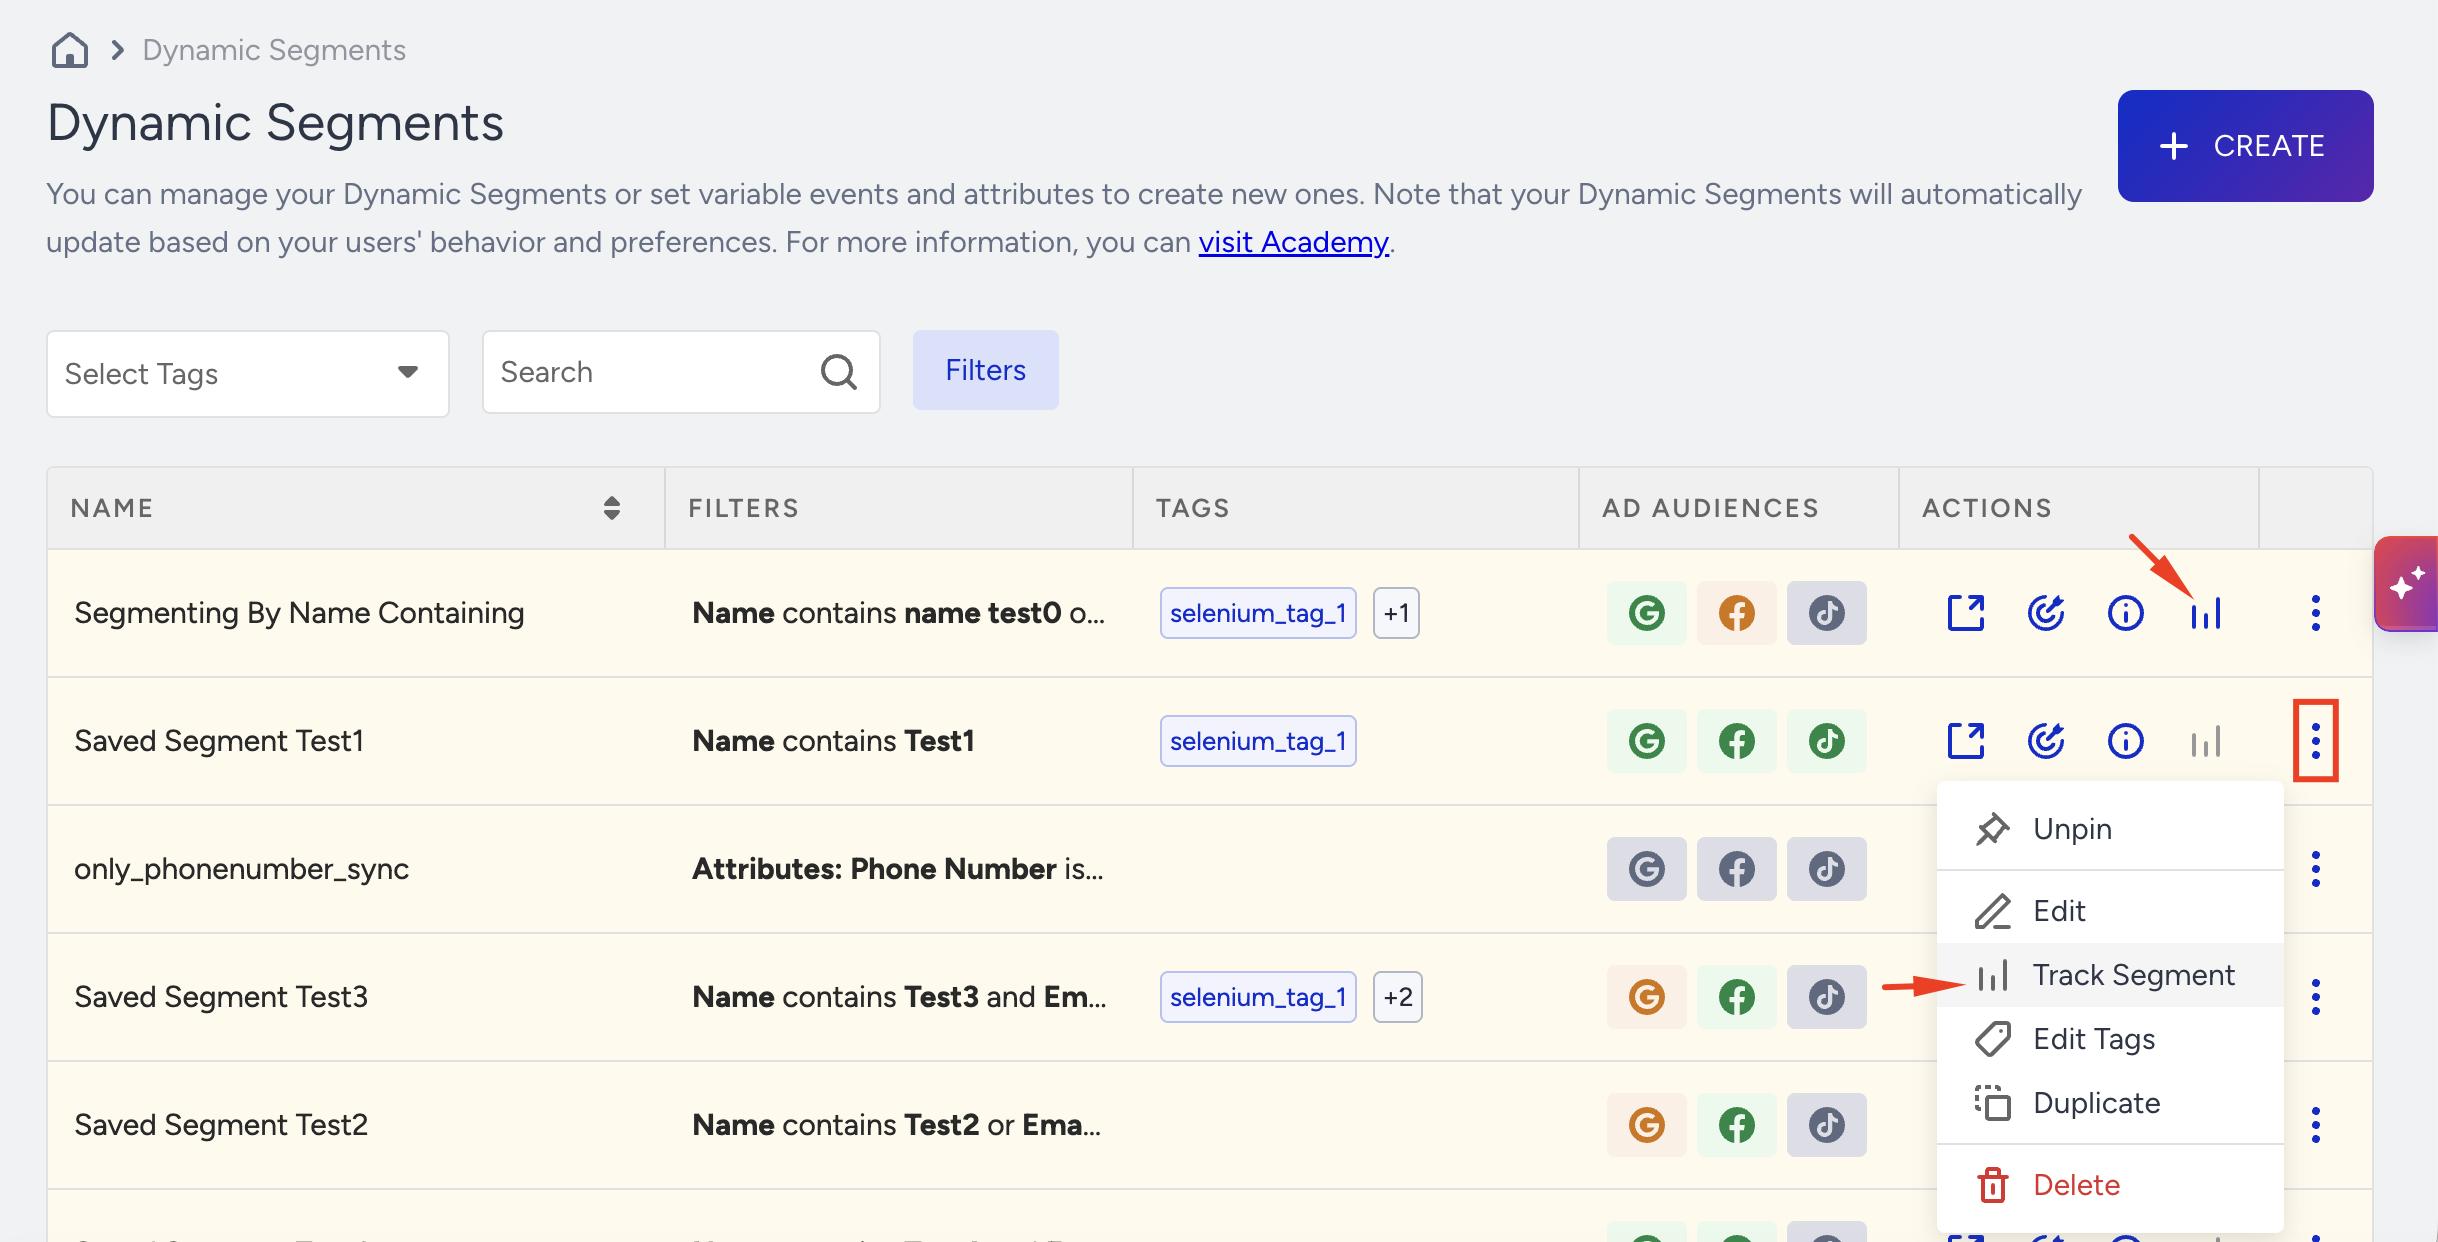
You can track up to 10 segments simultaneously. If you have reached the limit, a notification will appear. To free up a slot, untrack an existing segment by selecting Untrack from its three-dot menu.
If you untrack a segment, its historical data will be retained for a limited period before being permanently deleted. To preserve continuity, only untrack segments you no longer need to monitor.
View Segment Analytics
To view the Segment Analytics page for a tracked segment:
Navigate to Audience > Segments > Dynamic Segments.
Find your tracked segment and click the Analytics icon in the Actions column.
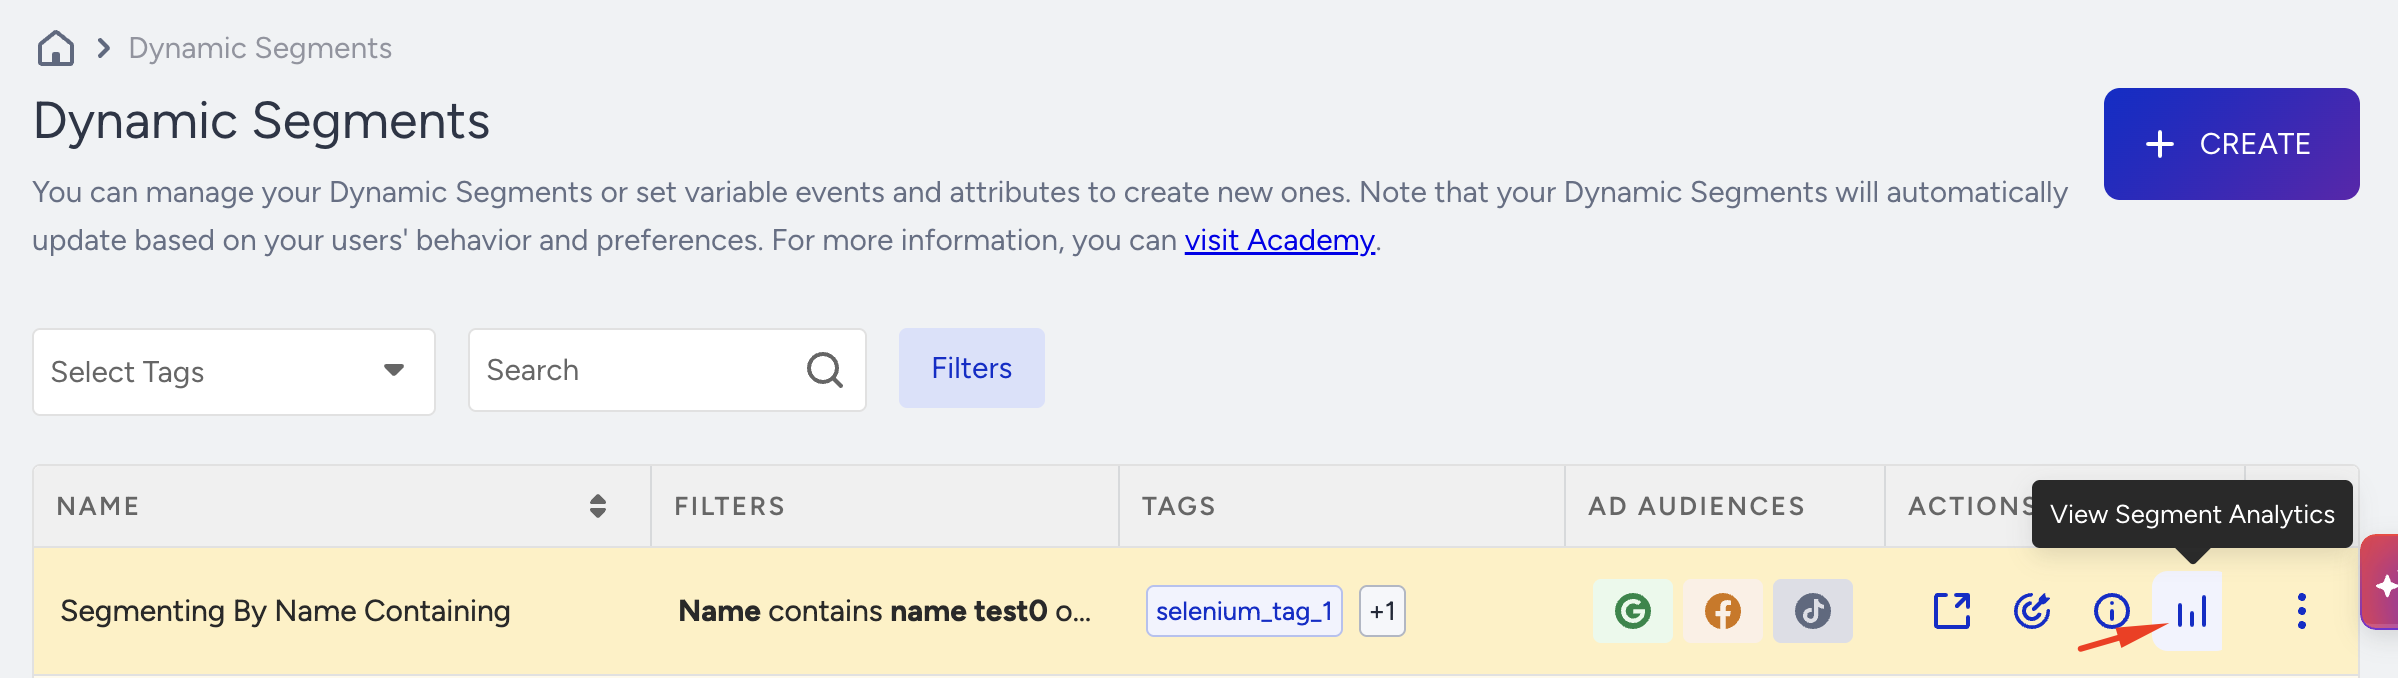
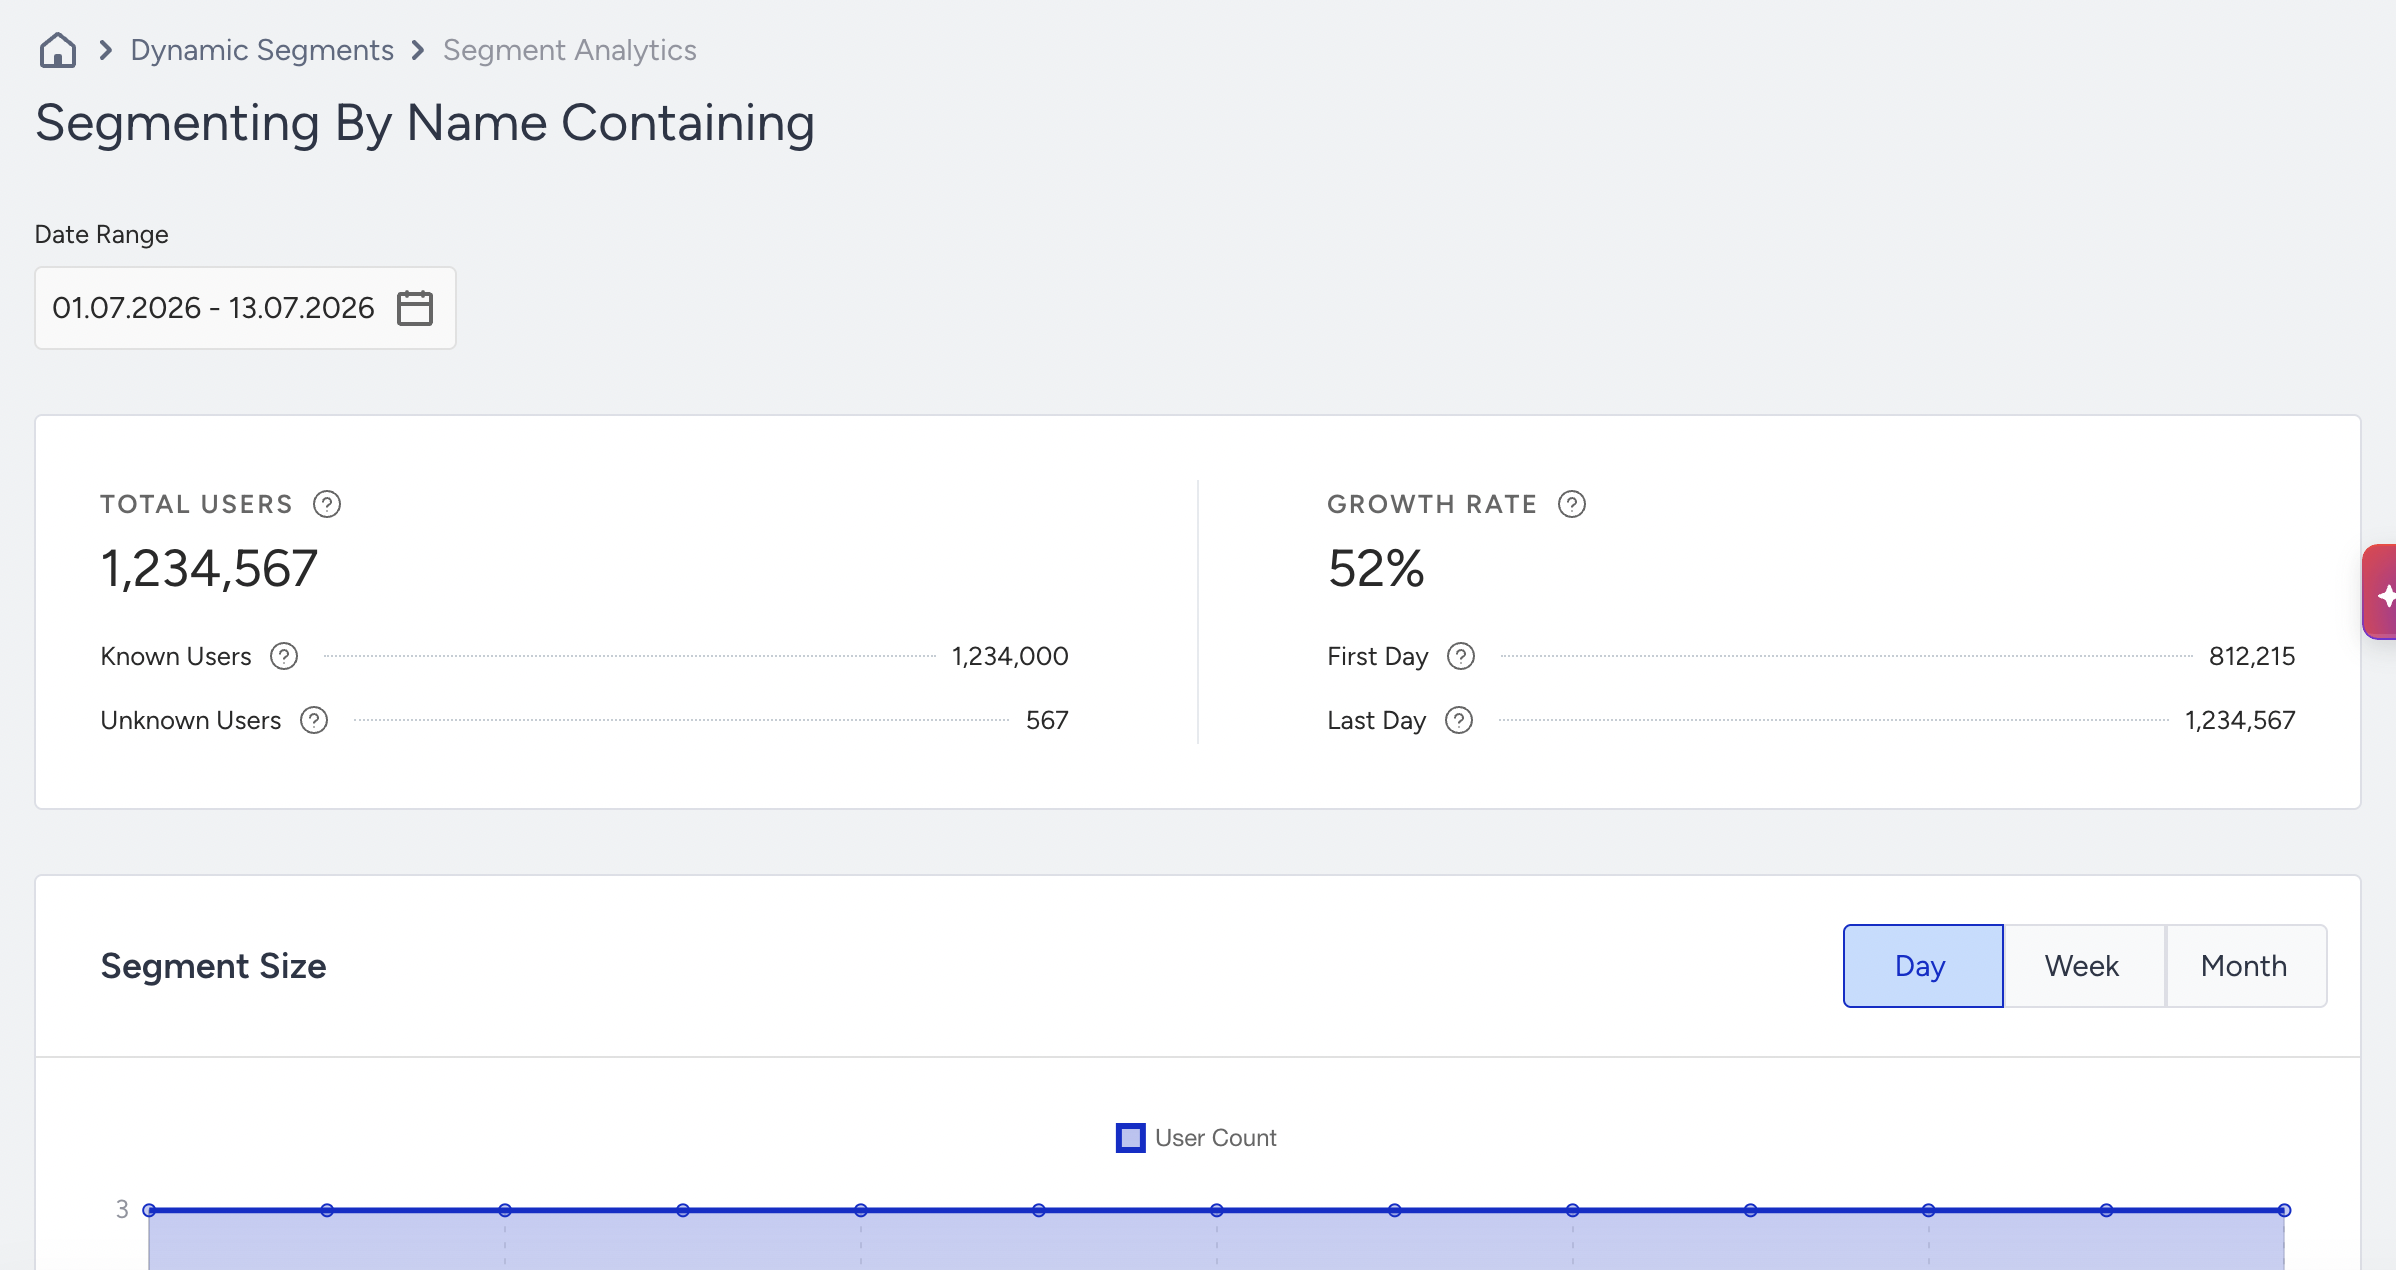
You land on the Segment Analytics page for that segment.
Segment Analytics details
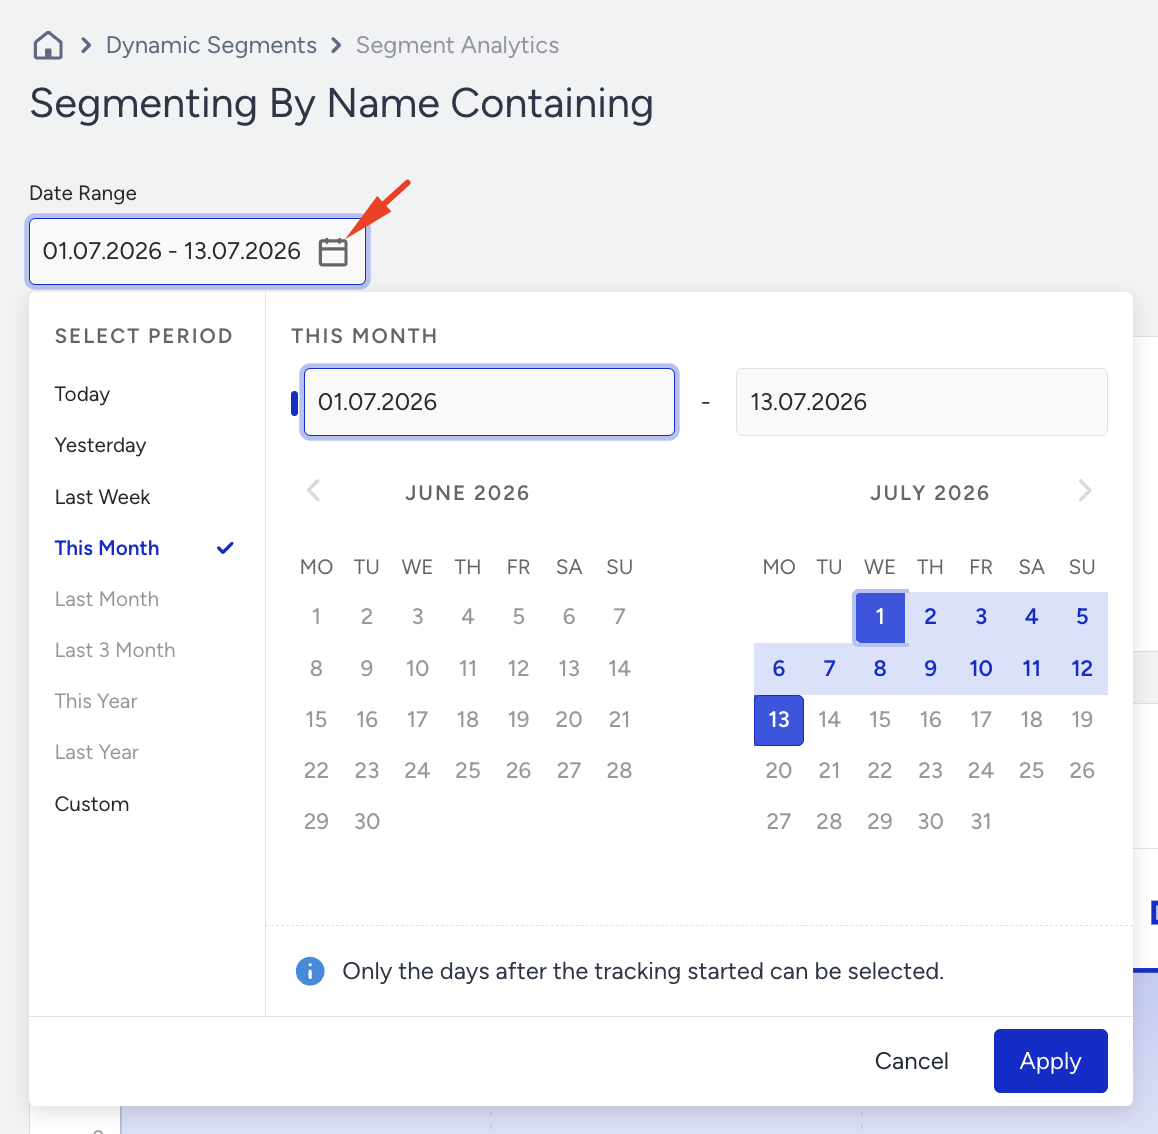
At the top of the page, use the Date Range selector to define the analysis window. The available presets are Today, Yesterday, Last Week, This Month, Last Month, Last 3 Months, This Year, Last Year, and Custom.
Key Metrics
The metrics panel at the top of the page summarizes your segment's performance across the selected date range:

Total Users: The total number of users currently in the segment. Broken down into:
Known Users: The number of identified users in your audience.
Unknown Users: The number of unidentified users in your audience.
Growth Rate: The percentage change in segment size from the first day to the last day of the selected date range.
First Day: The total number of users on the first day of the selected date range.
Last Day: The total number of users on the last day of the selected date range.
Segment Size Chart
The Segment Size chart visualizes how the user count in your segment changes across the selected period. Use the toggle buttons in the top-right corner of the chart to switch between Day, Week, and Month aggregation views. Hover over any point on the chart to see the exact user count for that date.
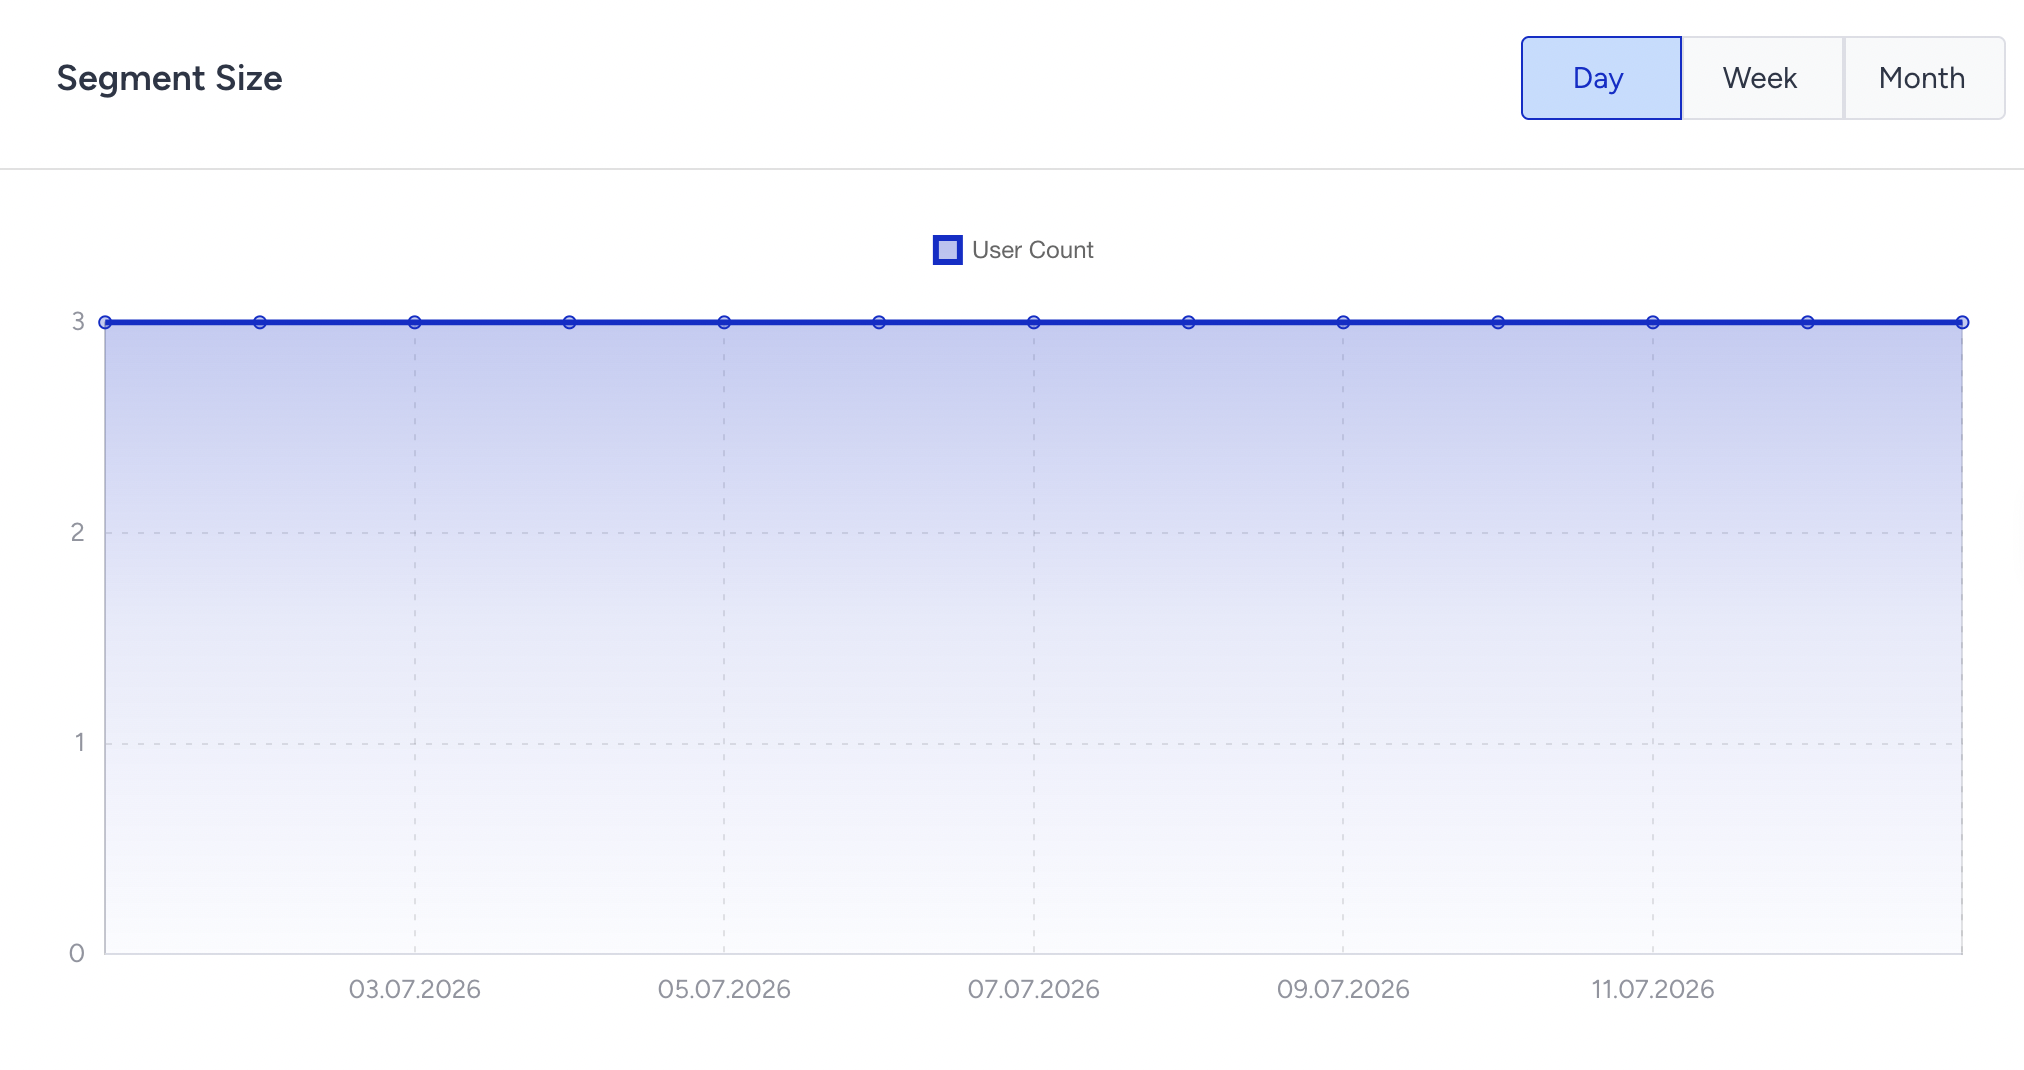
The chart data is updated once per day.
Segment Size Growth Table
Below the chart, the Segment Size Growth table presents the same data in tabular format. Each row displays:
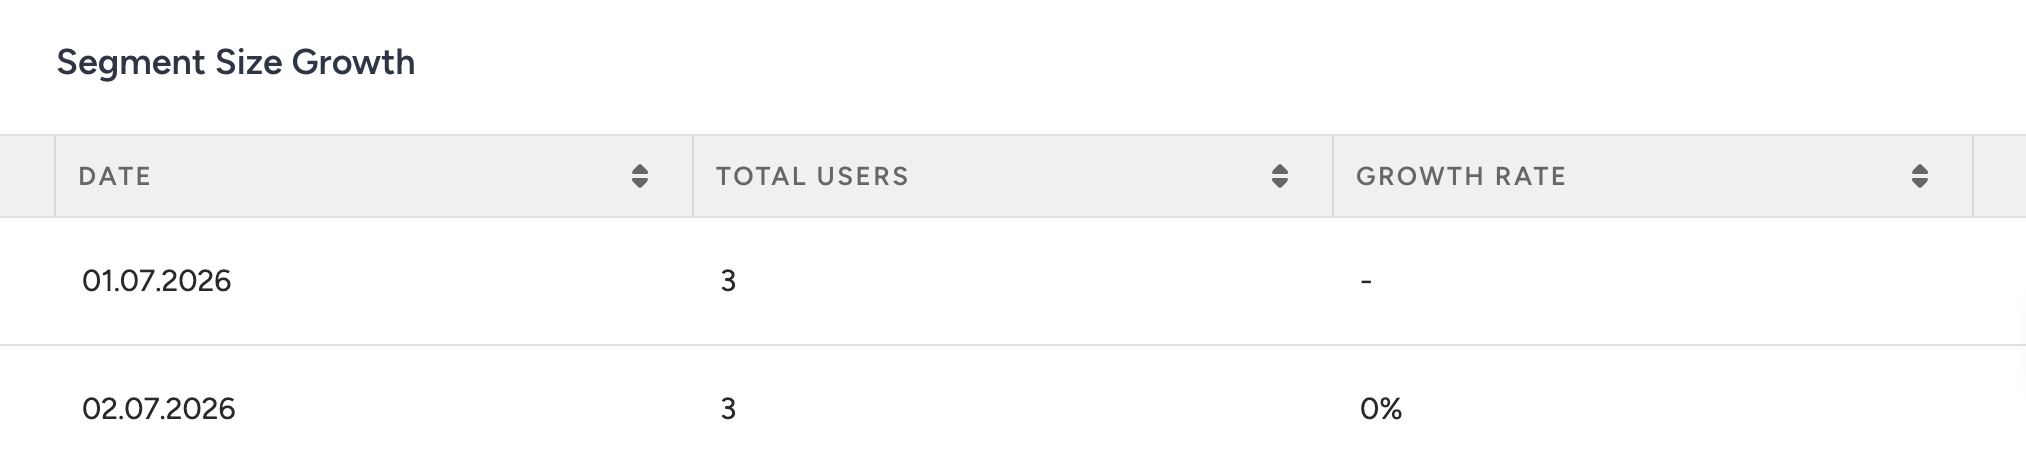
Date: The date or period for that data point.
Total Users: The total number of users in the segment on that date.
Growth Rate: The percentage change compared to the previous period.
If a segment was untracked for a period and then re-tracked, the chart will show a visible gap for the days when tracking was inactive. Hovering over the gap in the chart will display "Segment track not available." The corresponding rows in the Segment Size Growth table will show N/A for both Total Users and Growth Rate during that period.