The MindBehind Live Dashboard gives you two main views: Real-Time Agent Analytics and Conversation & Agent Analytics. You can switch between these tabs at any time to view live activity or explore detailed performance reports.
On the dashboard, you’ll find the following components:
Real-Time Agent Analytics
Real-Time Agent Analytics lets you track live conversation activity and team performance, so you can quickly see how agents and departments are handling customer interactions in the moment.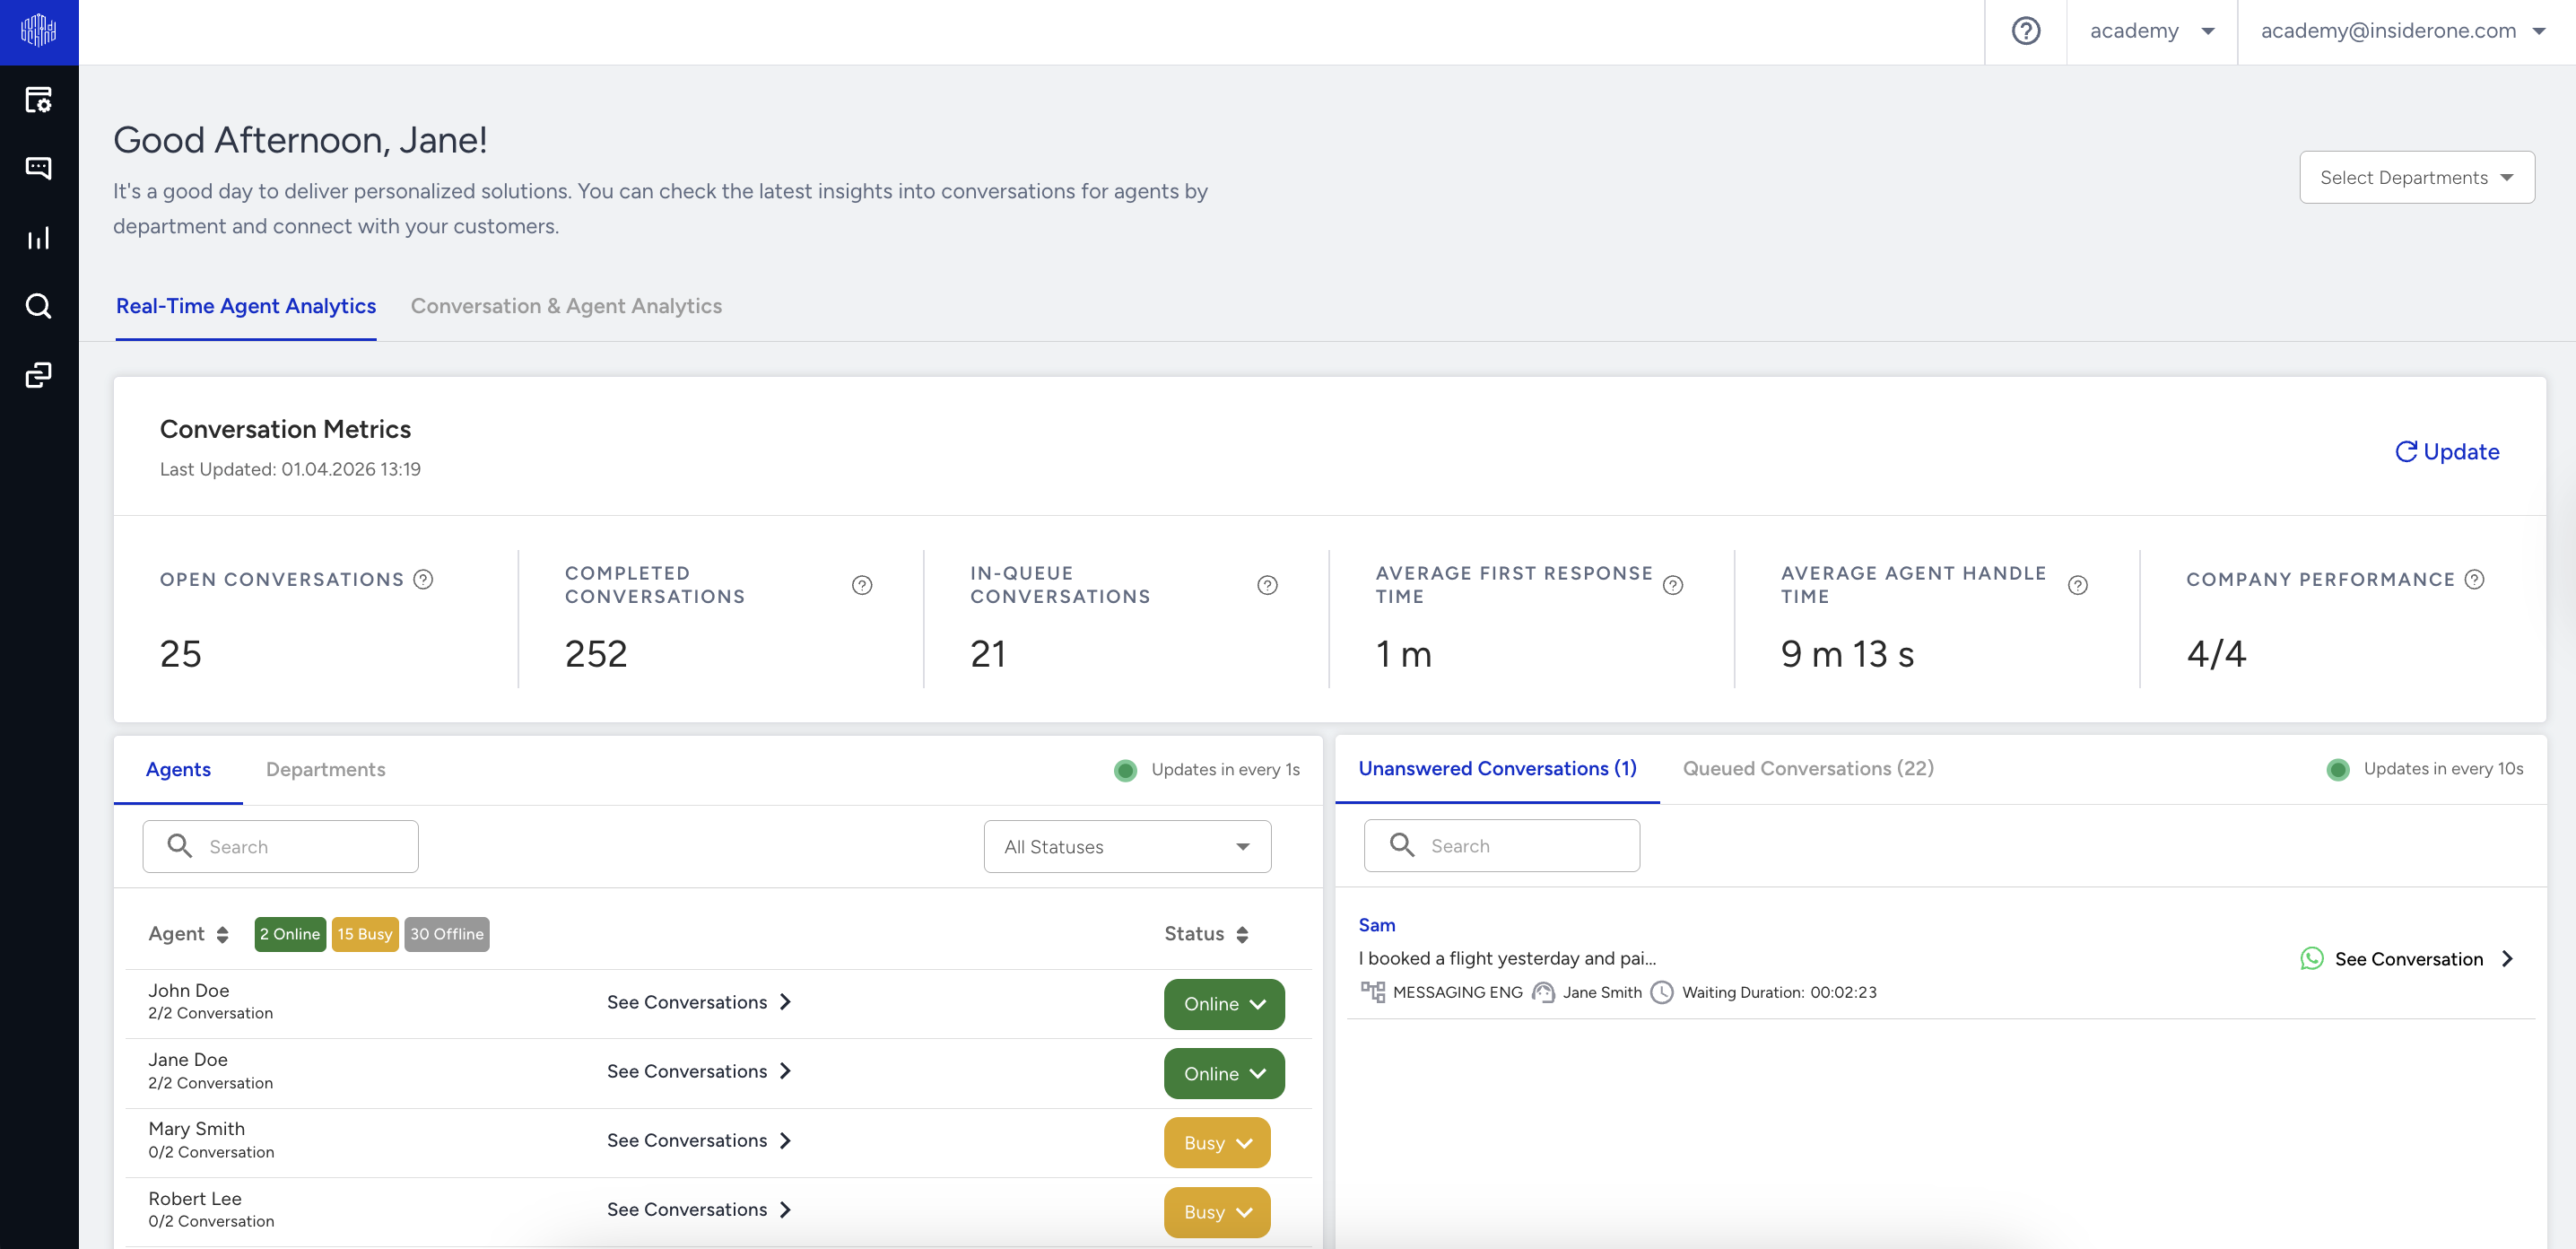
Conversation Metrics (Company Quick Report)
This area displays real-time, daily updated information and does not provide retrospective data. You can use the department filter at the top of the page to refine the view. The data presented includes the following:
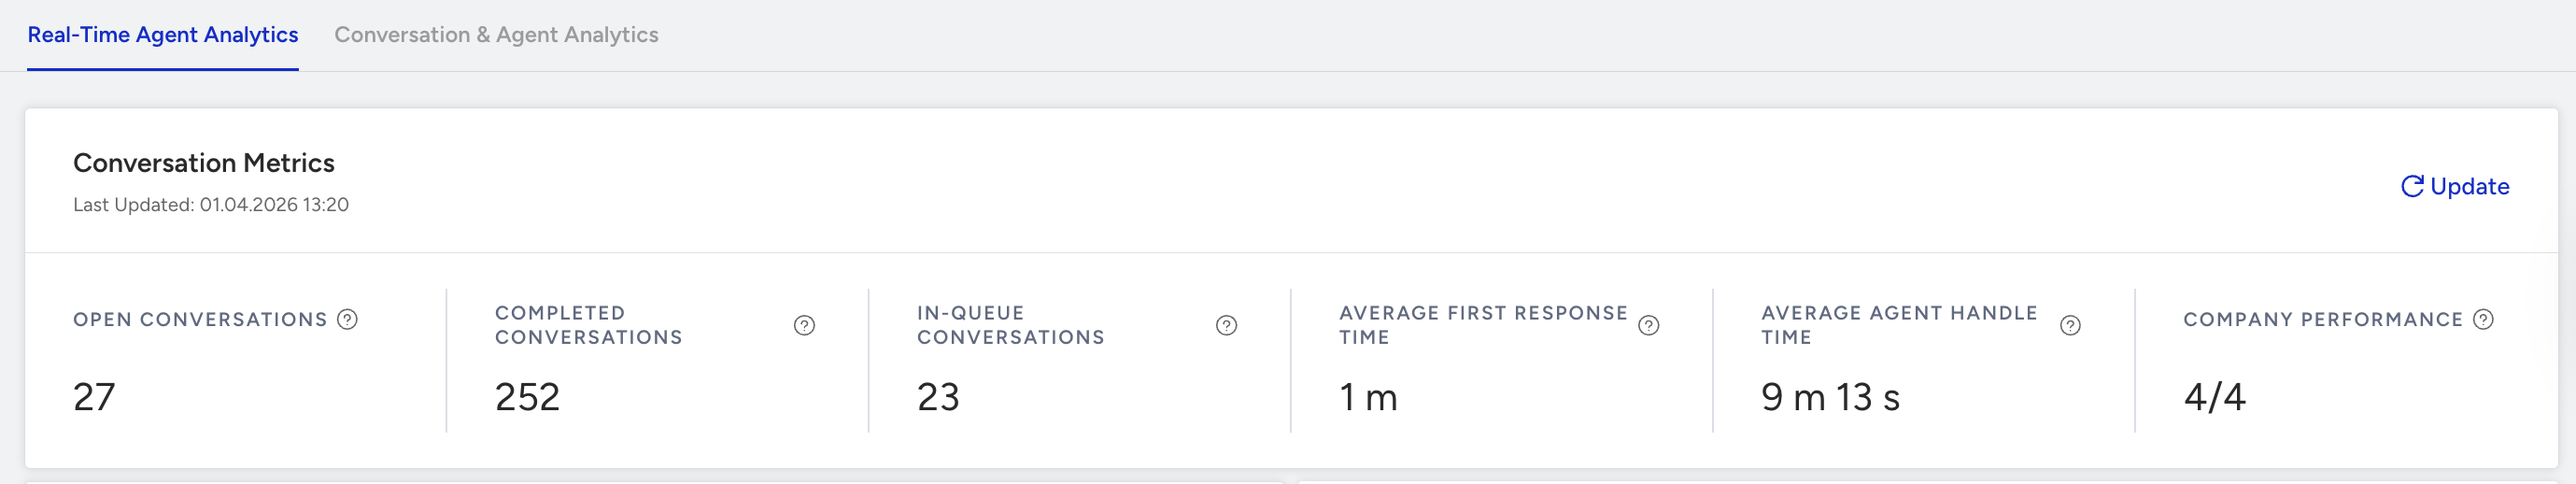
Open Conversations: Sum of active conversations that are with agents and in the queue.
Completed Conversations: Daily total number of completed conversations in departments.
In-Queue Conversations: Consumers waiting in the chat queue to be assigned to an agent.
Average First Response Time: Daily average first response time for the completed conversation.
Average Agent Handle Time: Daily average conversation duration for the completed conversations for conversations that have been assigned to an agent.
Company Performance: The value on the right indicates the total number of conversations that your online agents can cumulatively handle. The value on the left indicates the number of conversations that are currently being handled by agents.
Agents and Departments
The Agents and Departments tabs display real-time information about team availability and workload.
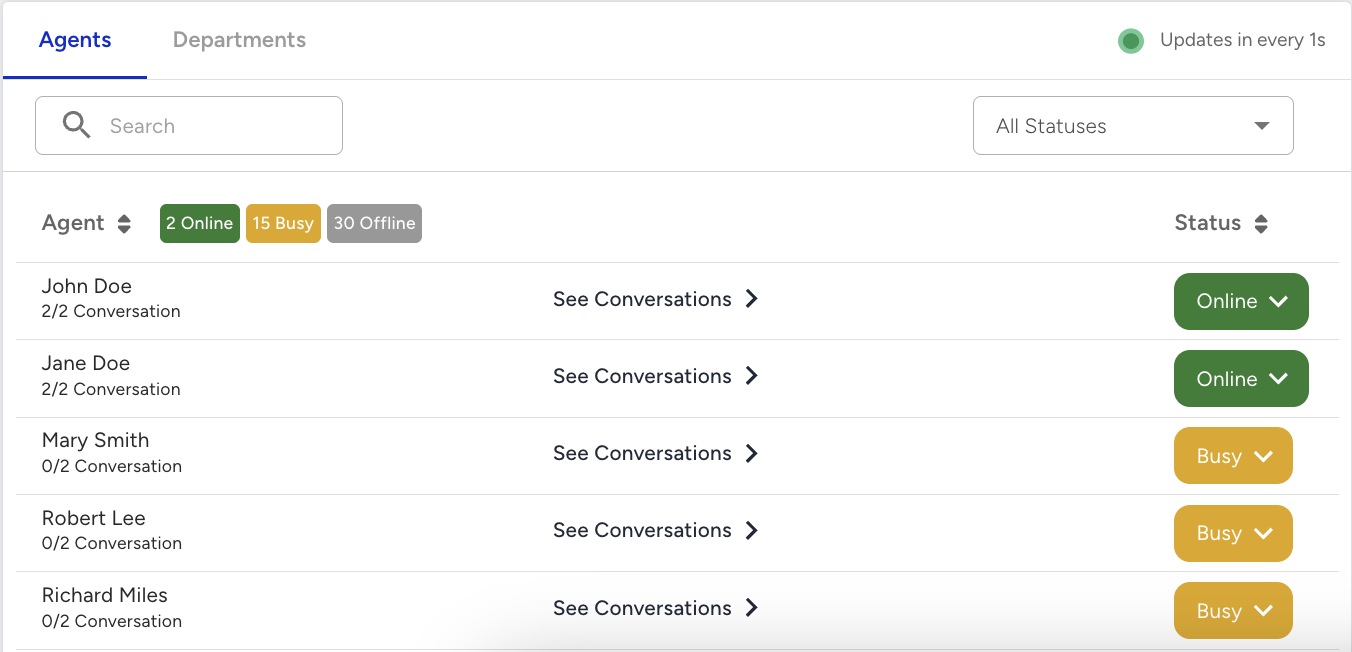
Agents
In the Agents tab, you can track your team’s availability and workload at a glance.
At the top, you’ll see status counters showing how many agents are Online (green), Busy (orange), or Offline (grey).
Each agent’s row displays:
Their status icon (green, orange, or grey).
Their status label (e.g., Online, Lunch, Offline).
Their assigned conversations versus the limit (e.g., 1/4).
Use the Filter List button to narrow down the list.
Click the Redirect button next to an agent to open their profile page.
This way, you can quickly see who’s available, who’s at capacity, and where to direct new conversations.
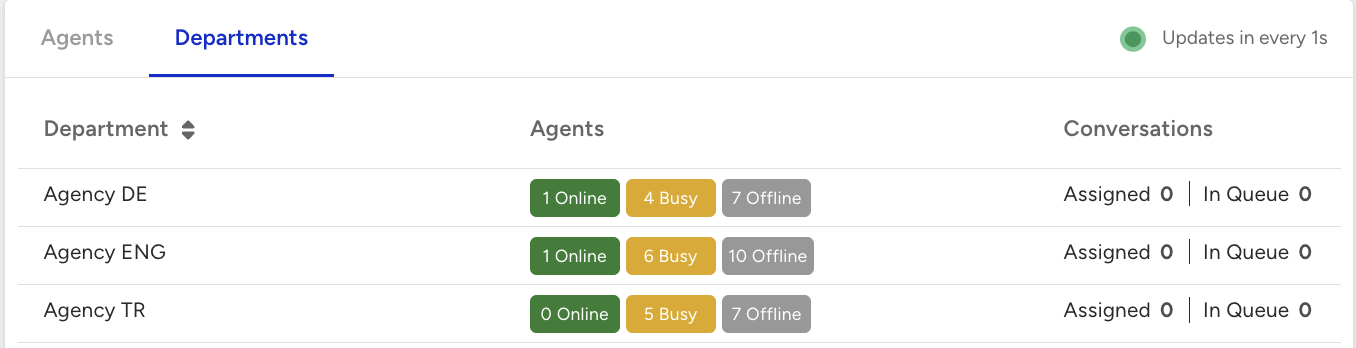
Departments
The Departments tab provides a quick overview of team performance and workload across various departments.
Each row represents a department (e.g., WhatsApp Live, Webchat Live, Support).
Under Agents, you’ll see the number of agents by status: Online (green), Busy (orange), or Offline (grey).
Under Conversations, you’ll see:
Assigned: Shows how many conversations are currently being handled by agents in that department.
In Queue: Shows how many conversations are waiting to be picked up.
This helps you quickly check which departments are staffed and active, how many conversations are already being handled, and whether customers are waiting in the queue.
Conversation & Agent Analytics
Conversation & Agent Analytics helps you understand how your agents and departments perform over time, showing workload, efficiency, and customer satisfaction trends across different date ranges.
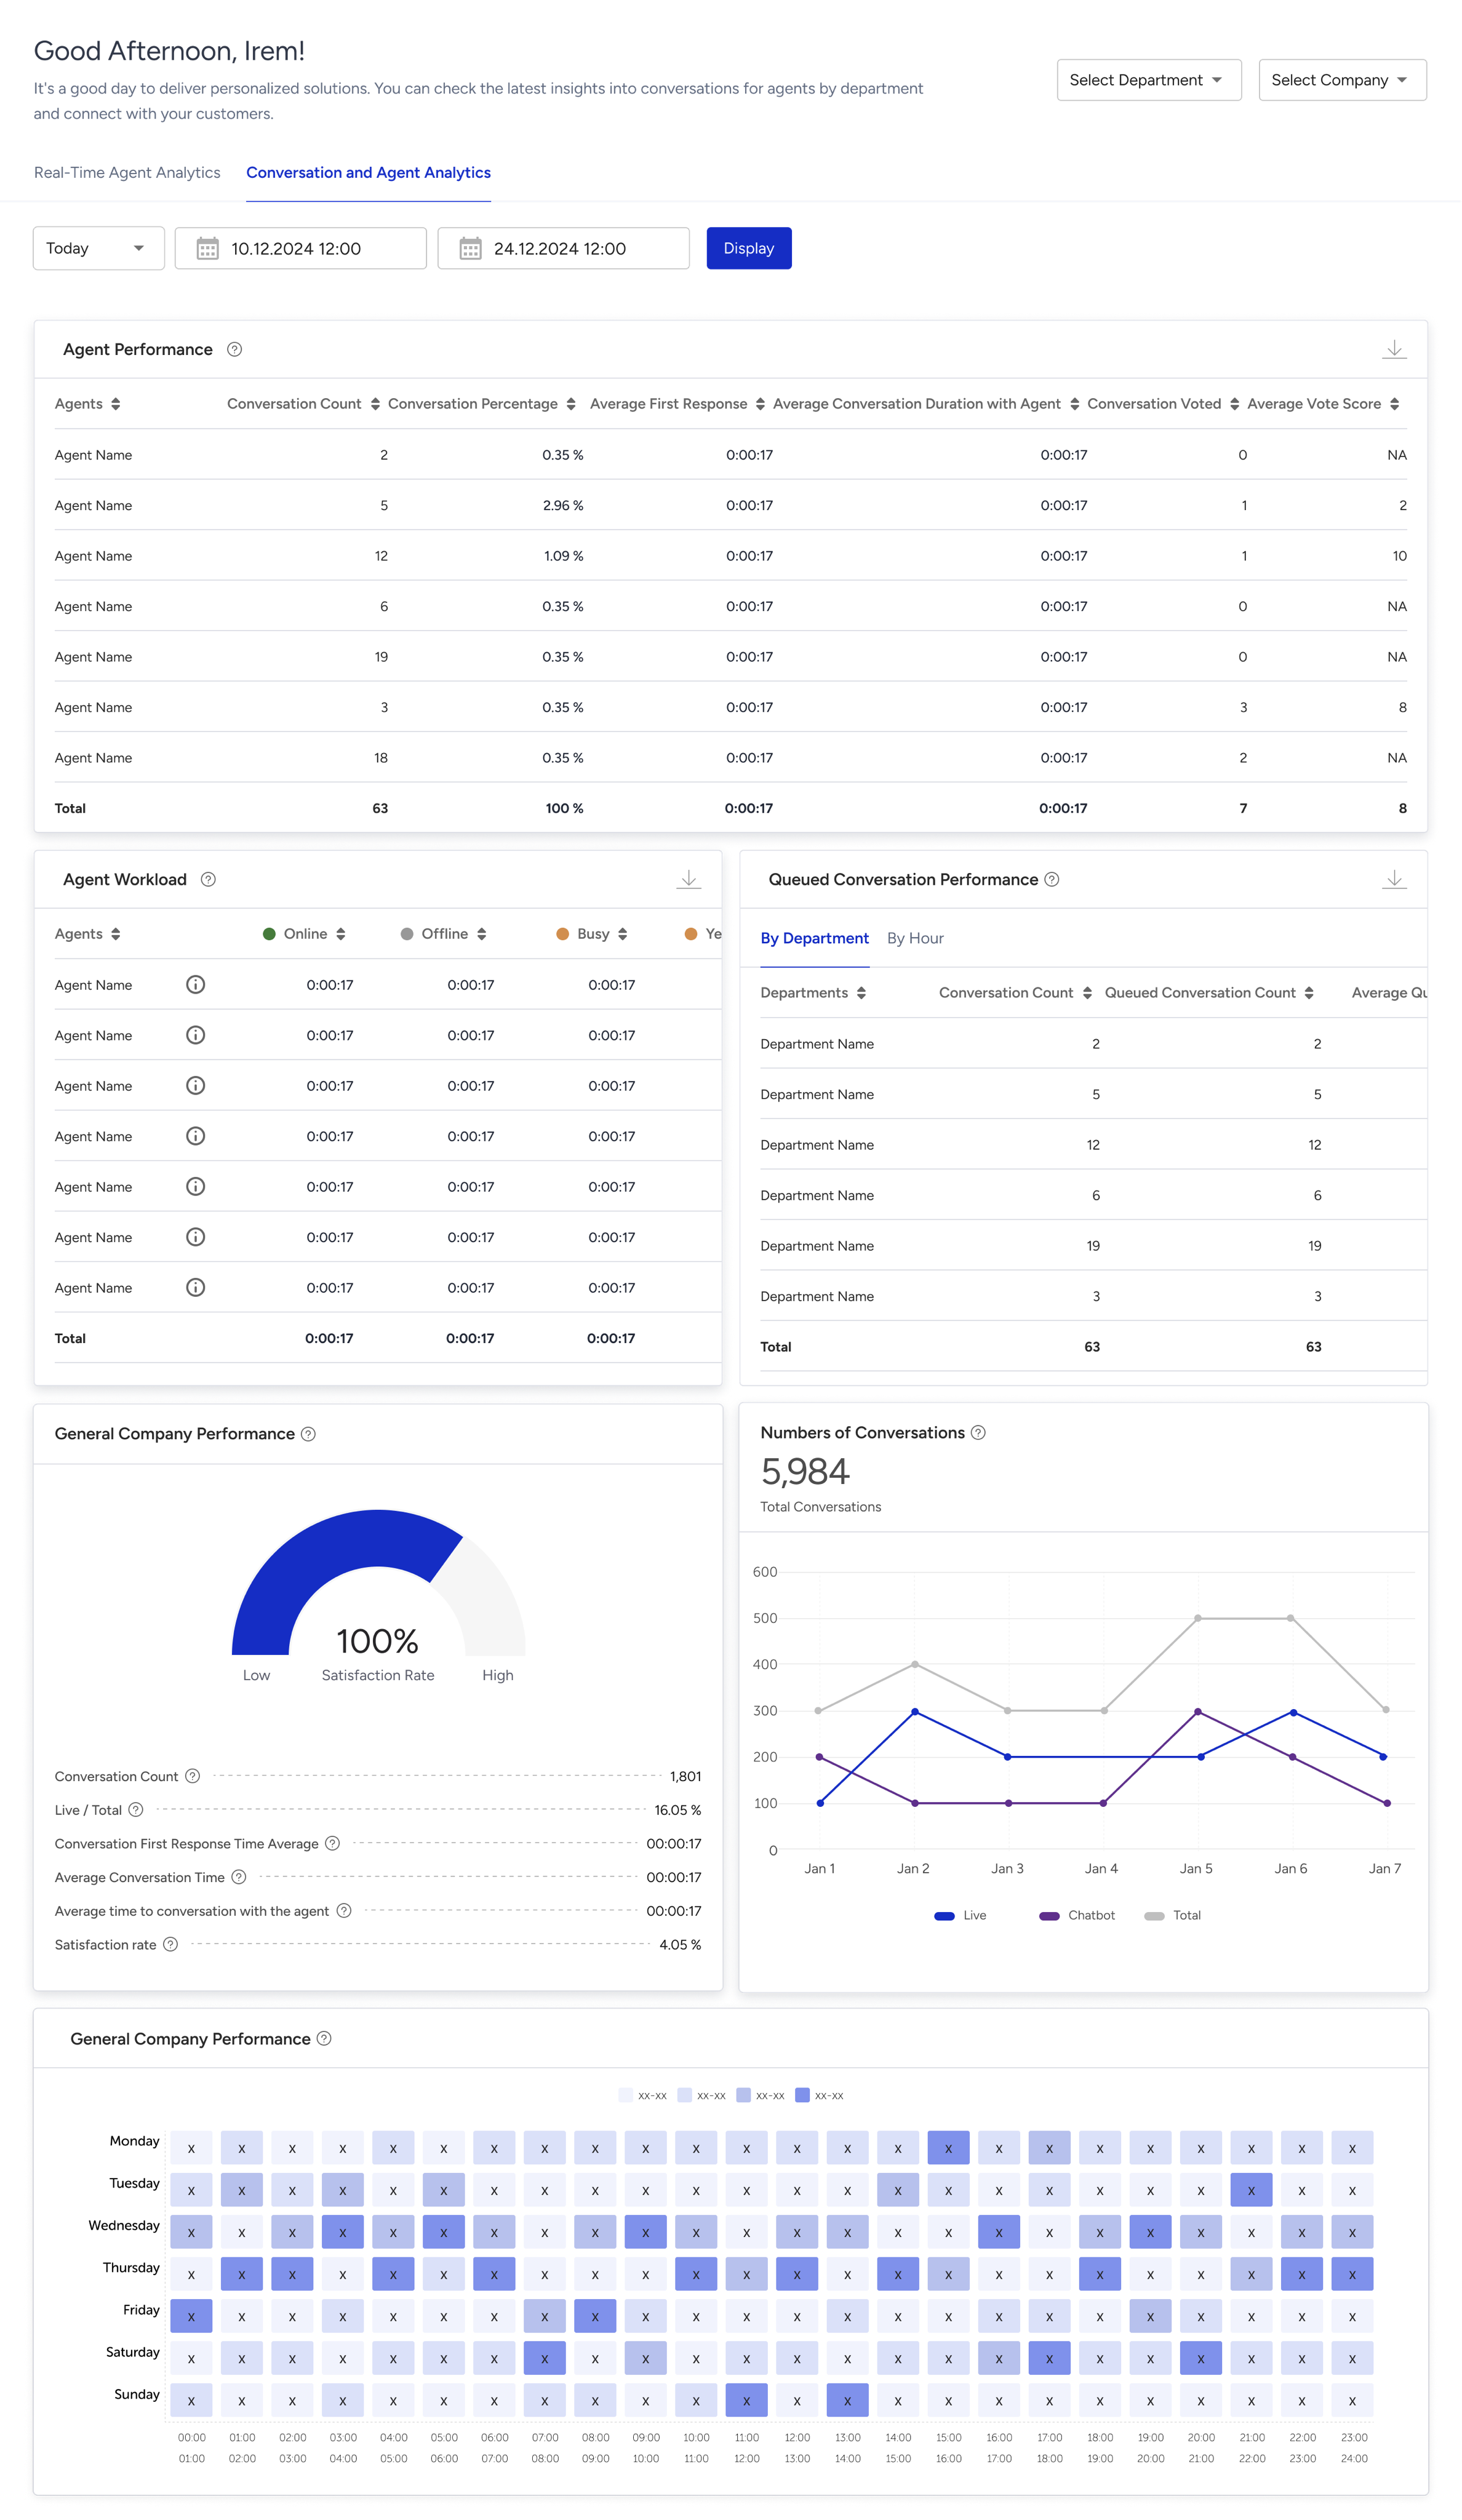
Agent Performance Analysis
This table displays the performance metrics of customer agents.
The descriptions of the data presented in this table are as follows:
Conversation Count: The total number of conversations conducted within the selected date range and departments.
Conversations Percentage (%): The ratio of the number of conversations conducted by the respective agent to the total number of conversations displayed.
Average First Response Time: The average time it took for the agent to give the first response in conversations.
Average Agent Handle Time: The average time the agent spent in conversations (excluding chatbot and queue waiting times).
Customer Ratings: The number of conversations conducted by the agent that were rated by customers is shown in this area.
Customer Satisfaction Score: The average rating score given to the conversations conducted by the agent (shown out of 10).
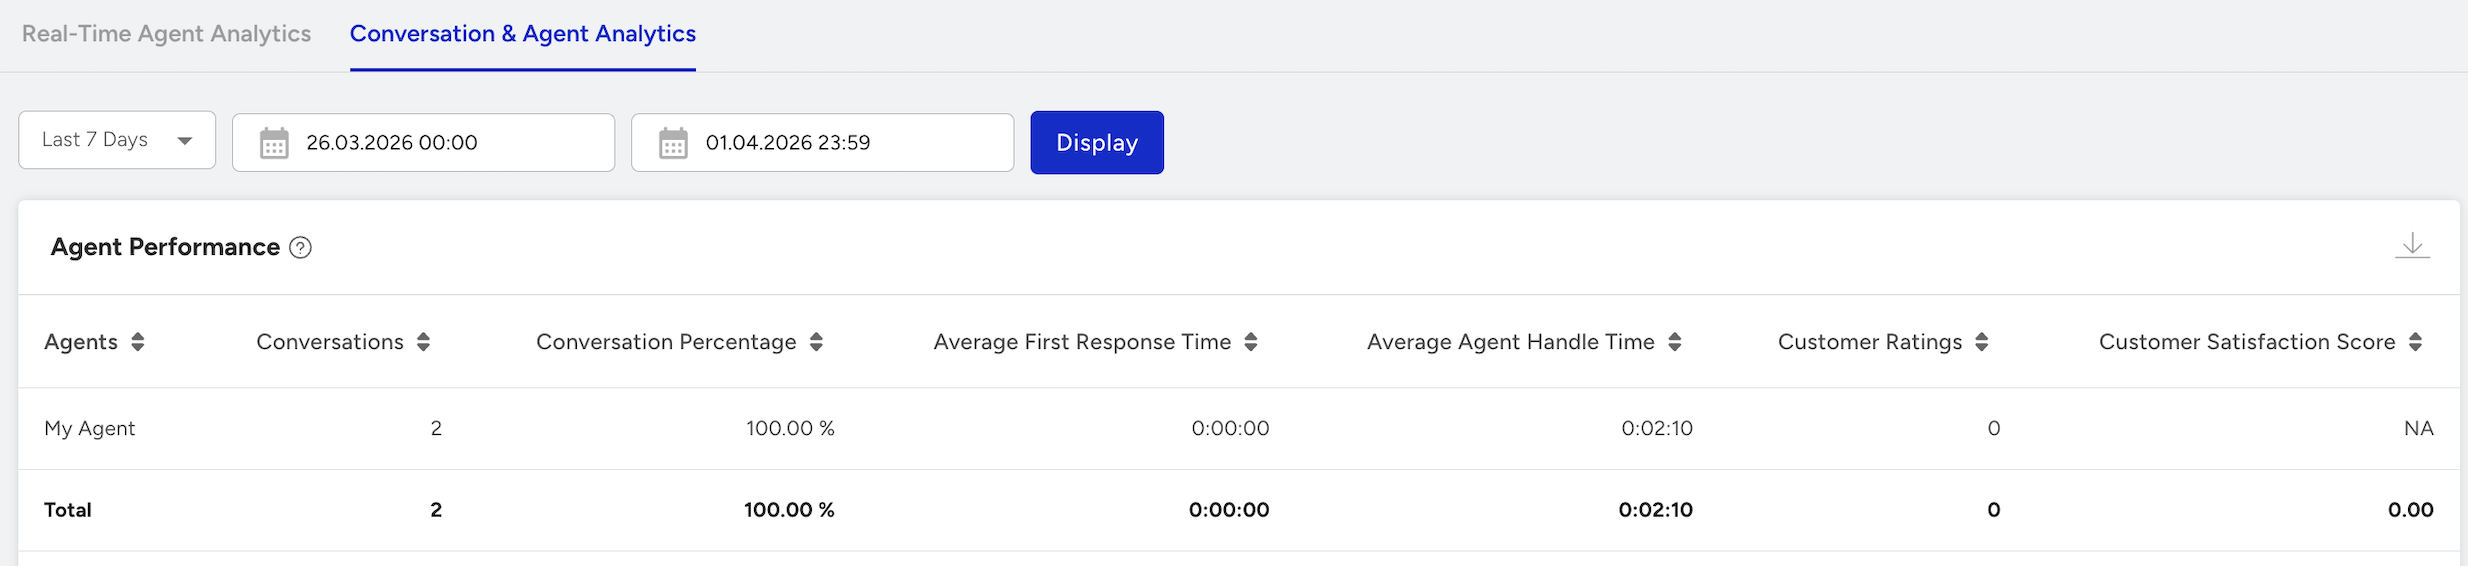
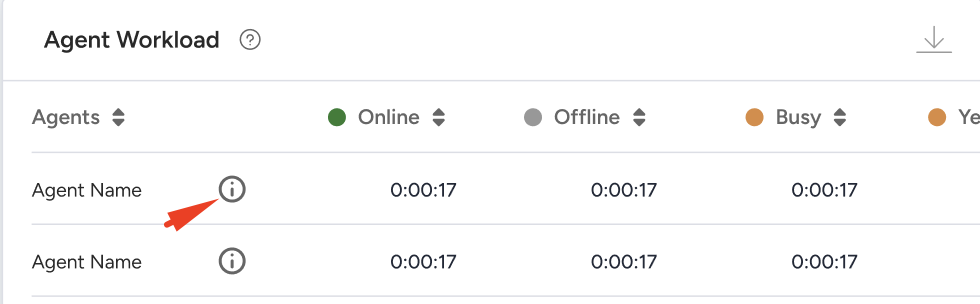
Agent Workload Analysis
This area displays the total time customer representatives have spent in various statuses within the selected date range. These statuses include Online, Busy, Offline, and any custom statuses you create for representatives.
Click the Info button next to an agent's name to view detailed status changes for that representative.
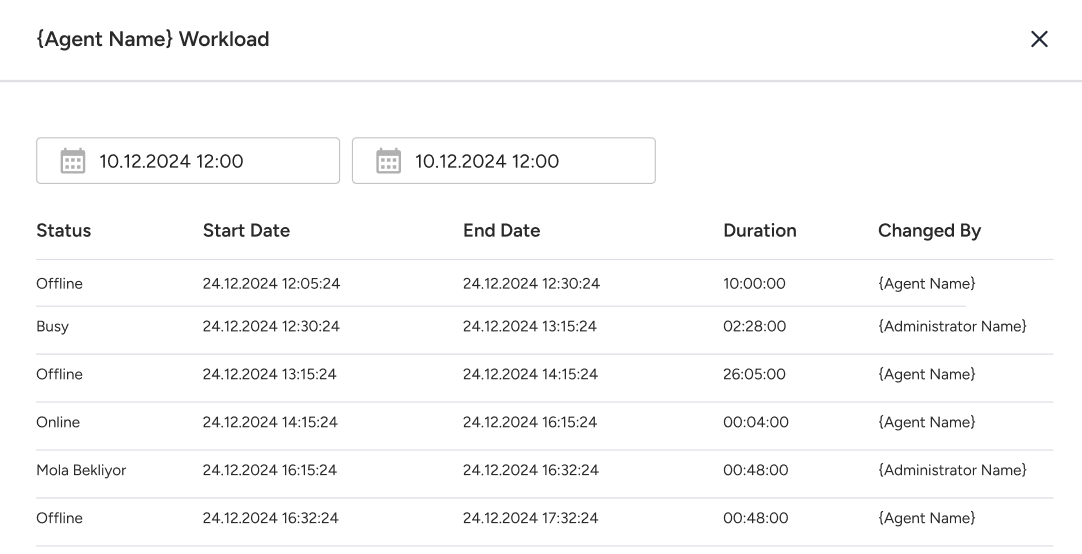
You can click the Export button in the top-right corner to download the report in Excel format. 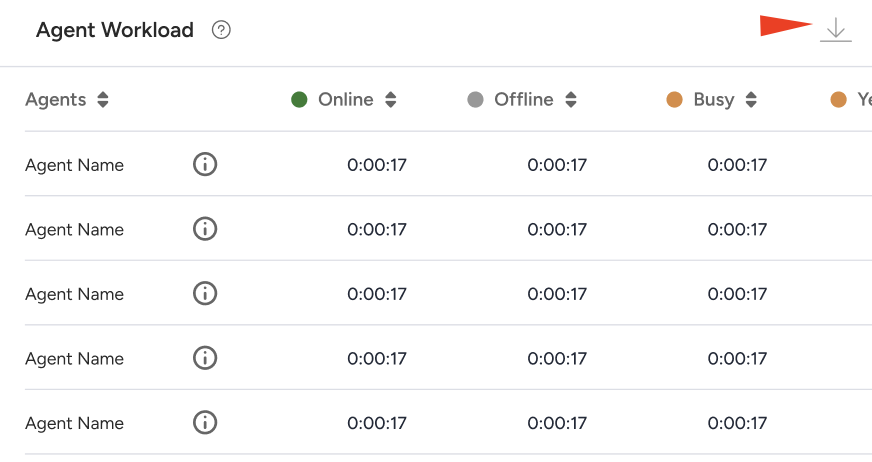
Calculation method: The status change logs for each agent are retrieved from the database based on the selected date range and department filter. The time spent between two statuses is calculated for each agent, and the total time spent in each status is aggregated and displayed on the front end.
If the agent did not make any status changes within the specified date range, it cannot be displayed on the front end.
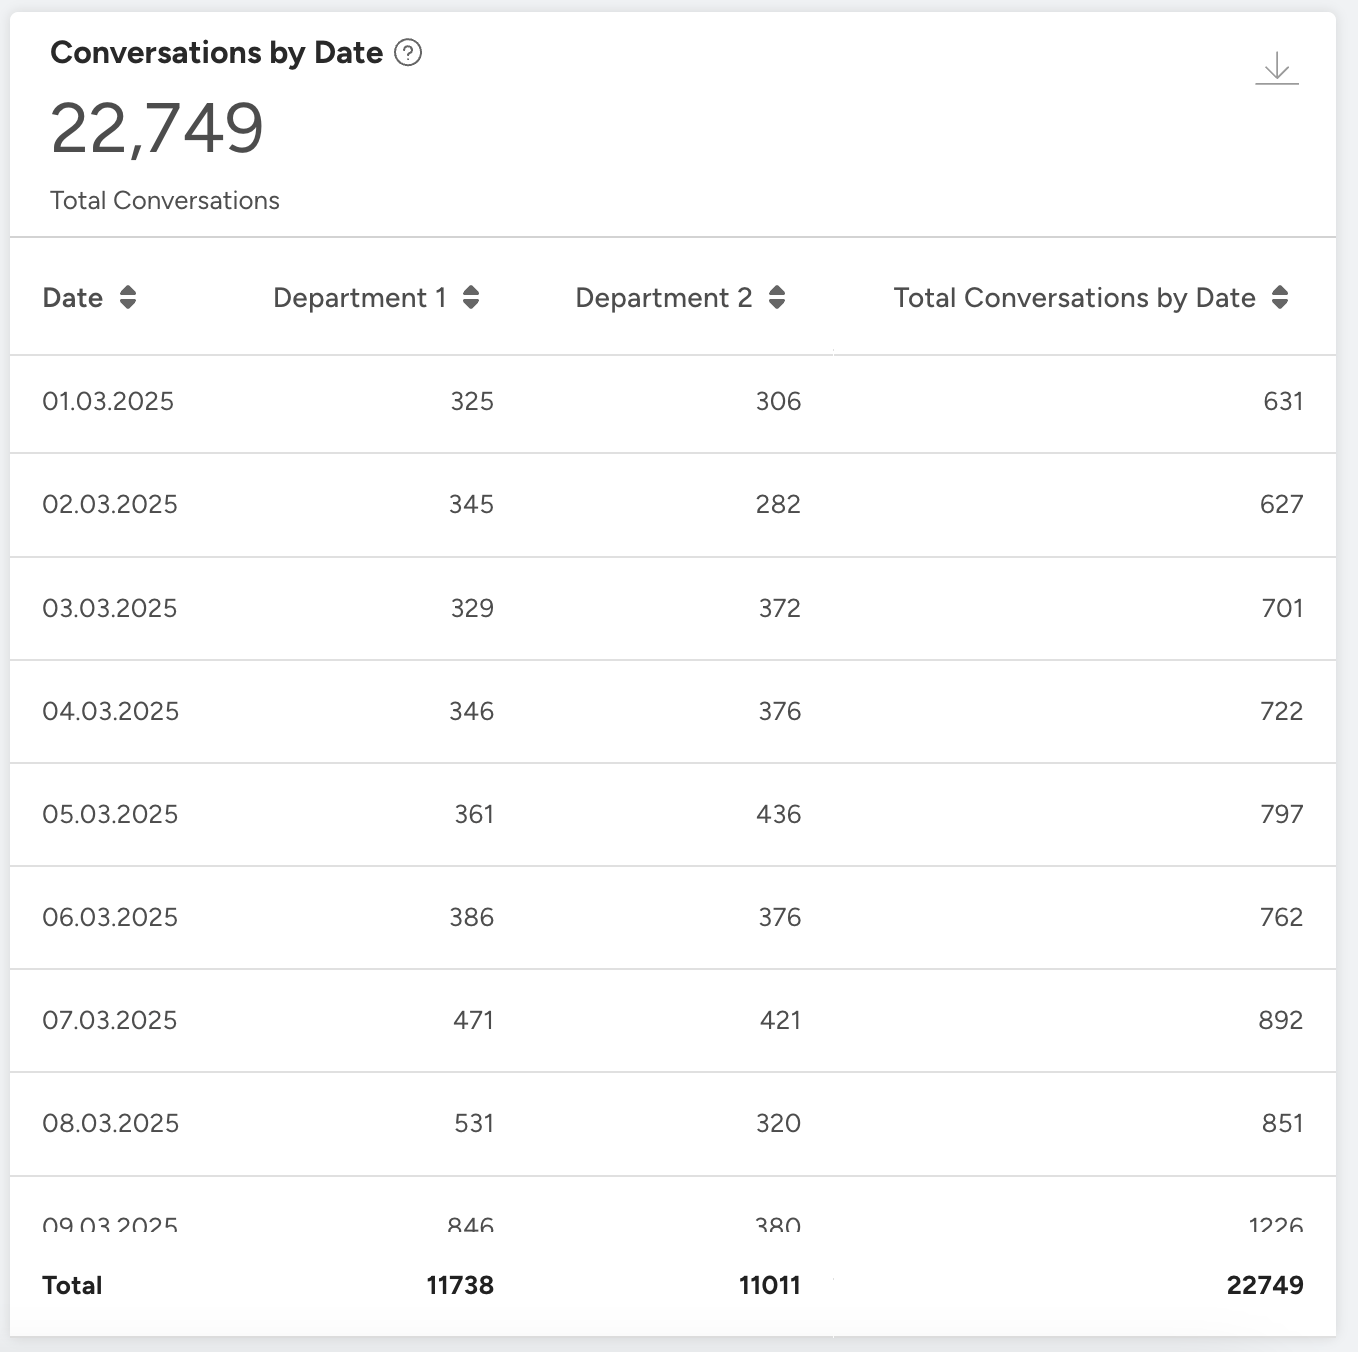
Conversations by Date
Conversations by Date provides a daily breakdown of the total conversations within the selected date range.
Each row shows the number of conversations handled by each department on a given date, along with the daily total.
At the bottom of the table, you can see the overall totals for each department and the grand total of conversations for the selected period.
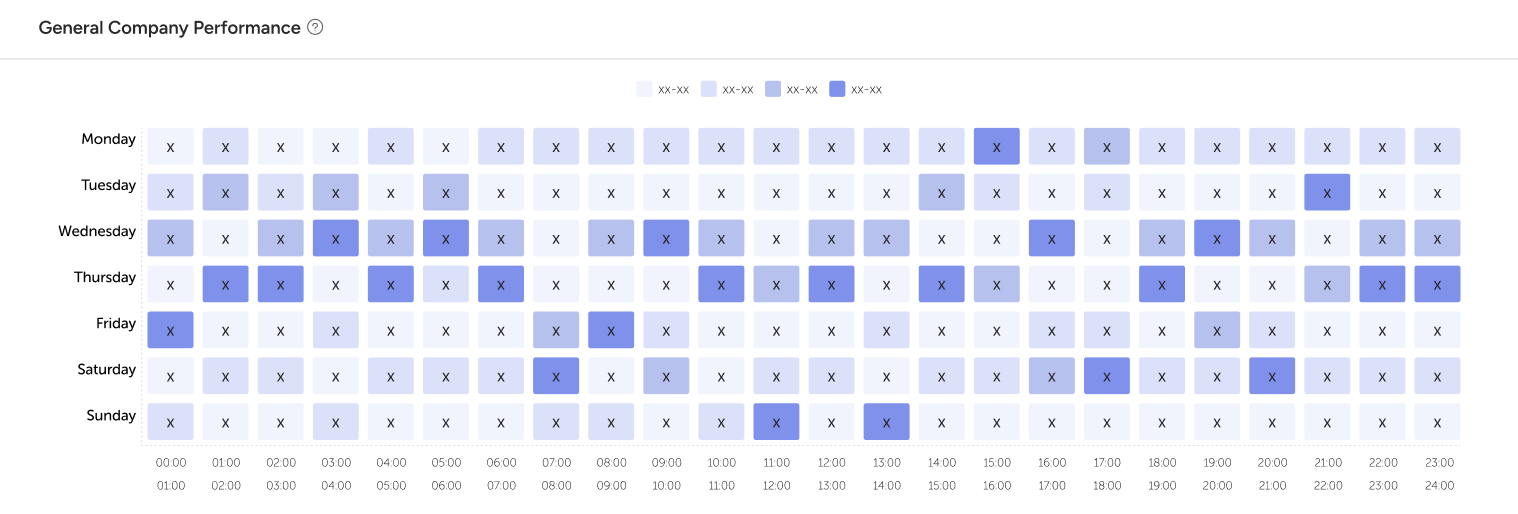
General Company Performance (Heat Chart)
This table displays all conversations conducted within the selected date range as a heat map, broken down into hourly intervals. Unless a filter is applied, chatbot conversations are also included in the table.