Catalog Insights helps you see how your catalog products are performing. On the Catalog Manager page, a catalog summary gives you the overall picture, and the Catalog Insights drawer holds five insights that highlight products worth a closer look.
Why Catalog Insights matter
Catalog Manager tells you how many products you have, how many are in stock, how many are out of stock, and how many are passive. Those numbers describe the shape of your catalog.
Catalog Insights answers these five questions for you once a day and lists the products behind each answer in priority order:
Which in-stock products are not selling for some period of time?
Which products do shoppers add to their cart and then abandon?
Which products are about to run out?
Which out-of-stock products are people looking for?
Which sizes or colors are people trying to buy but out of stock?
To access Catalog Insights, navigate to Components > Product Catalog Manager > Catalog Manager. Select the locale, currency, and time range you want to review.
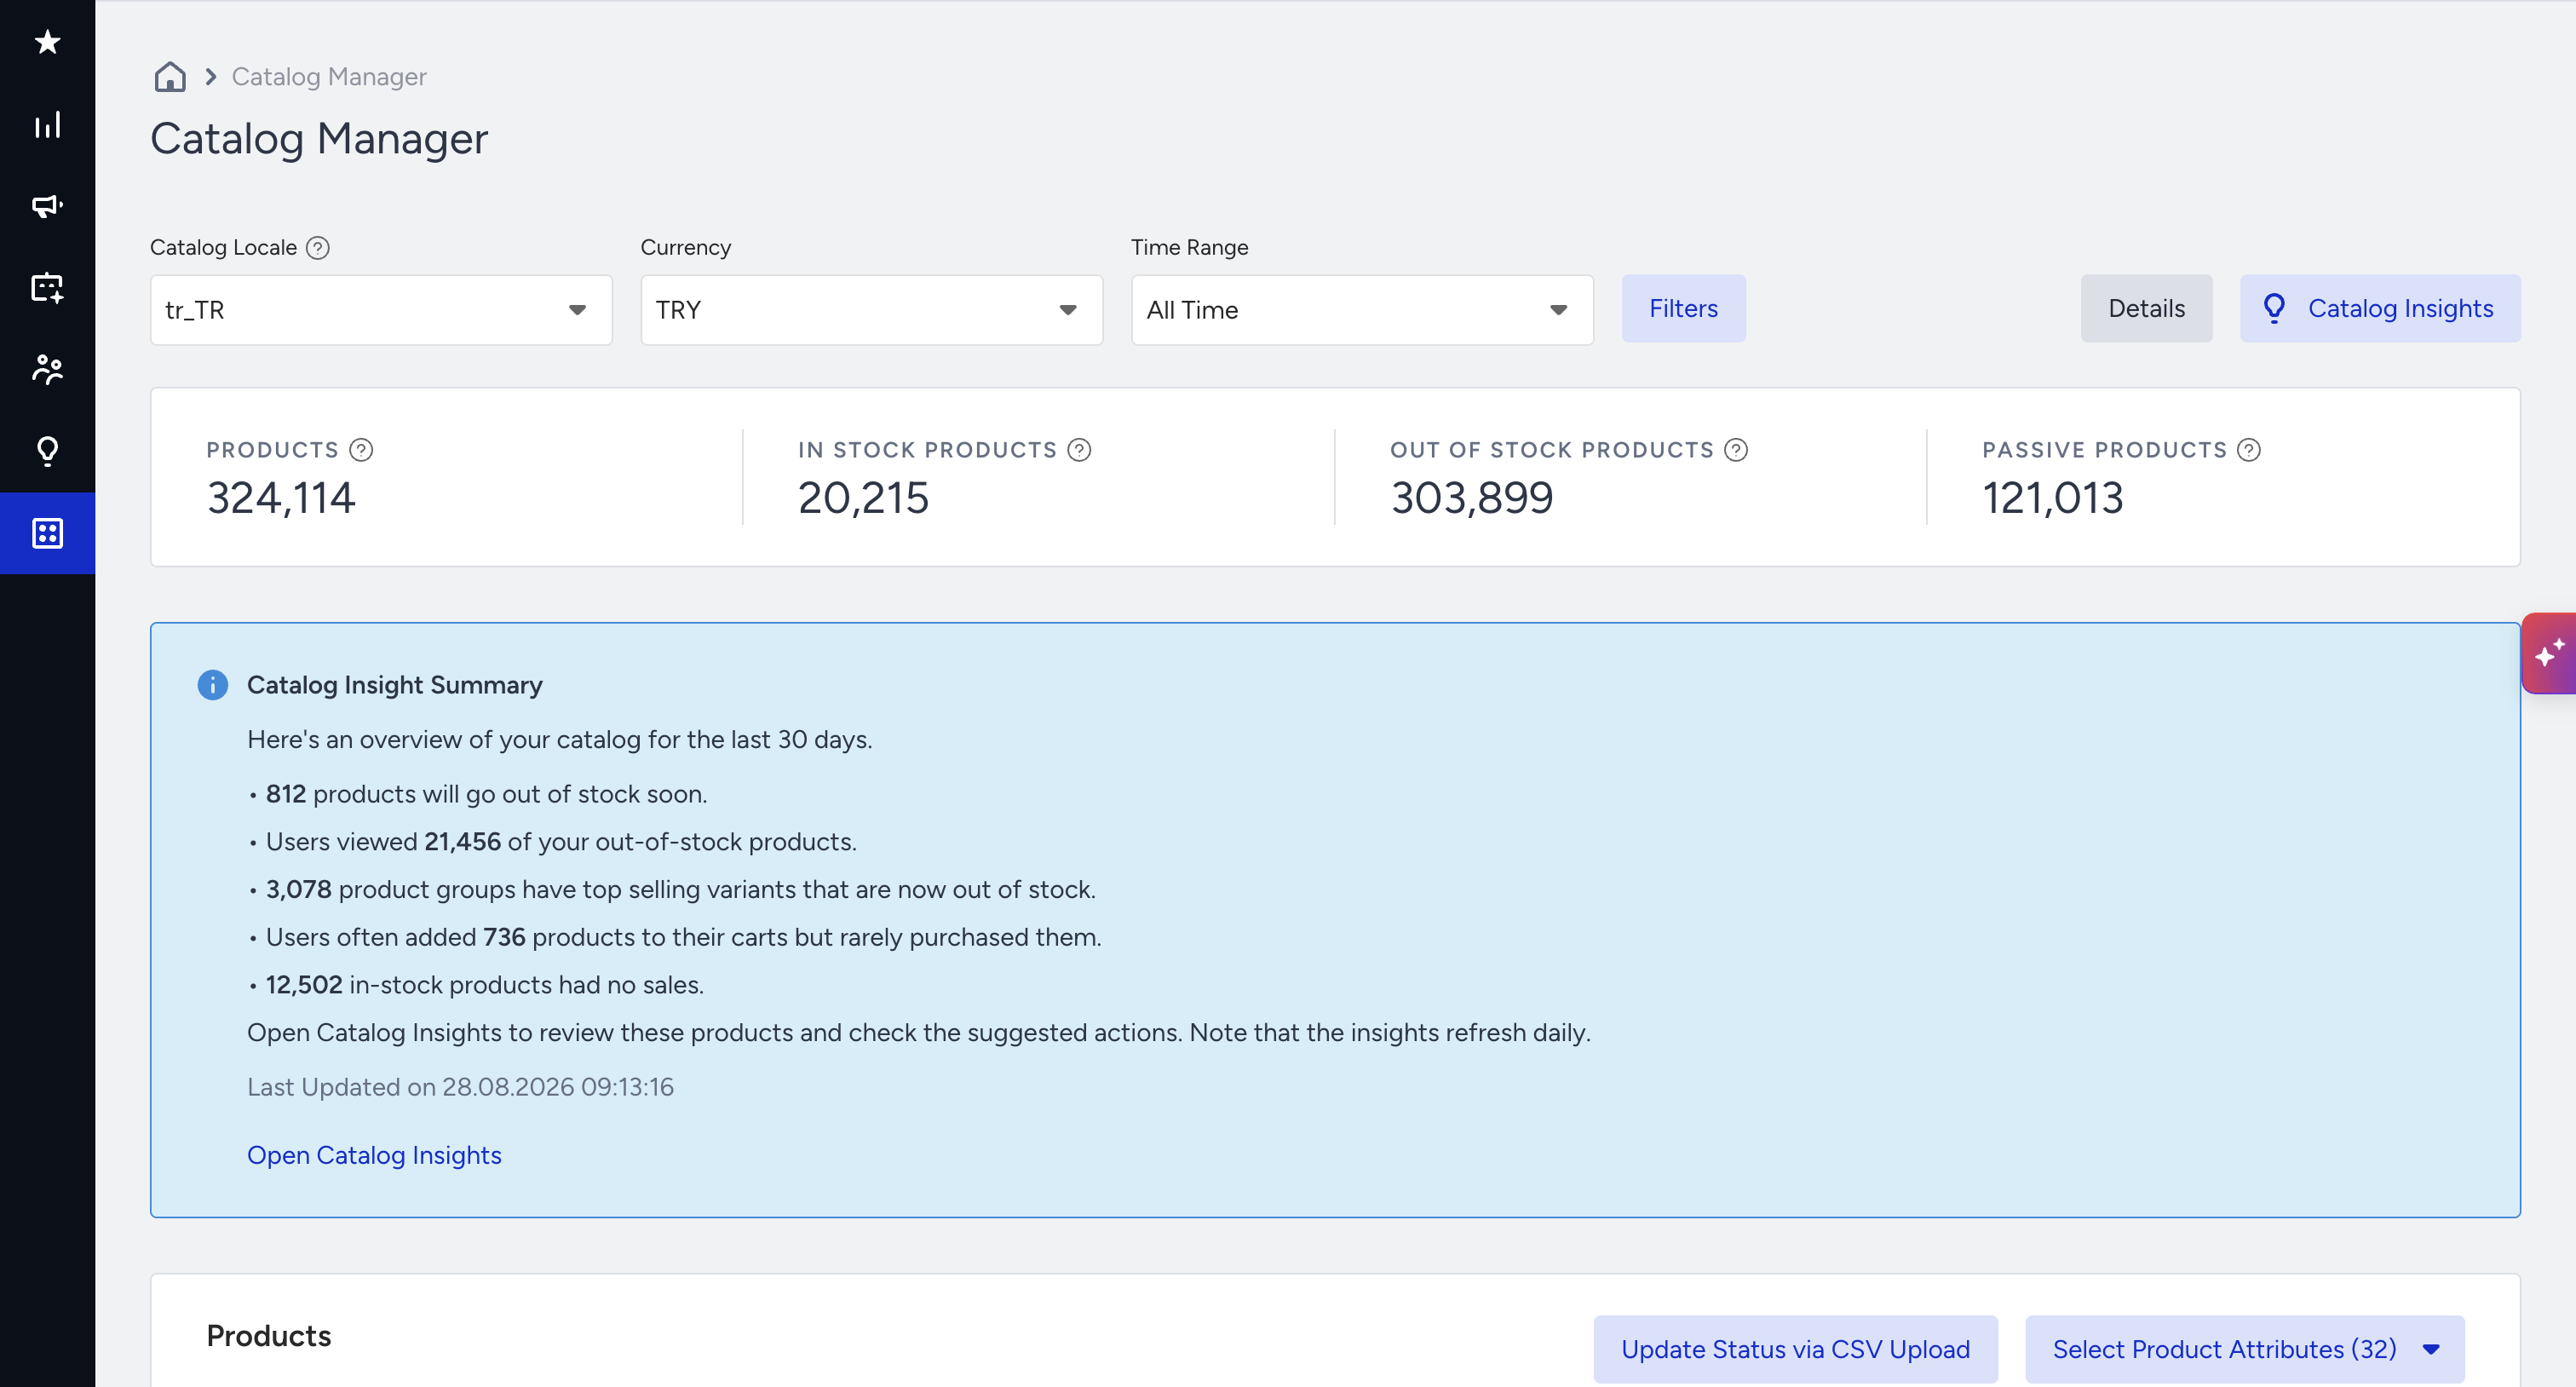
Below the metric cards, the catalog summary gives you a general overview of the insights found in your catalog. To see the details, click Catalog Insights to open the insights drawer.
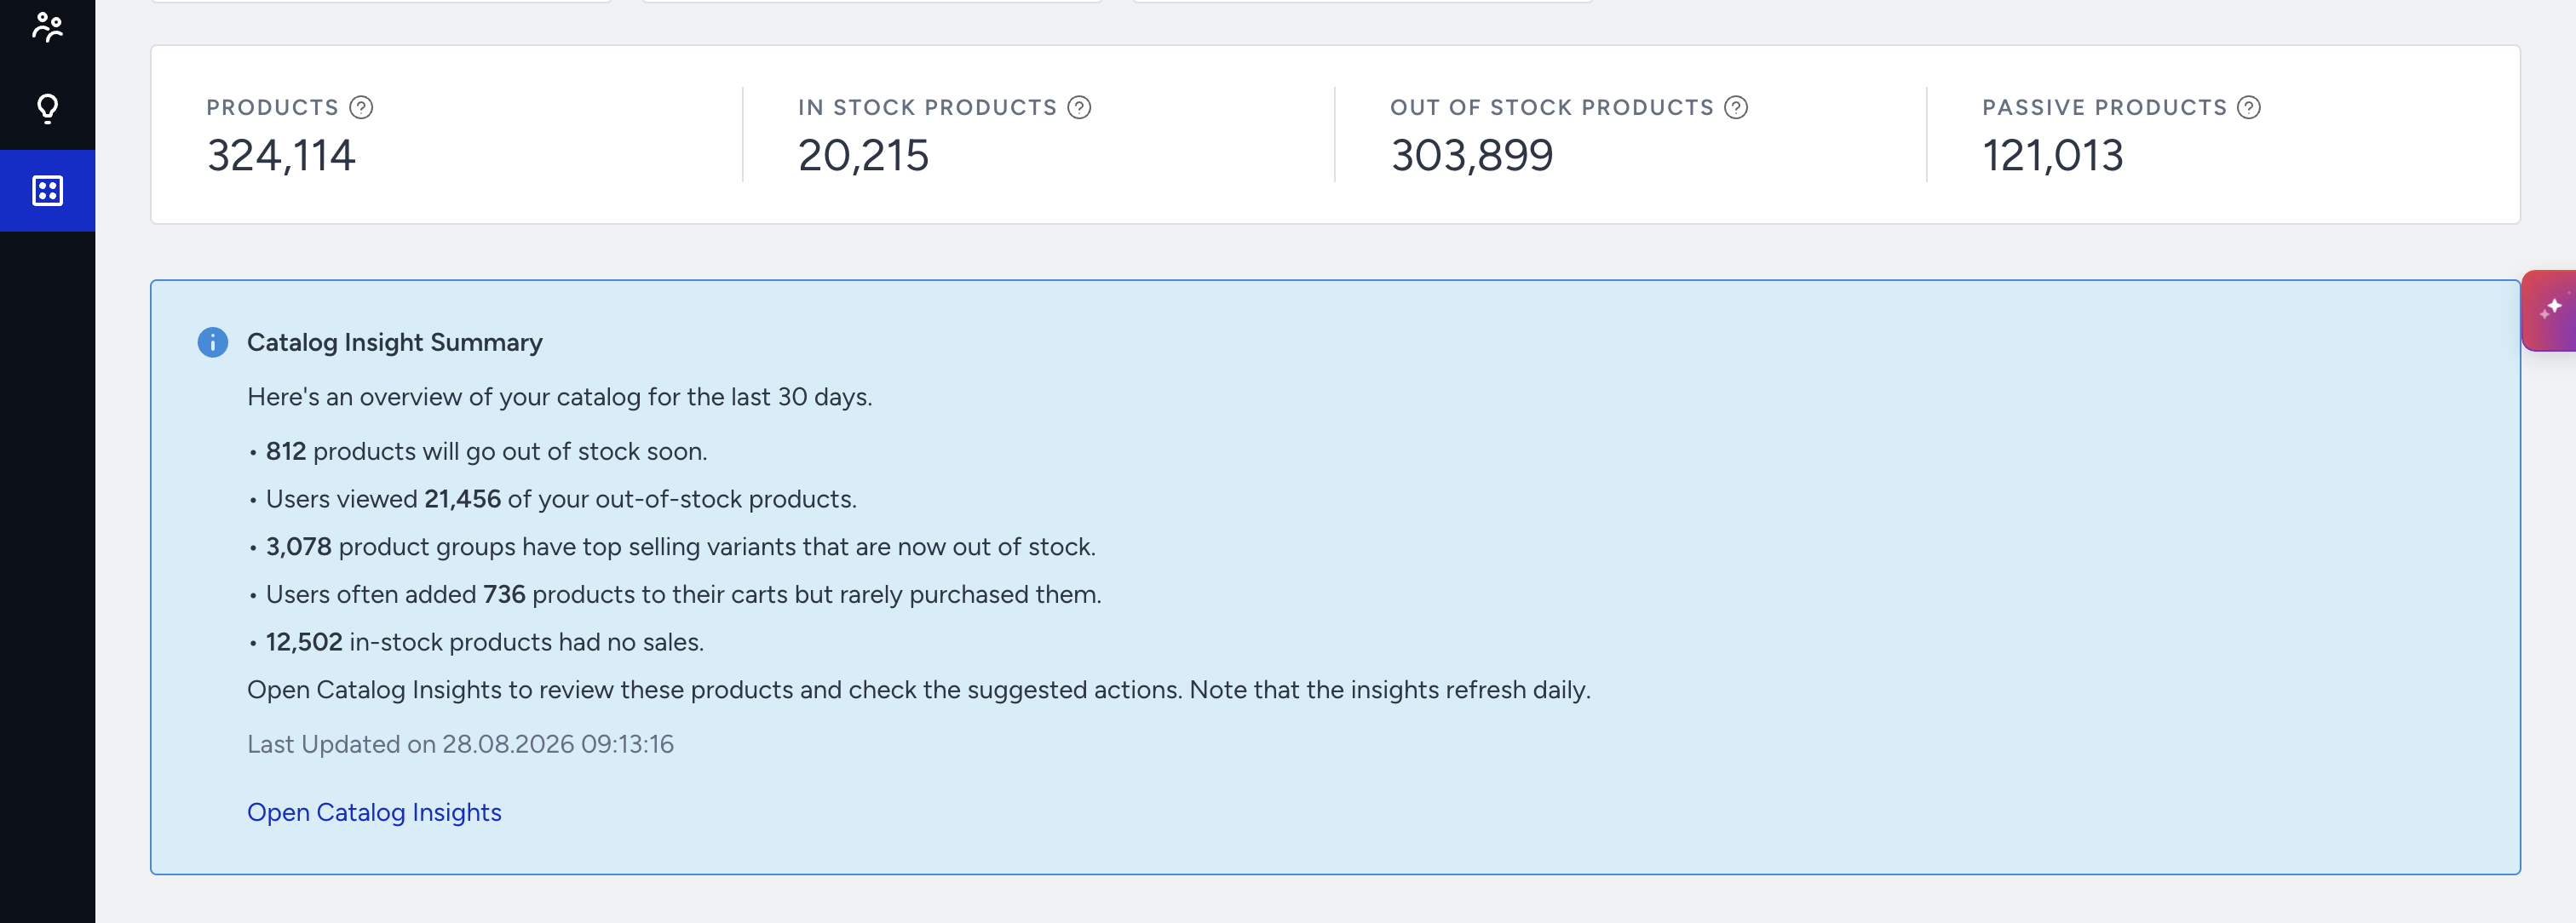
The Catalog Insights
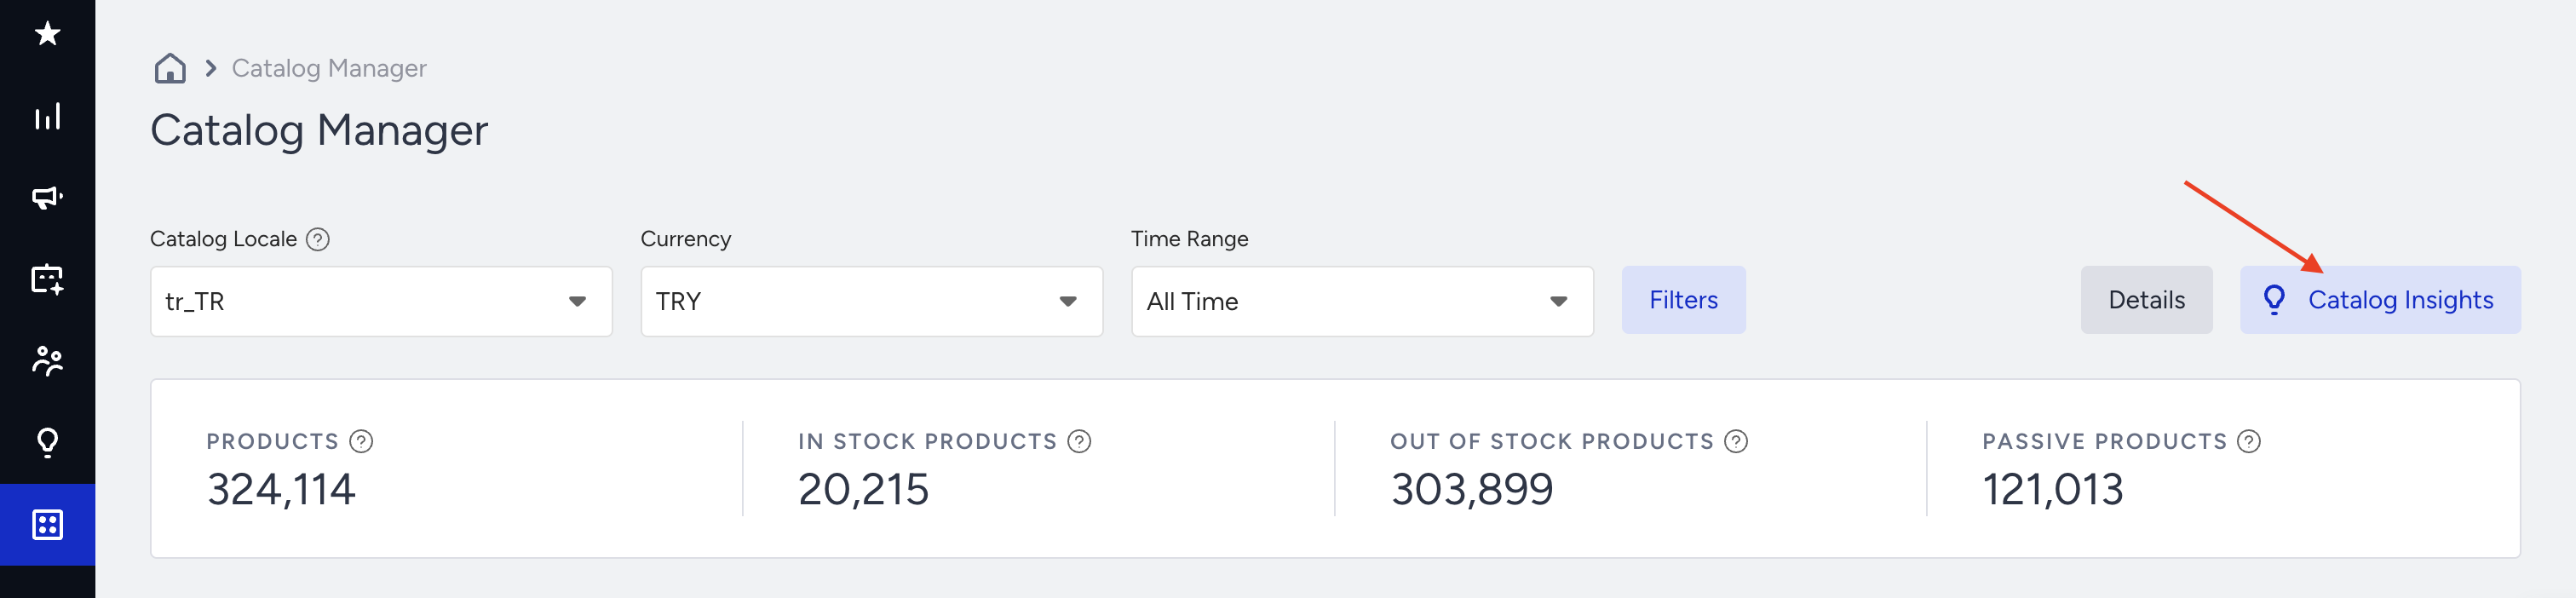
Click the Catalog Insights button to open the insights drawer on the right side of the page.
The drawer has its own time range selector, separate from the time range filter on the Catalog Manager page. Available windows are 7, 14, 30, and 90 days.
You can export up to 1,000 products with available insights when you click the Export button.
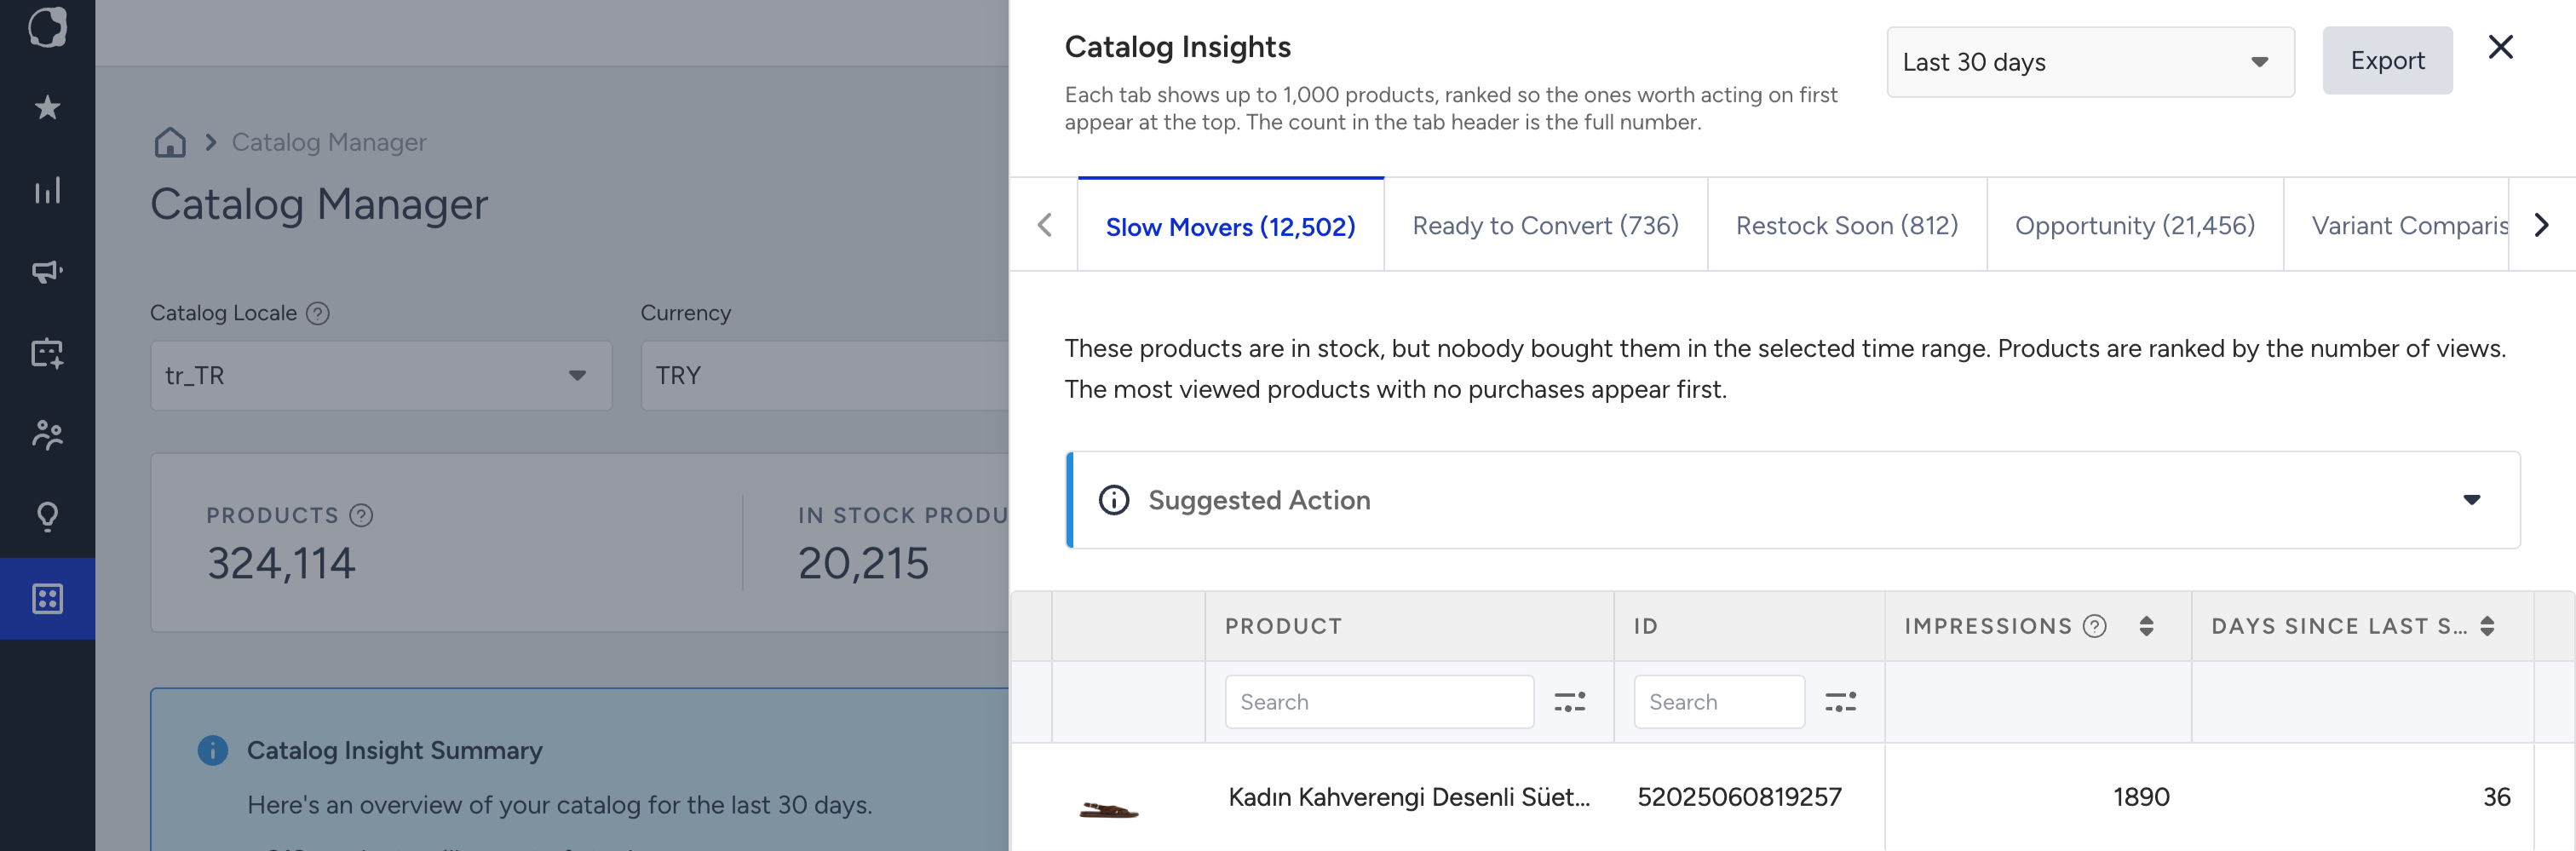
The drawer holds five tabs, one per insight. Each tab carries a count in its header, a short explanation of what the insight means, guidance on what to do about it, and a product list:
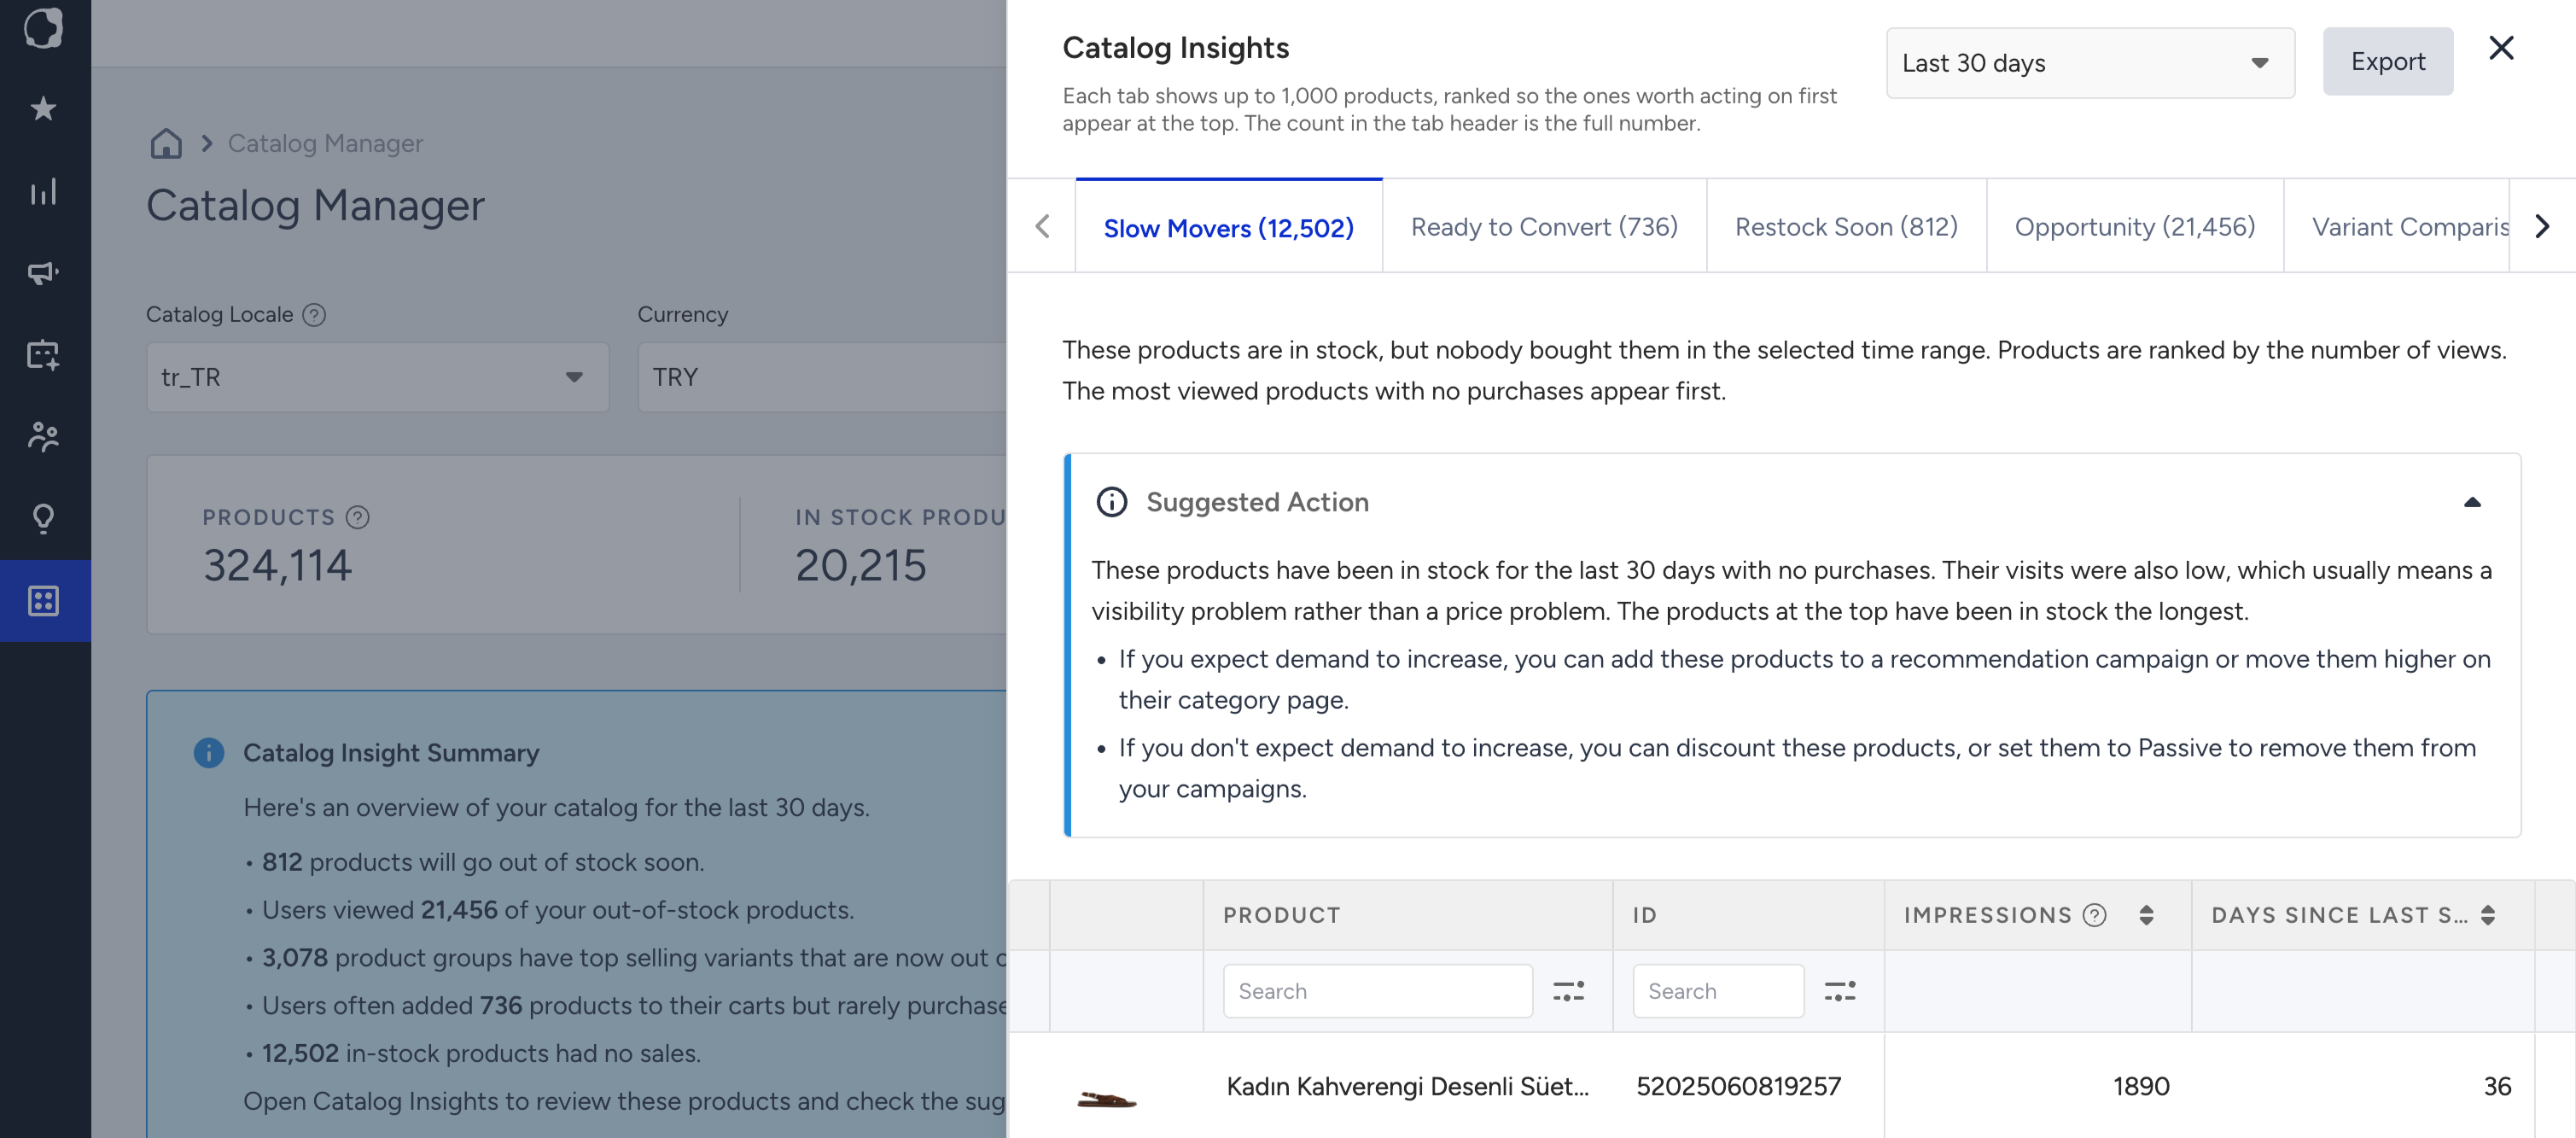
Slow Movers
Products that have been in stock for a while without selling
These are active, in-stock products with no sales in the time range you selected. The product table shows how many days have passed since each product last sold and how many impressions it received, with the most impressions at the top.
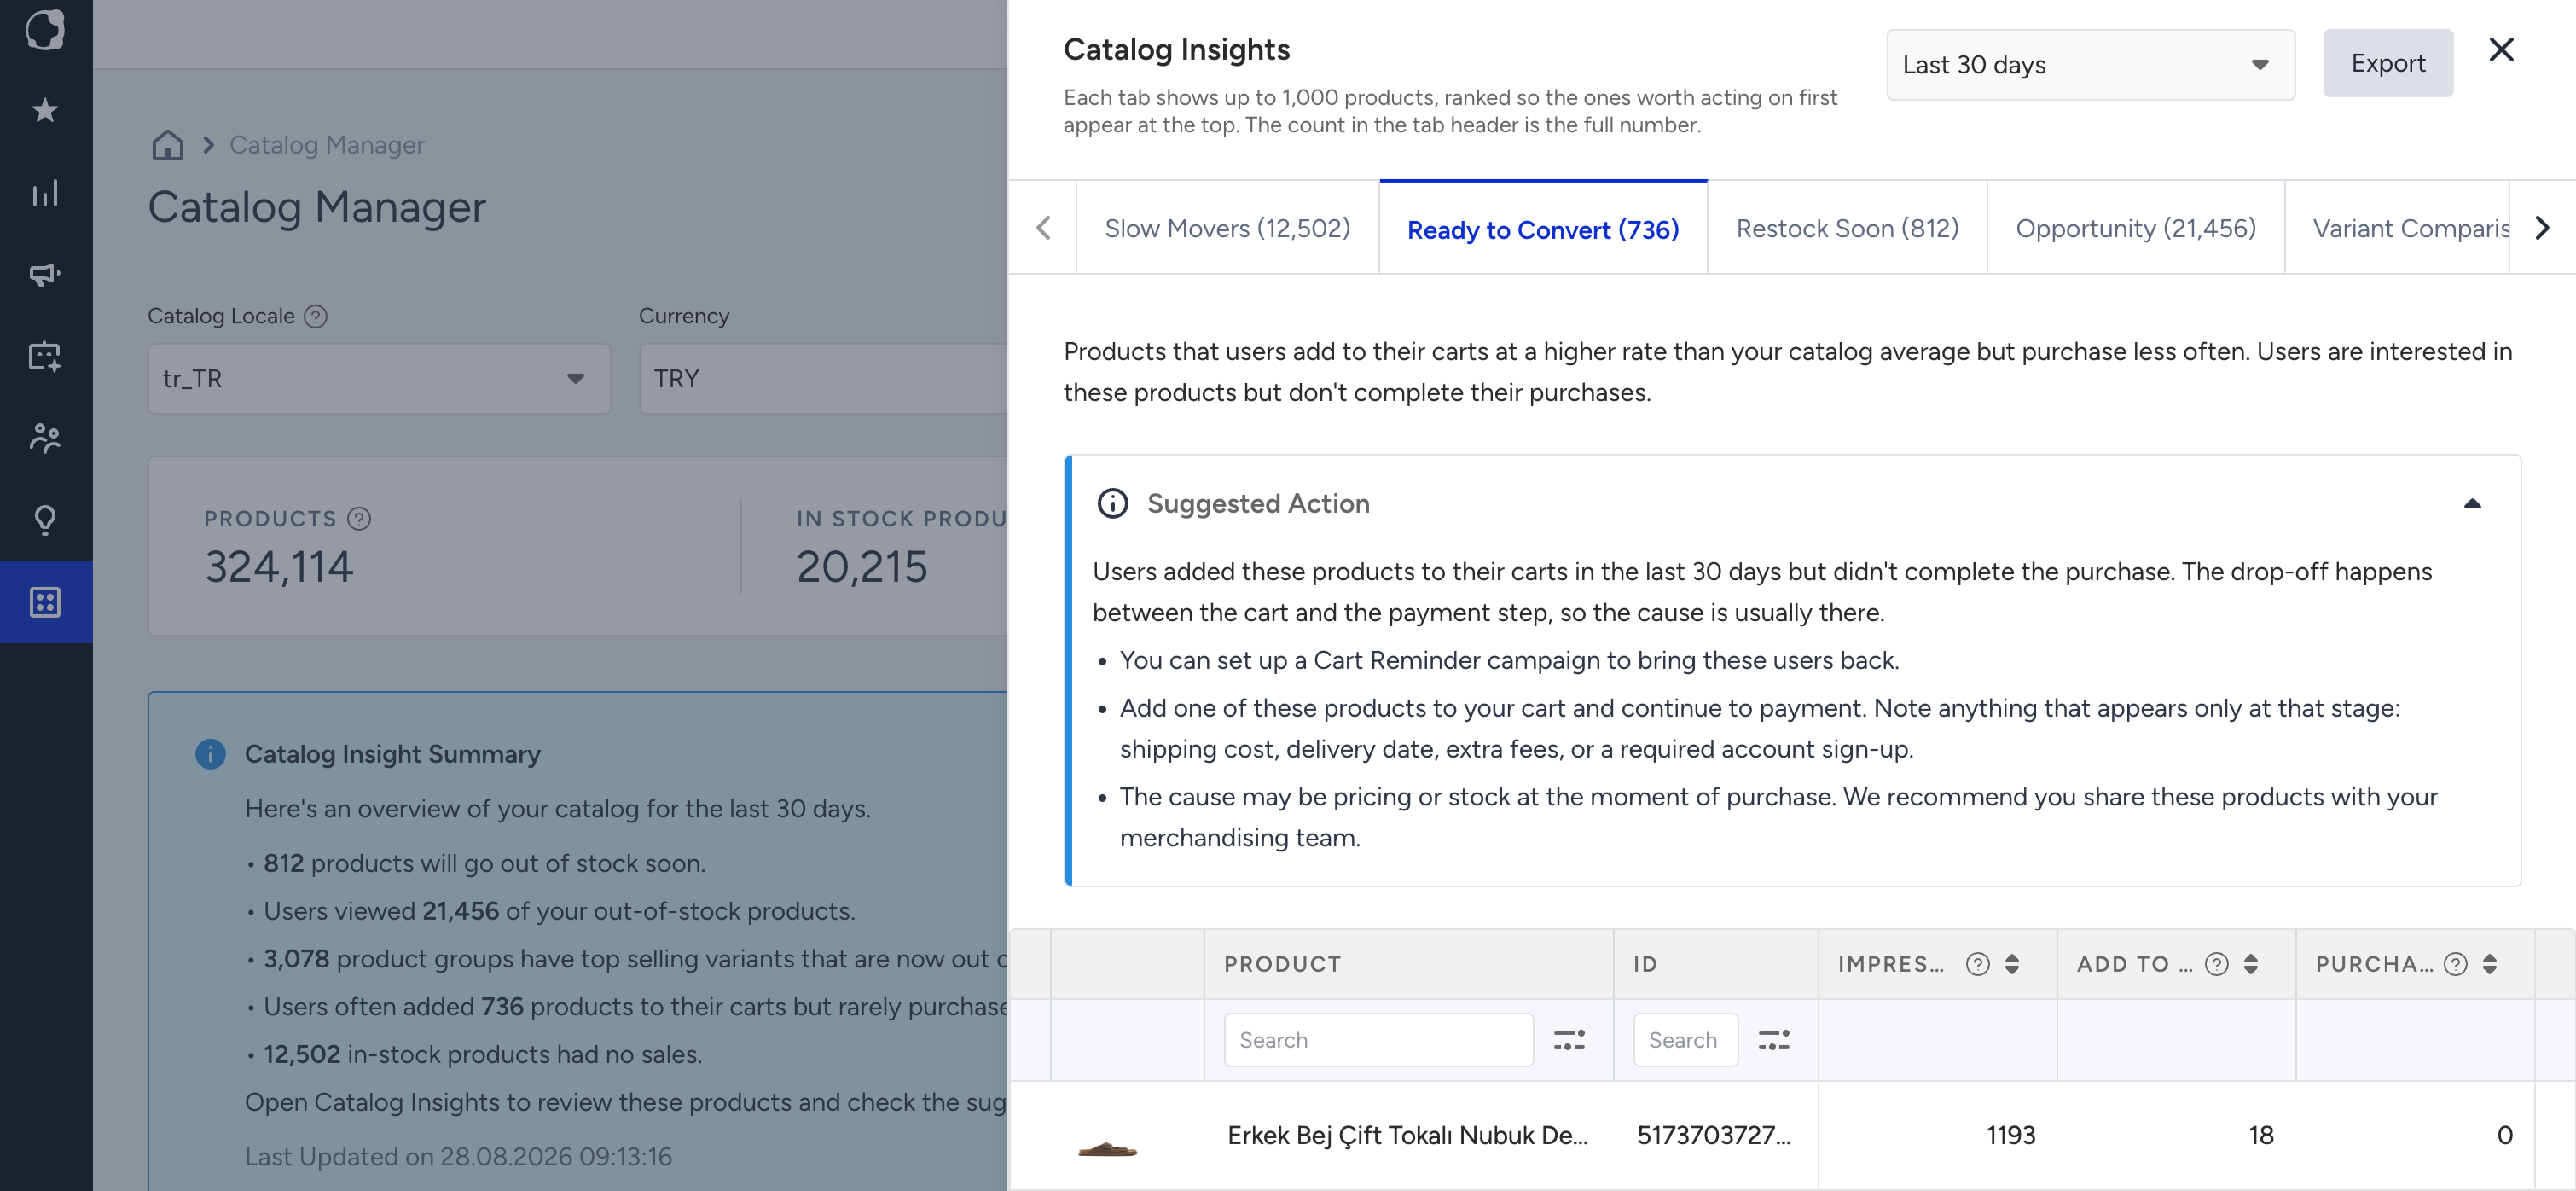
Ready to Convert
Added to cart, but didn't convert to a sale
Products that are added to cart more often than your catalog average, but purchased less often. The comparison is against your own catalog's averages. The product table shows each product's impressions, add-to-cart count, and purchase count.
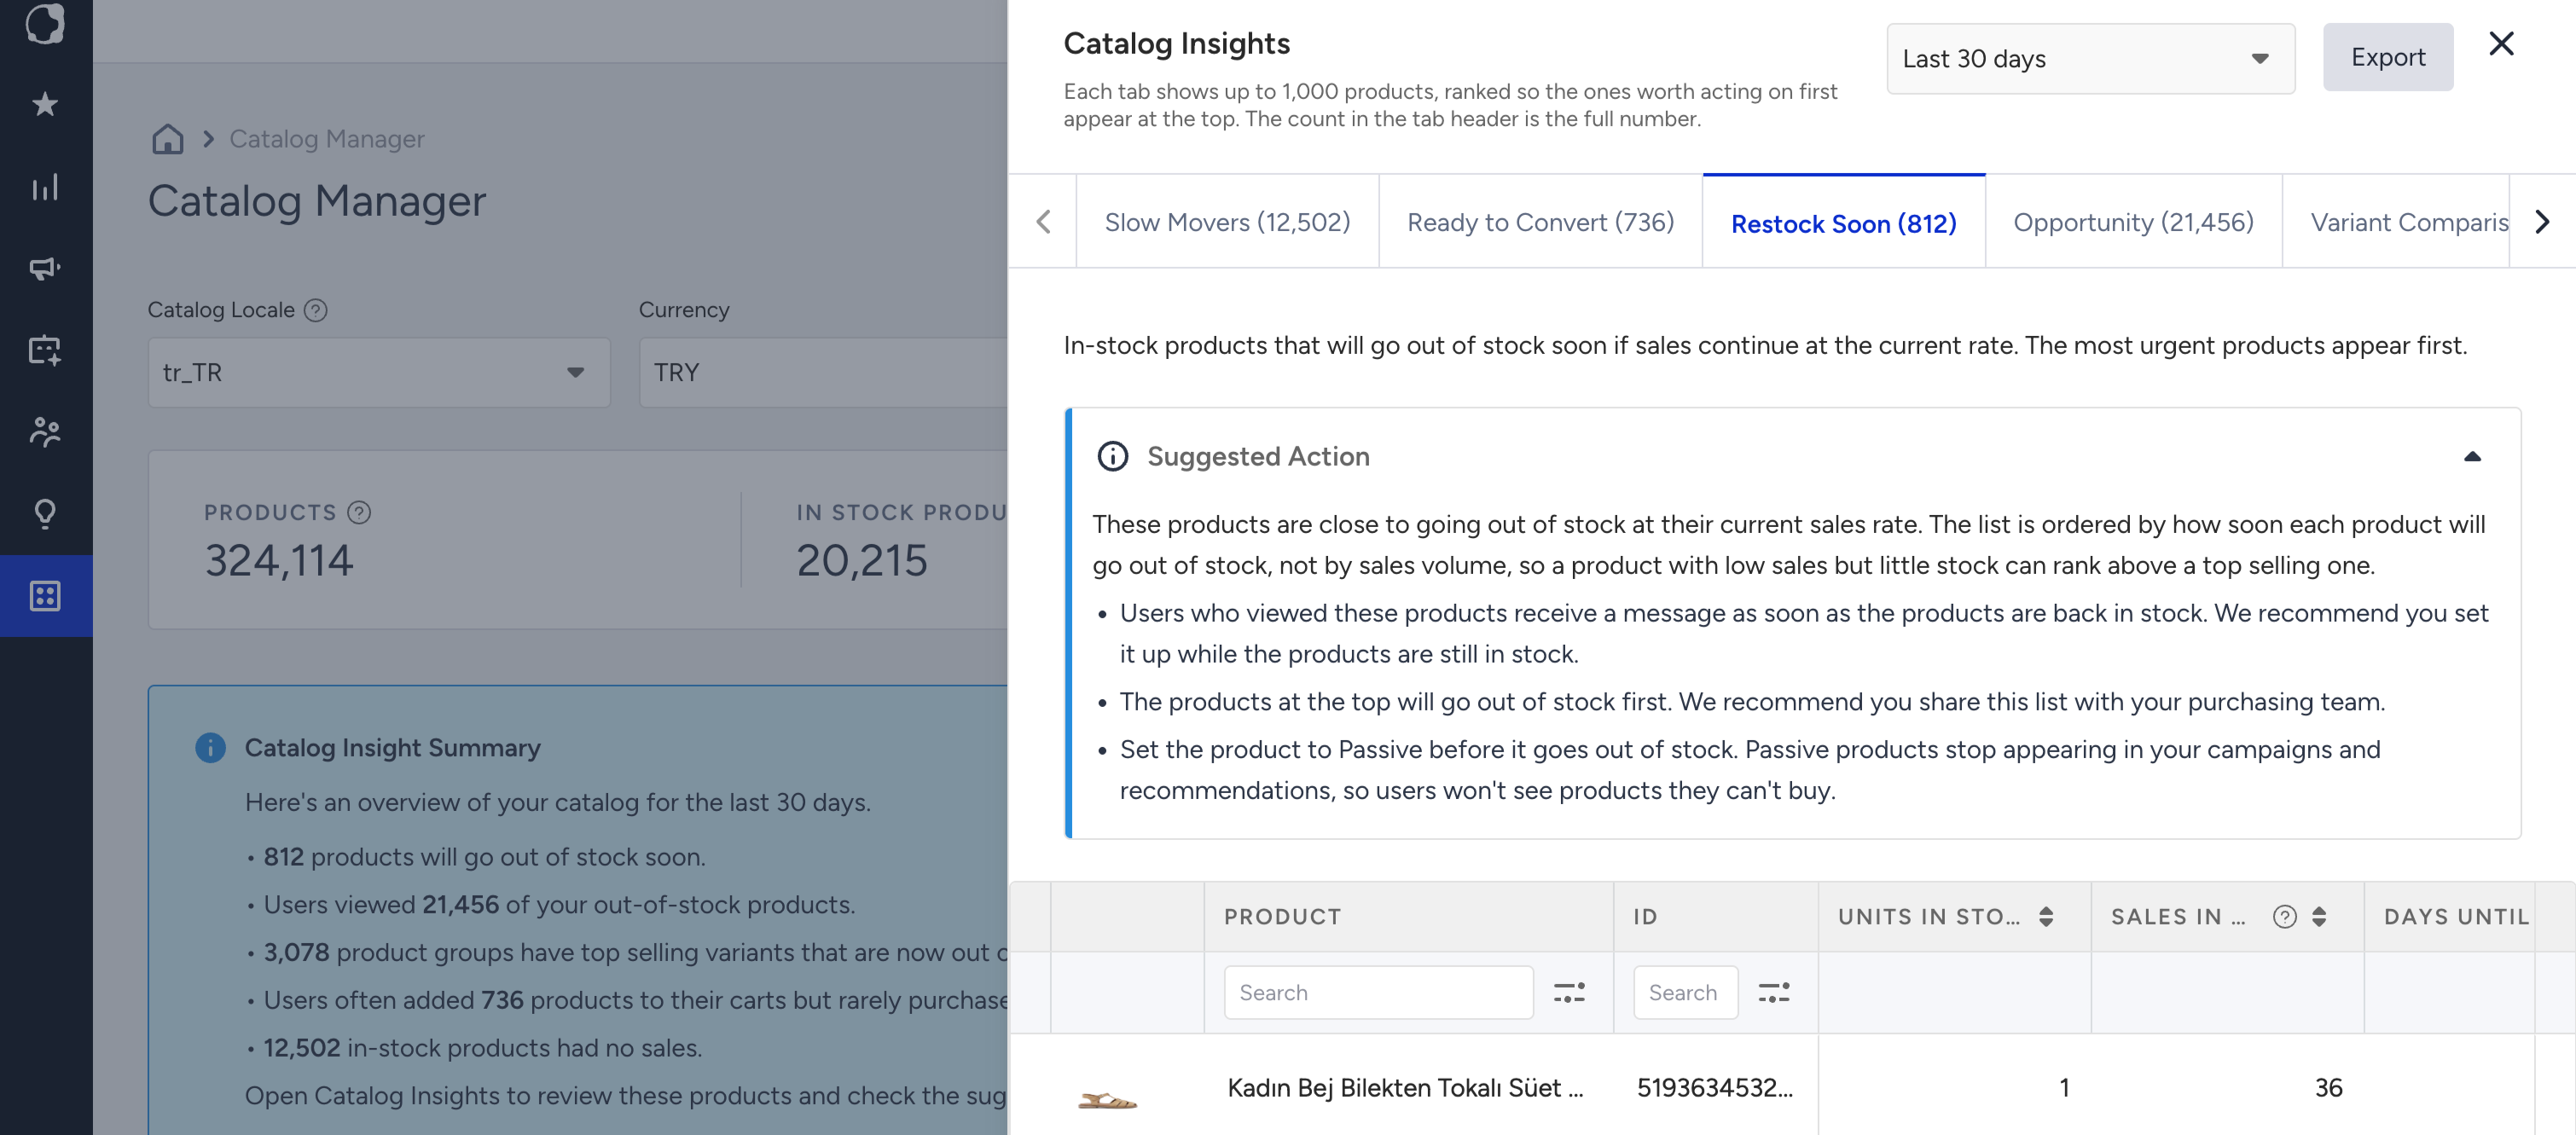
Restock Soon
Selling well, running out soon
In-stock products that will go out of stock soon if sales continue at the current rate. The product table shows each product's units in stock, sales in the selected time range, and Days Until Stock-out, an estimate based on the product's current sales pace.
Stock-out Risk needs a numeric stock count in your catalog feed. If your feed does not include a stock quantity, this tab does not appear.
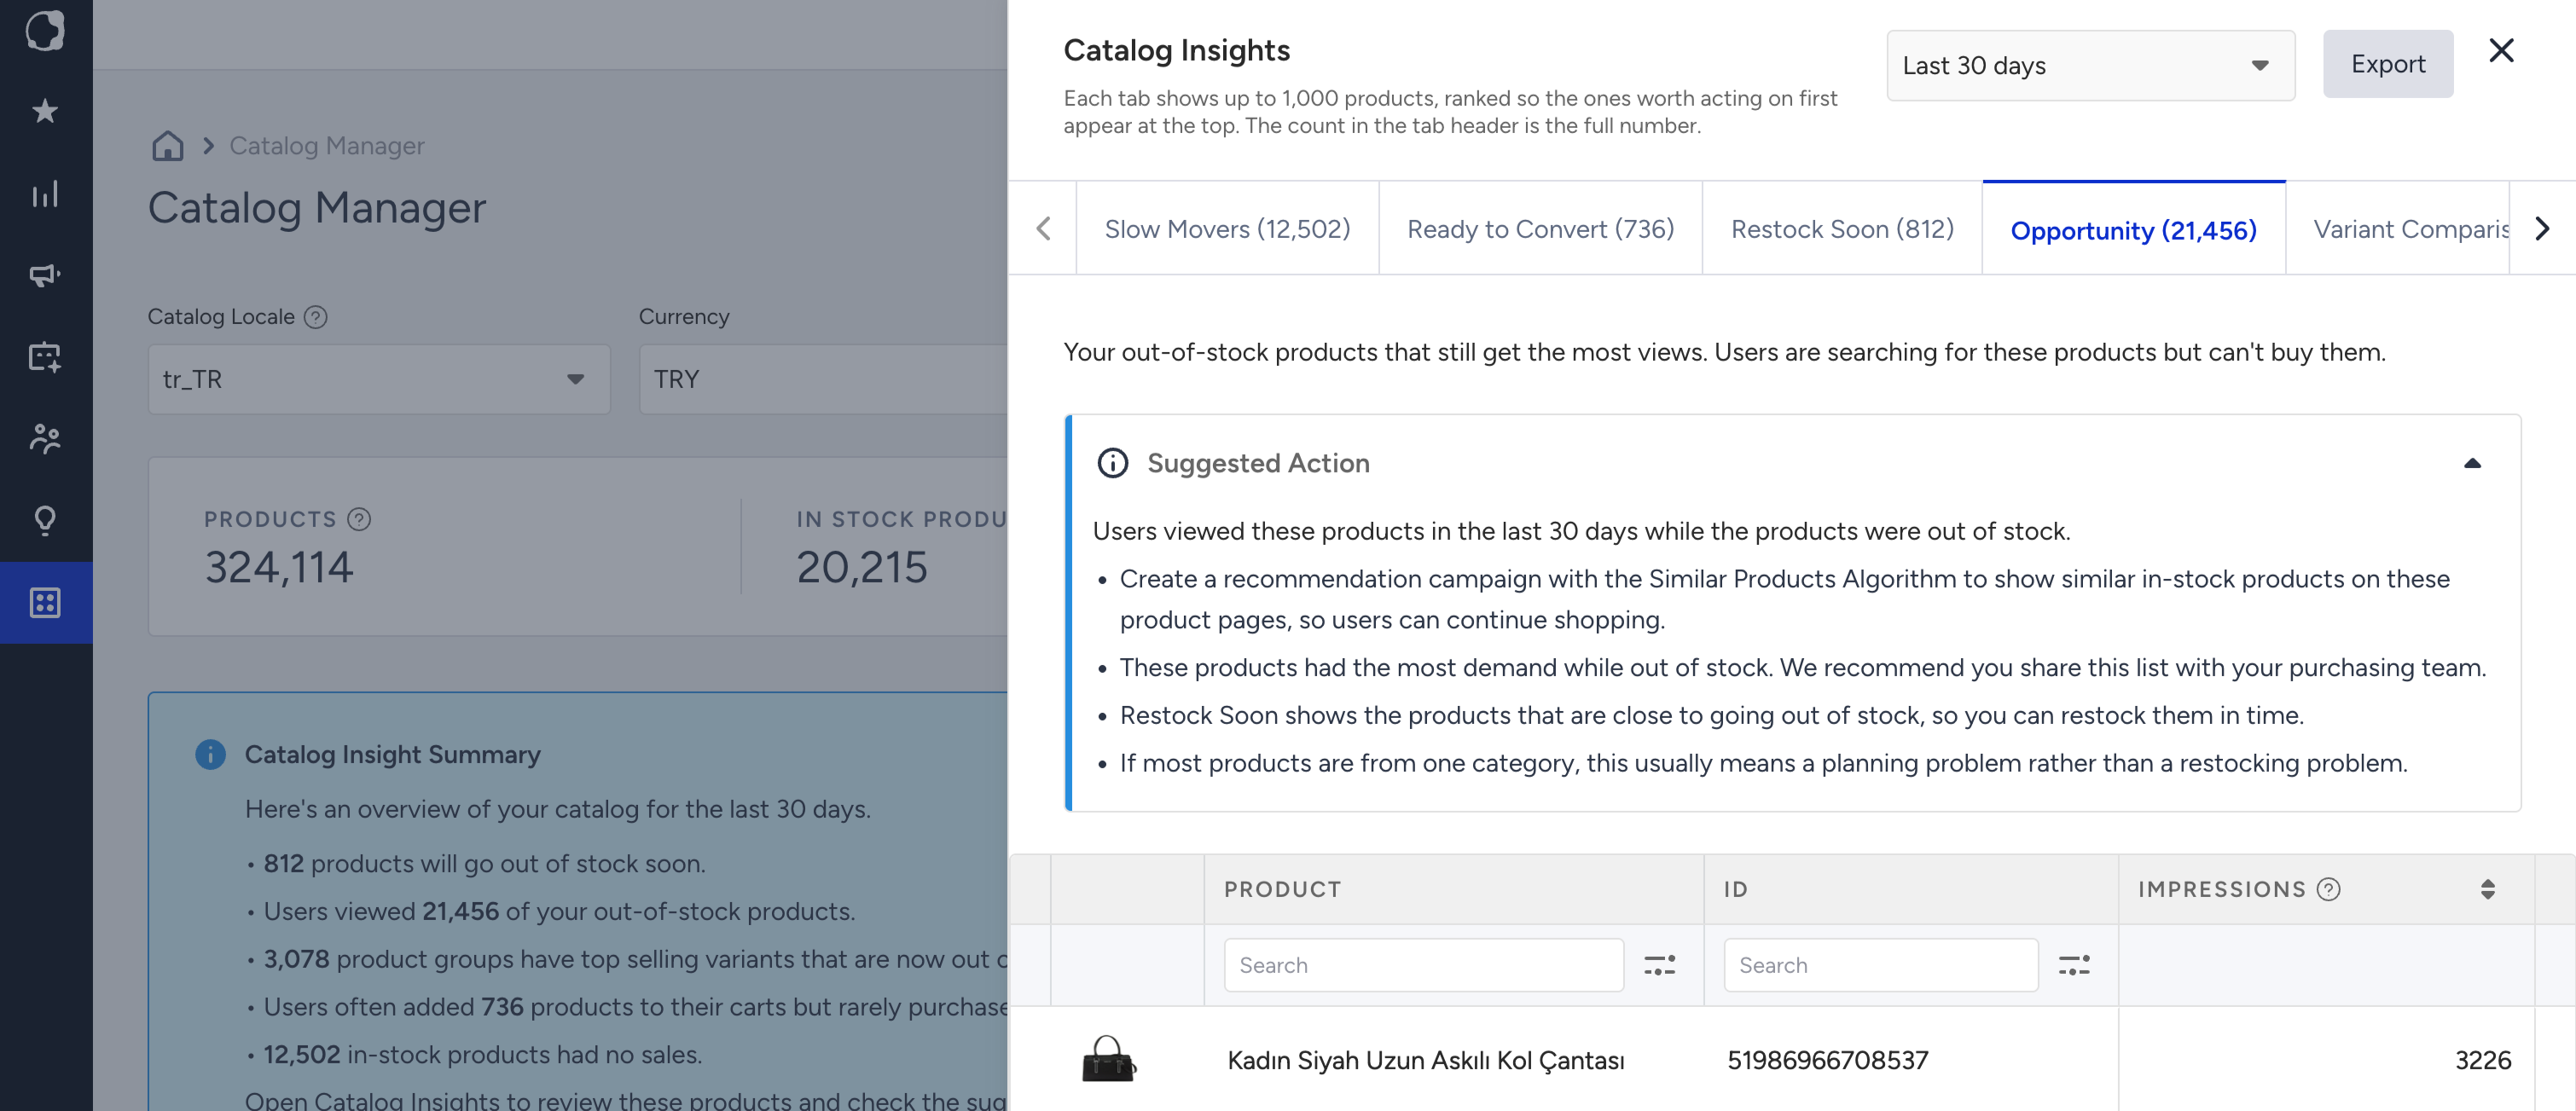
Opportunity
Out of stock, still being looked for
Your out-of-stock products that still get views. The product table shows each product's impressions, ranked from highest to lowest.
“Out of stock, still being looked for” refers to products that were out of stock at the time of our latest daily check. Since the data is refreshed once a day, the product’s current stock status may have changed since the last refresh.
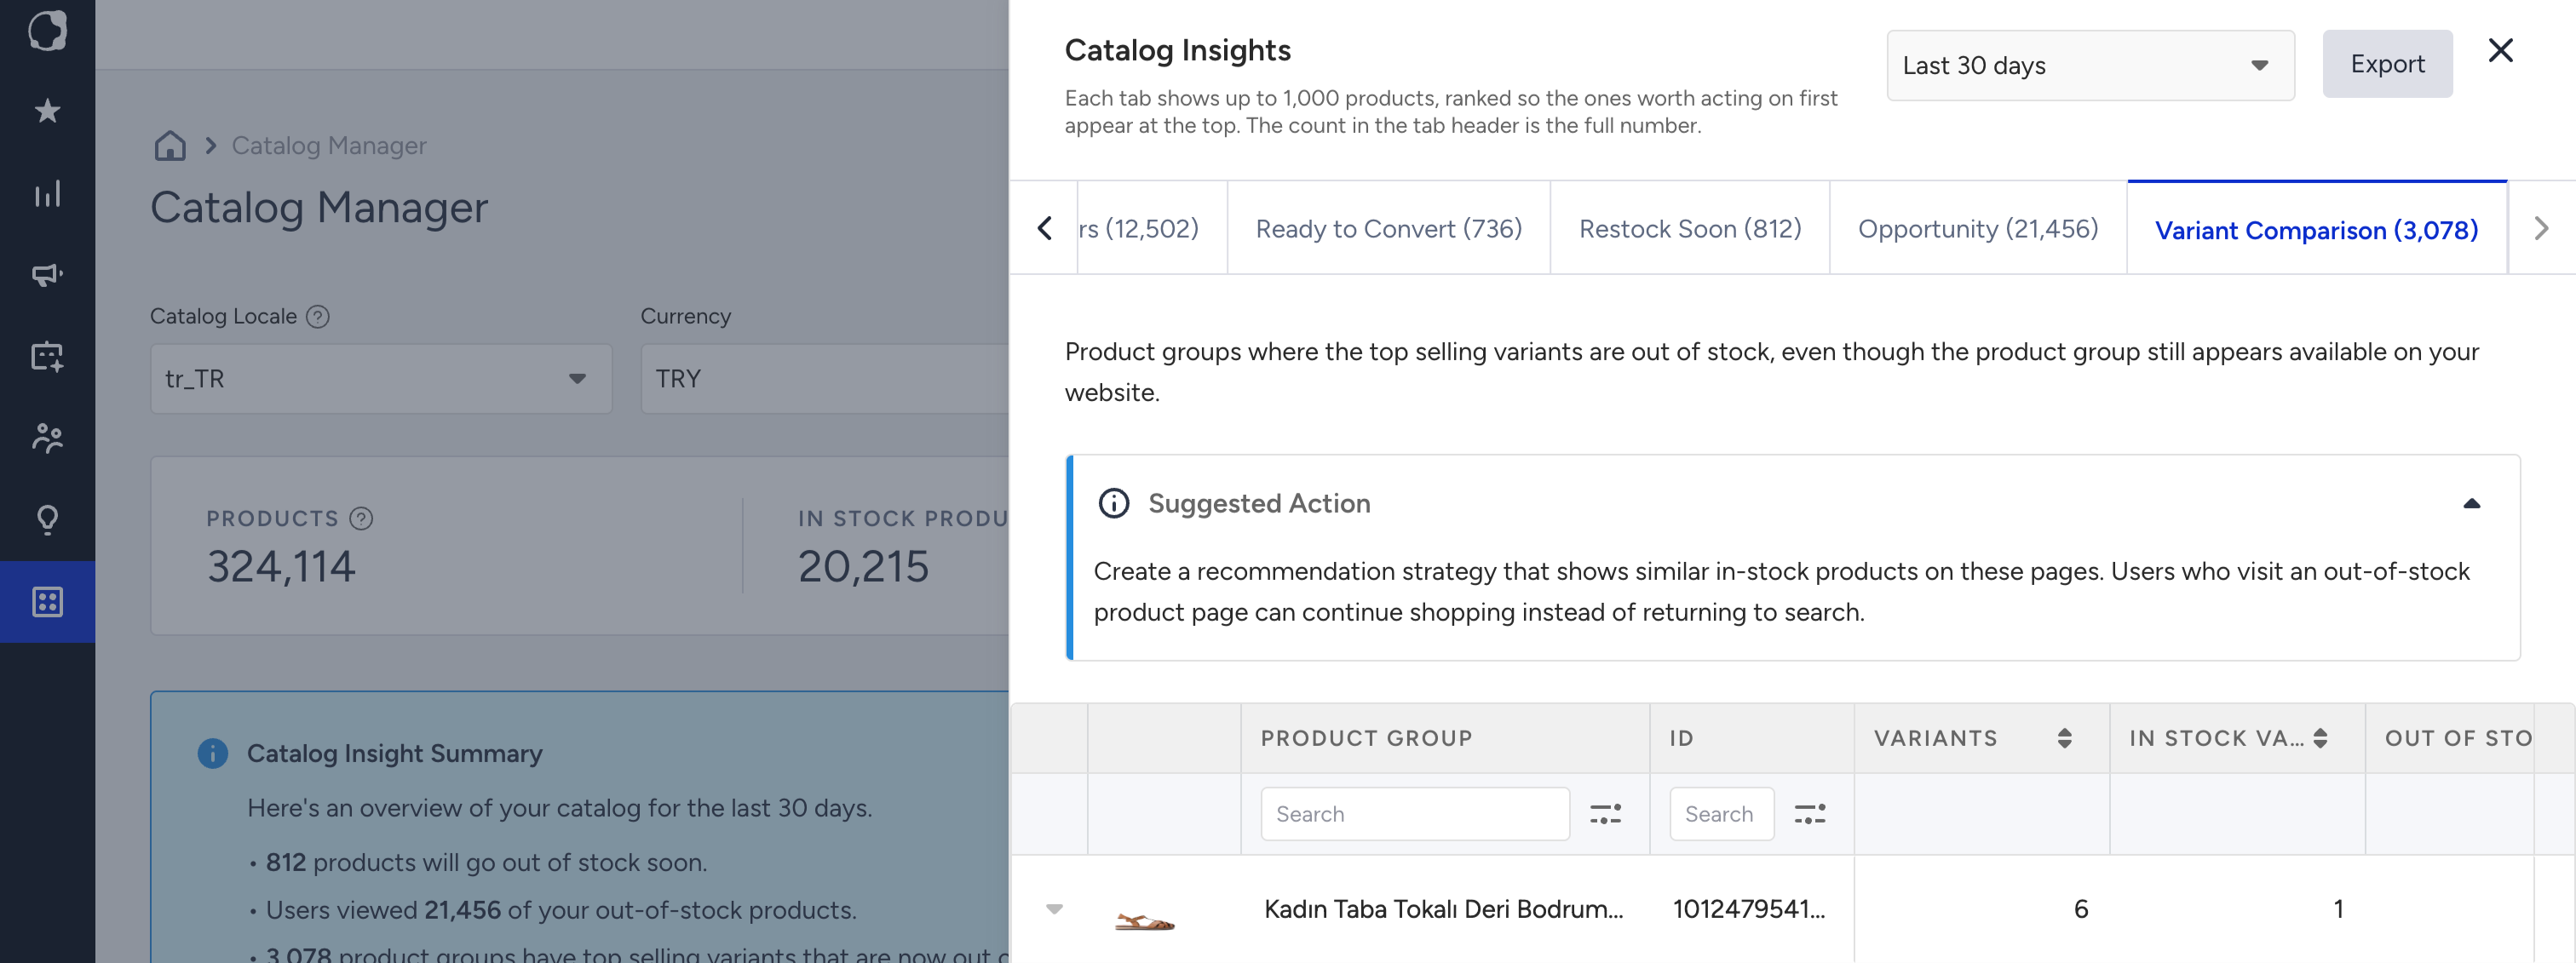
Variant Comparison
Demand landing on variants that are out of stock
Product groups where the top-selling variants are out of stock, even though the group still appears available on your website. The product table shows which variants are in stock, how they compare in sales, and how much demand is tied up in the unavailable ones. Groups are ranked by lost demand, so the ones losing the most sales appear first.
Variant Comparison needs your catalog to group variants. If each product in your catalog is its own item with no grouping, there is nothing to compare, and this tab does not appear.
When an Insight tab is empty
An empty Insight tab means one of three things, and the wording tells you which:
Insider One checked and found nothing that falls into that insight. For example, every active, in-stock product sold at least once in the selected time range.
There is not enough information. The data needed for that insight isn't available for your catalog. For example, Conversion Leak compares products against your own catalog average, which needs a minimum number of viewers per product.
No results have been generated yet. No daily run has been completed for your catalog yet. If you connected this catalog recently, the first results appear after the next daily run.
Things to know
Insights are calculated across your entire catalog. The number shown in each tab header represents the total number of products that match that insight.
Each list displays up to the top 1,000 products, ranked to help you focus on the most relevant products first.
You can export up to 1,000 products. Insider One prepares the export file and emails you the download link.
Insights are refreshed once a day. Changes made today are reflected after the next daily refresh.
The number of products displayed in a list may be lower than the total shown in the tab header.
Insights are advisory. They help you identify products that may require attention. Make any product updates through the Catalog Manager product list or your own catalog management systems.