your title goes here
On-Site Analytics
You can evaluate each On-site (element) you add to your journey flow while it is running.
You can create on-site campaigns on three device types. All related metrics are combined regardless of the device type. You can also see metrics individually with a breakdown of device types.
.png)
You can see Impression, Click, Click-through Rate, Conversions, Conversion Rate, and Revenue metrics, as well as their trends.
Live Stats
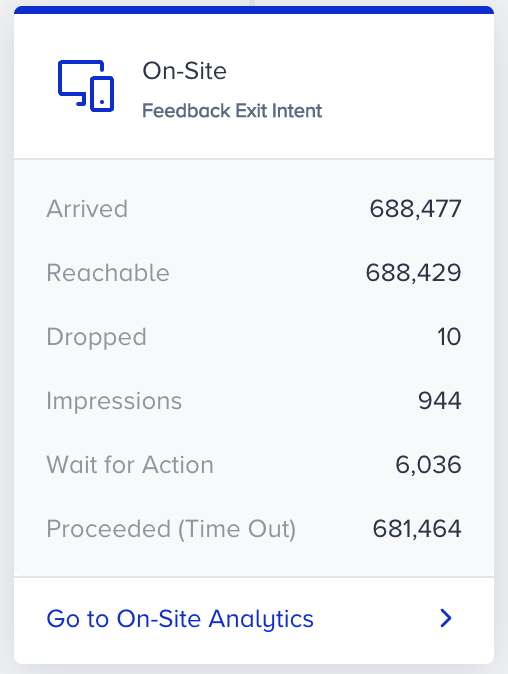
After you launch your journey, you can see Arrived, Reachable, Wait for Action, Proceeded (Time Out), or Dropped (Time Out) figures on the On-site element on the canvas.
- Arrived displays the number of users who arrive at the On-Site element.
- Reachable displays the number of reachable users on On-Site.
- Dropped displays the number of unreachable users on On-Site.
- Impressions displays the number of users who see the On-Site campaign
- Wait for Action displays the number of users who are on hold to see the campaign in the specified duration.
- Proceeded (Time Out) displays the number of users who proceed to the next step without seeing the campaign within the specified duration.
- Dropped (Time Out) displays the number of users who are dropped from the journey without seeing the campaign within the specified time duration.
Proceeded (Time Out) and Dropped (Time Out) cannot be shown simultaneously. It shows the metric you selected inside the On-Site element.