The Event Analytics module allows you to track and analyze user actions or events across all channels, such as the web, application, API, etc. This can help you gain insights into how your users interact with your product and identify areas for improvement.
The video below briefly explains event analytics.
If this video does not load in your region, you can watch it on our YouTube Channel.
Event Analytics can help you with the following use cases:
See certain product pages or product visits to identify the best voucher category decision before generating coupon codes based on user segments.
Ensure that main page elements and category management match the user persona types to decrease the conversion funnel steps.
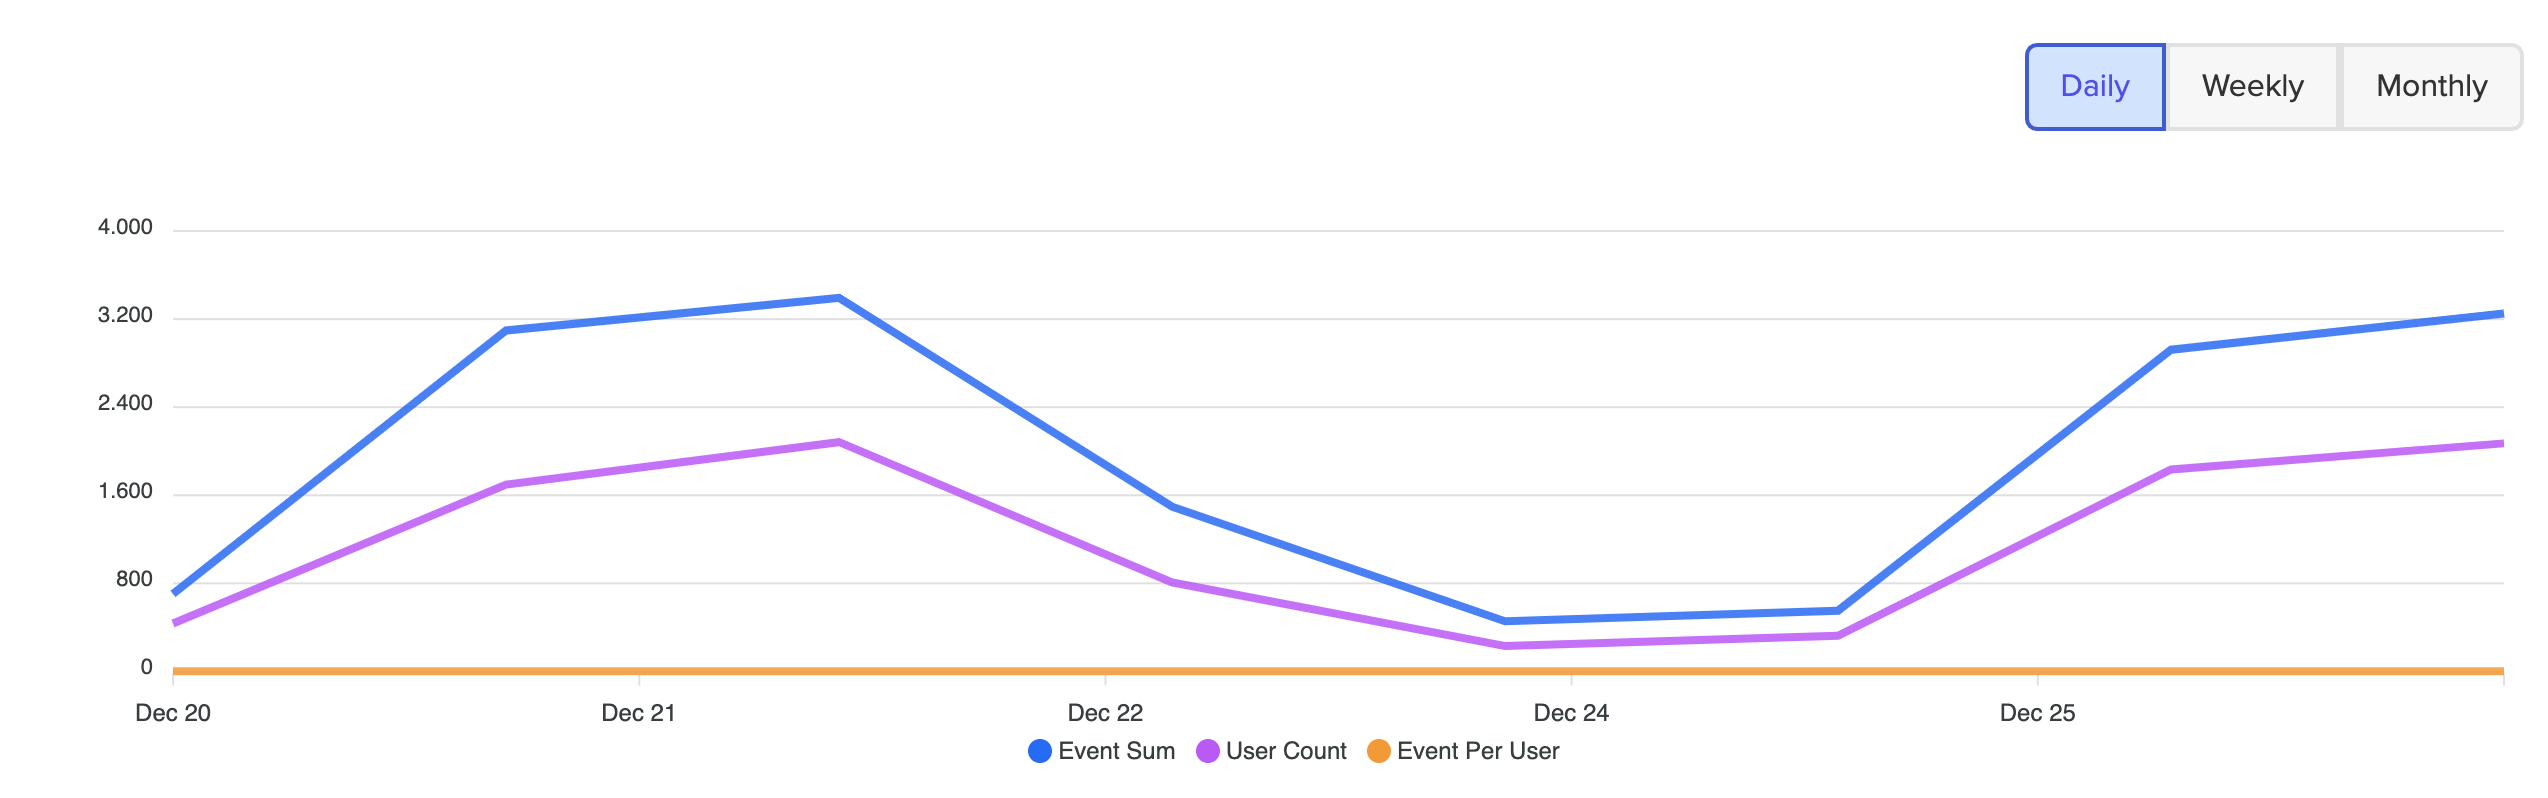
This page shows the event sum, user count, and event per user for the selected events.
Event Sum: Shows how many times the selected event was triggered.
User Count: Shows how many unique users triggered that selected events
Event per User: Calculated as the total number of events divided by the number of unique users
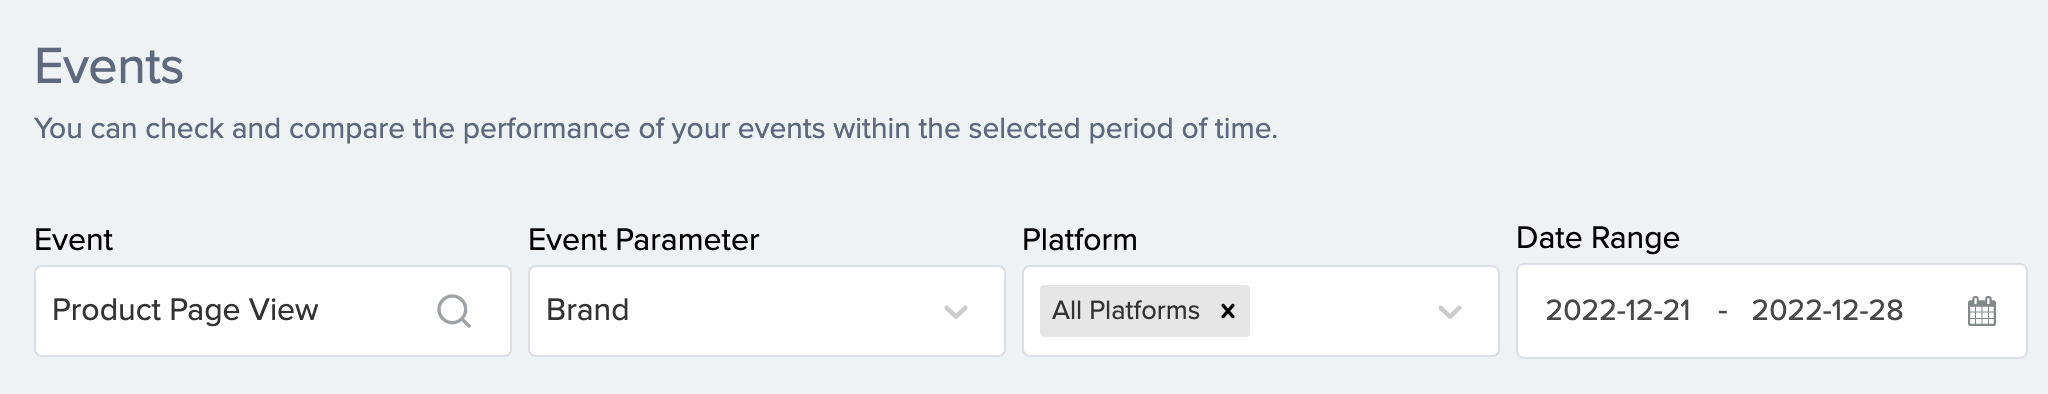
In addition to tracking events, you can select an event parameter to understand the respective event parameter's performance better.
Let's say you select the "add-to-cart" event and the defined "product categories" event parameter for this event. It is reported that each product category (e.g., clothing, accessories, shoes, etc.) was added to the cart, and how many individual users added it. This report lets you see how often your event-specific sub-properties were triggered and research more specific user segments.
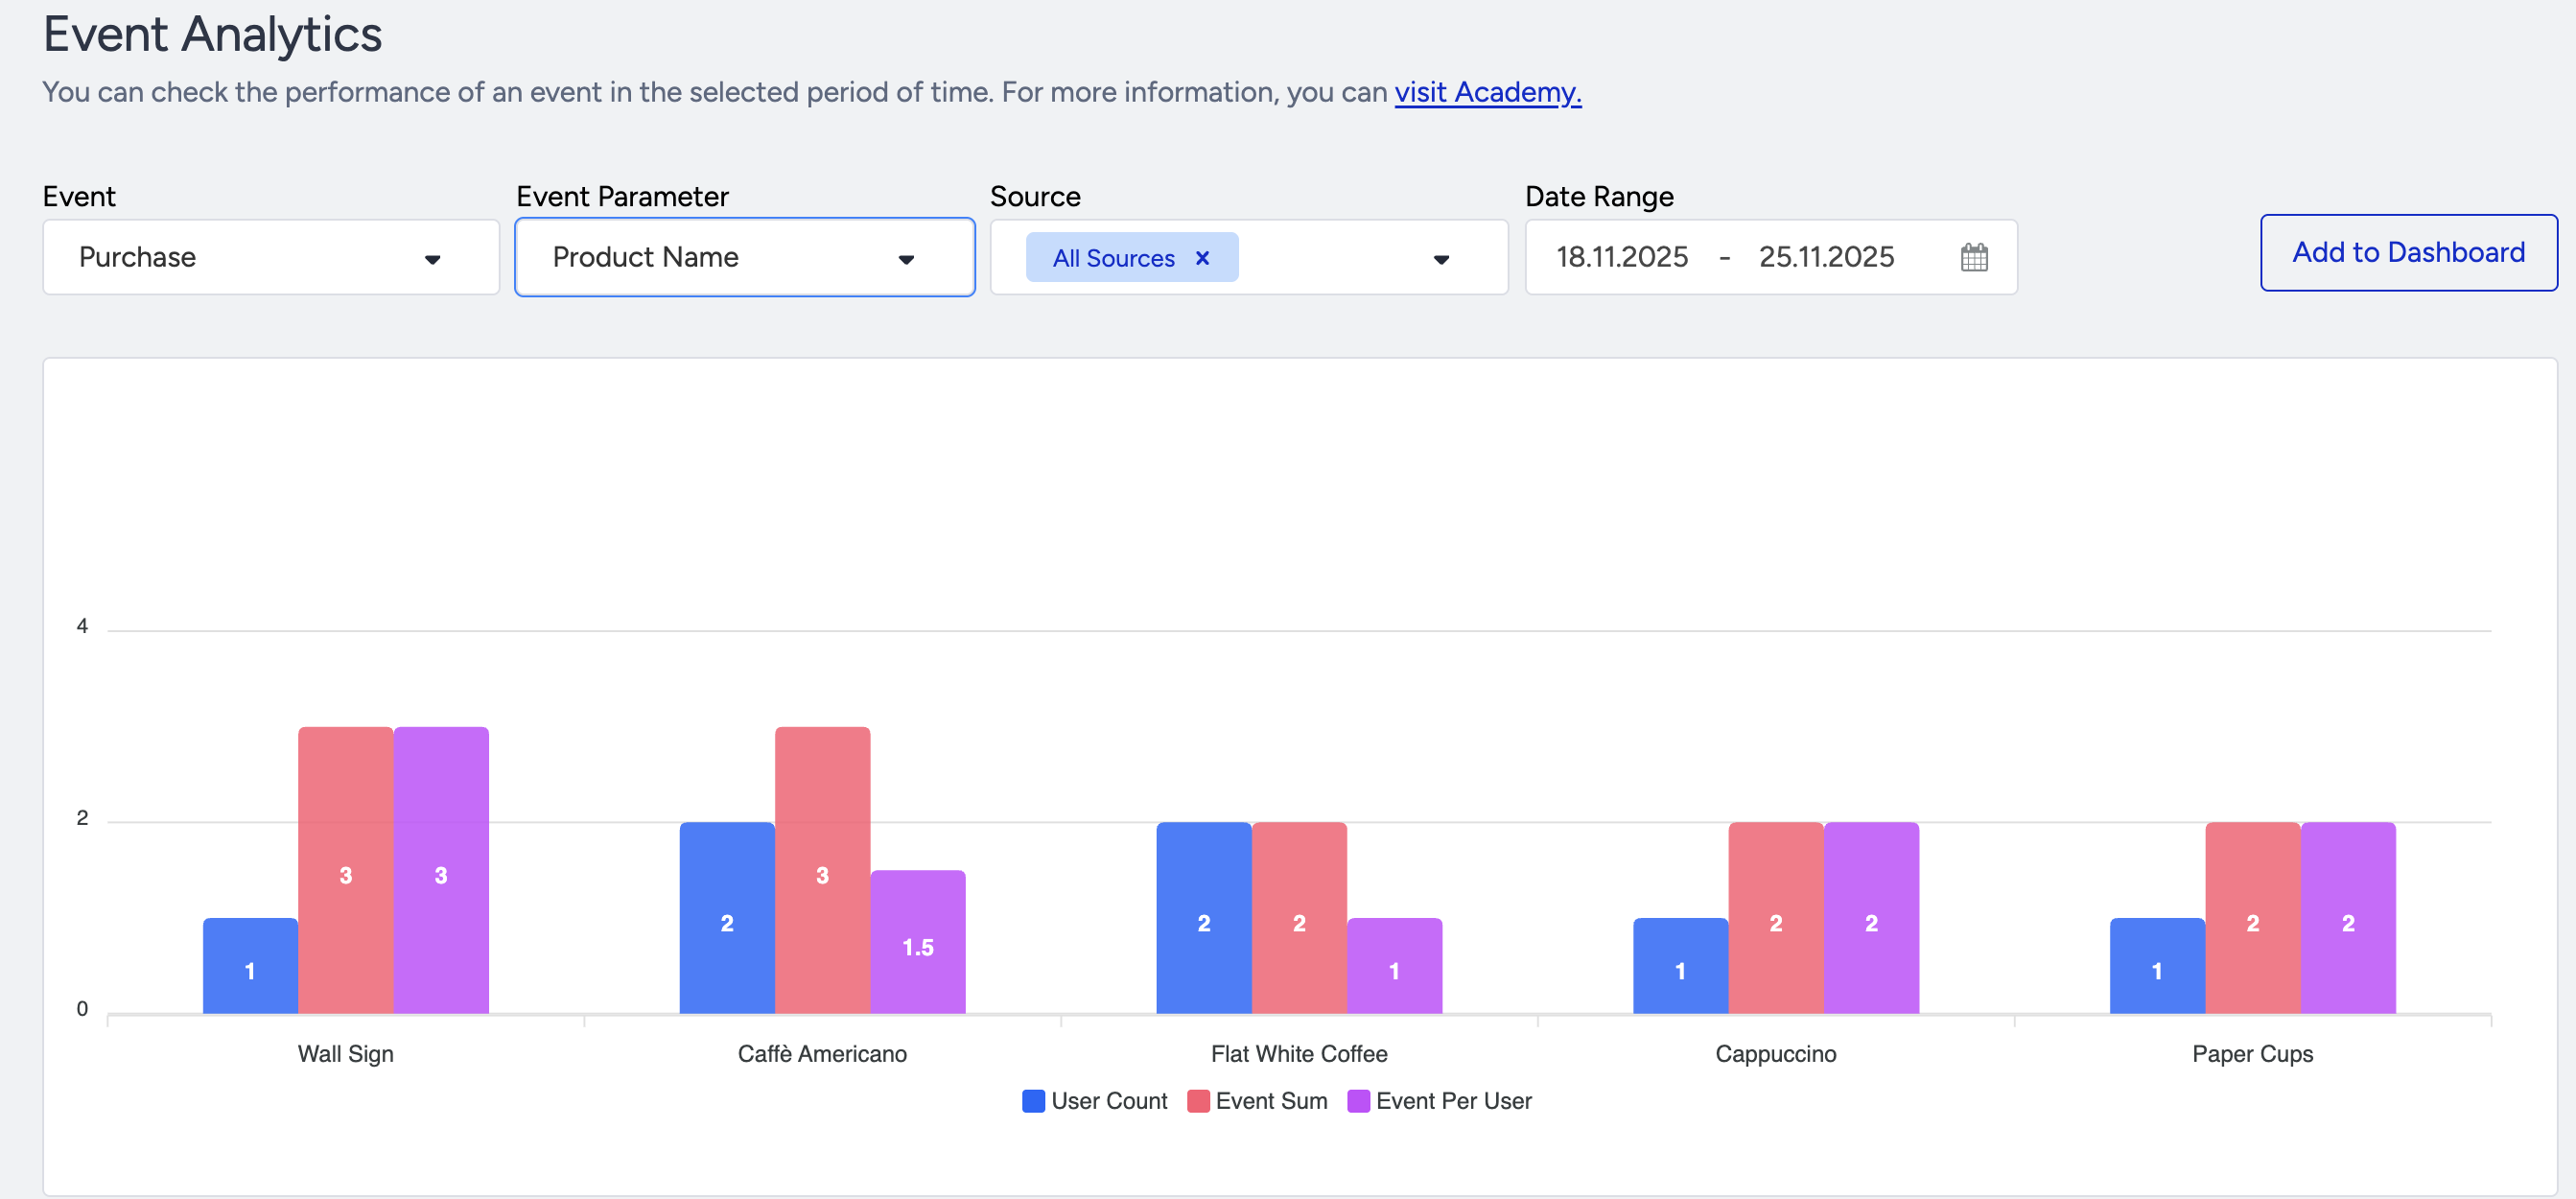
Once you add the event parameters, you can see the top five best-performing results.
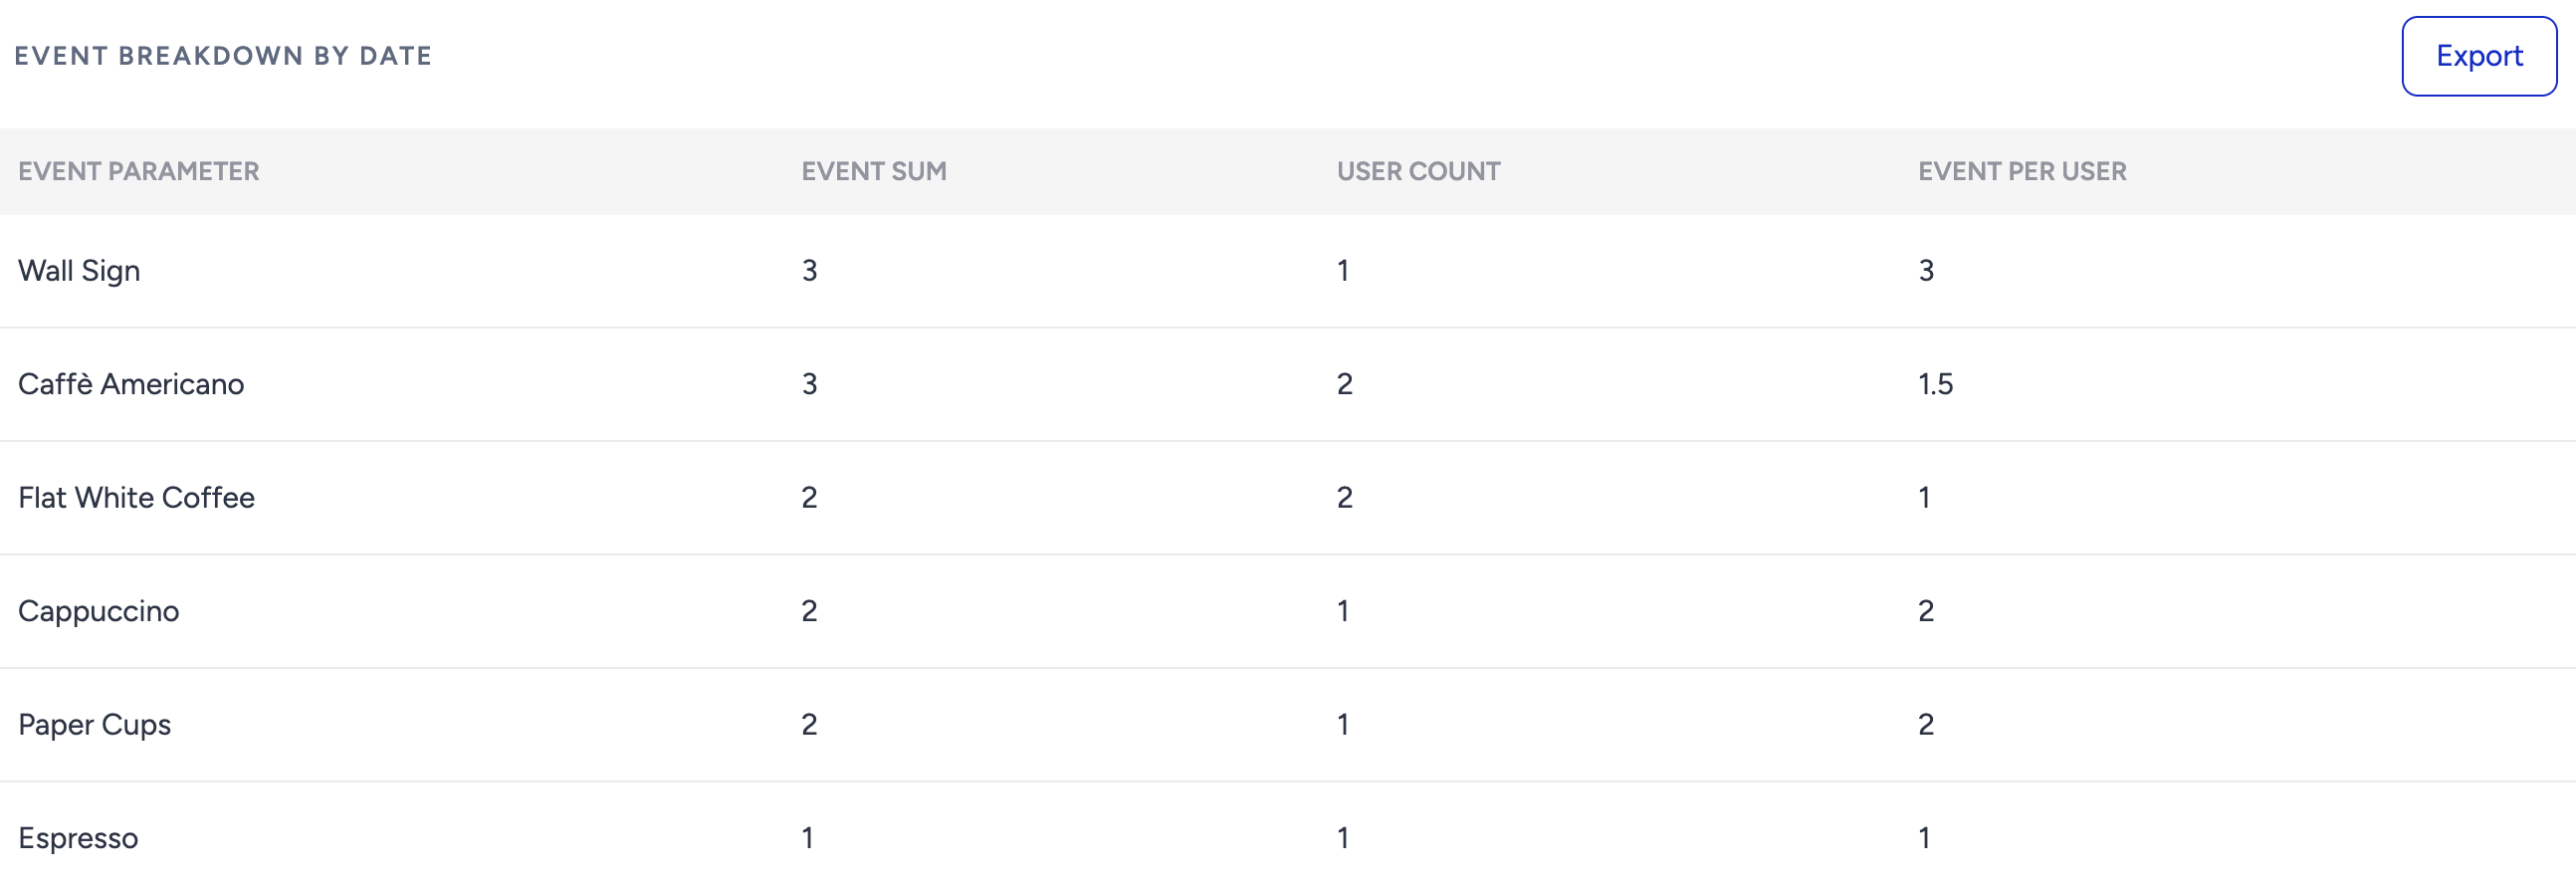
You can view a detailed Event Breakdown by Date to analyze how specific events are distributed over time. Additionally, all data in the table can be exported in CSV format. This makes it easy to access raw data and visualize trends or patterns in tools like Microsoft Excel or Google Sheets.
Add your Event Analytics to a dashboard
With your filters applied, you can add your event analytics to an existing dashboard or create a new one to add it.
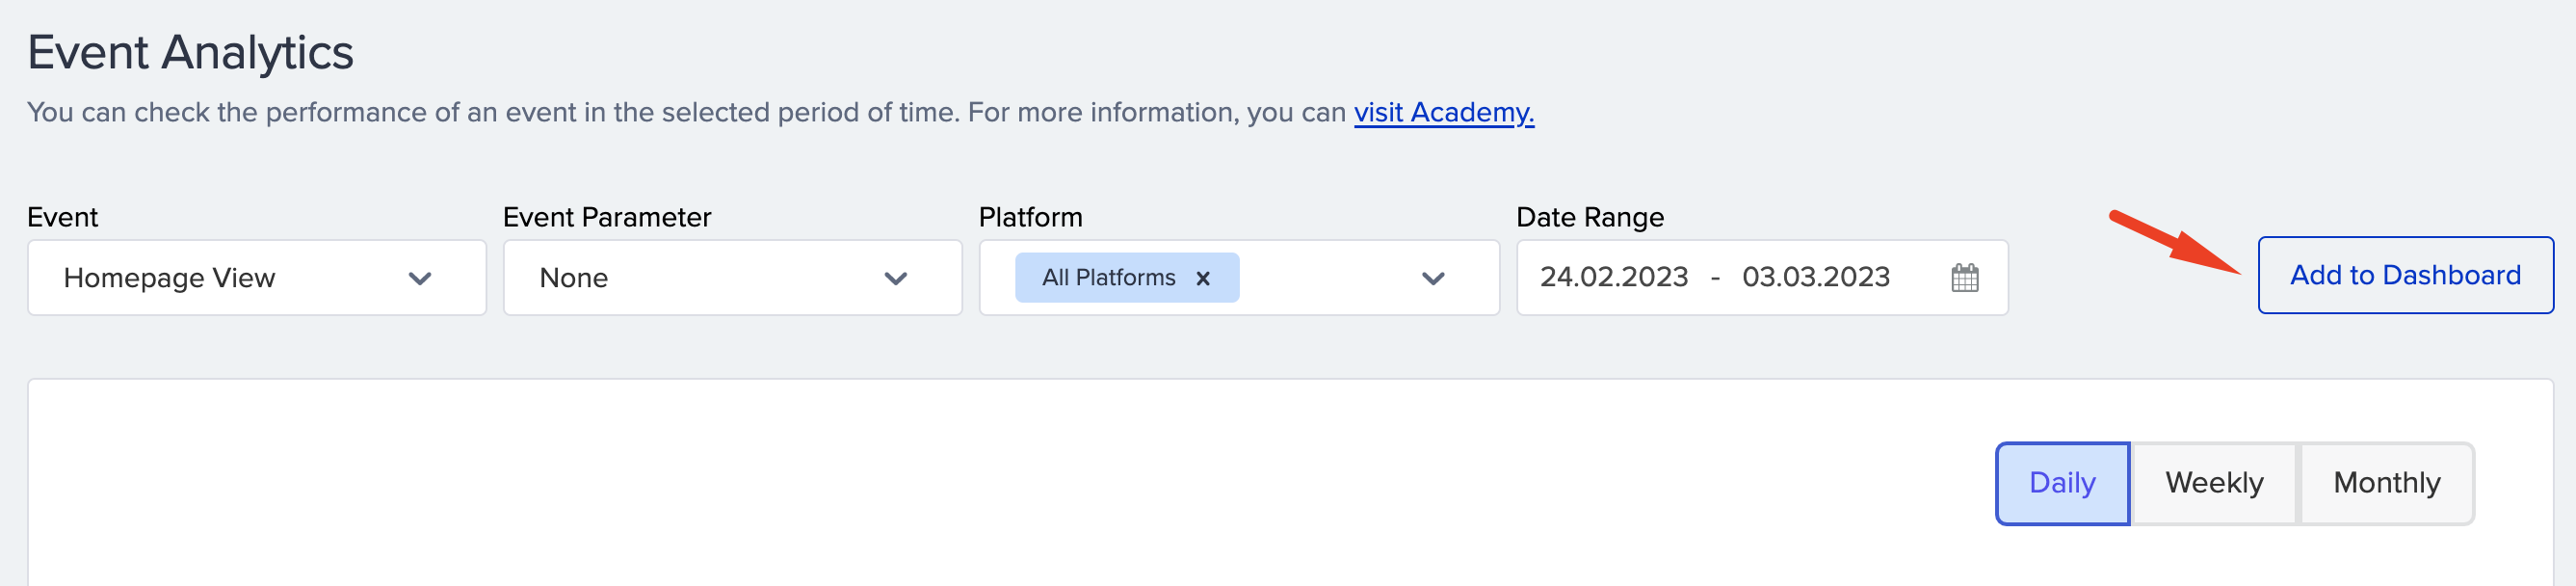
1. Click the Add to Dashboard button. A window will appear on the right-hand side of the screen.
2. Choose dashboard from: Select Existing or Create New to add your flow.
Select Existing displays the existing behavior dashboards from which you can select.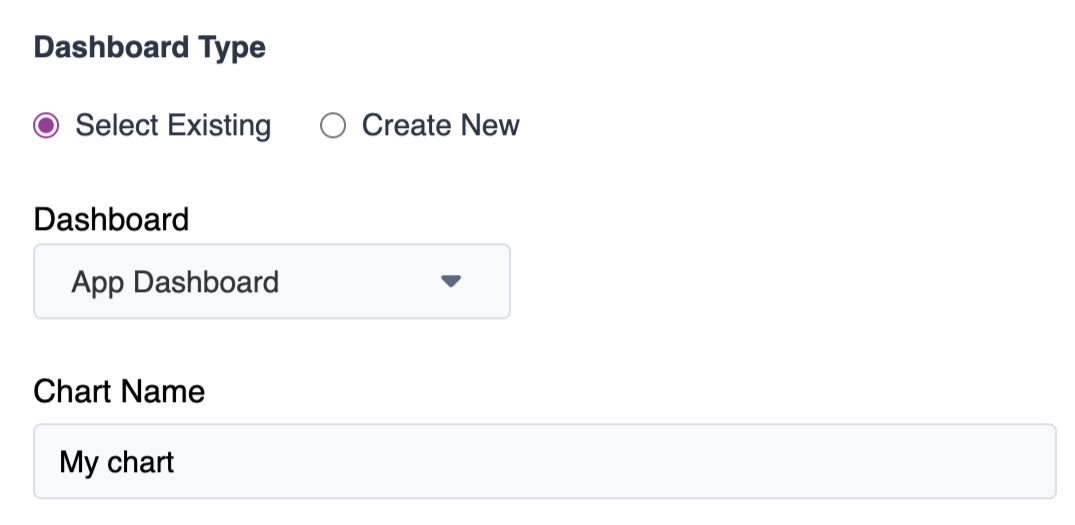
If you do not want to add your analytics to your existing dashboards or do not have an existing dashboard, you can also create a new one.
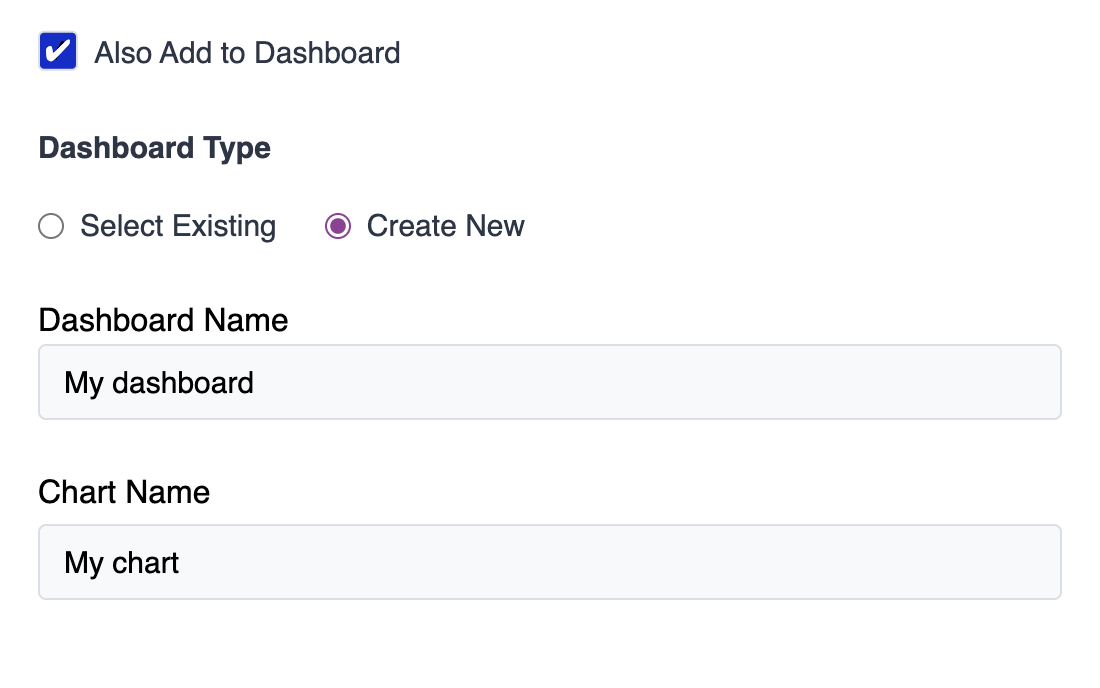
3. Type a chart name for your analytics to appear on the dashboard. You can have multiple charts under one dashboard.
4. Click the Add button at the bottom of the page to add your analytics to the selected dashboard.
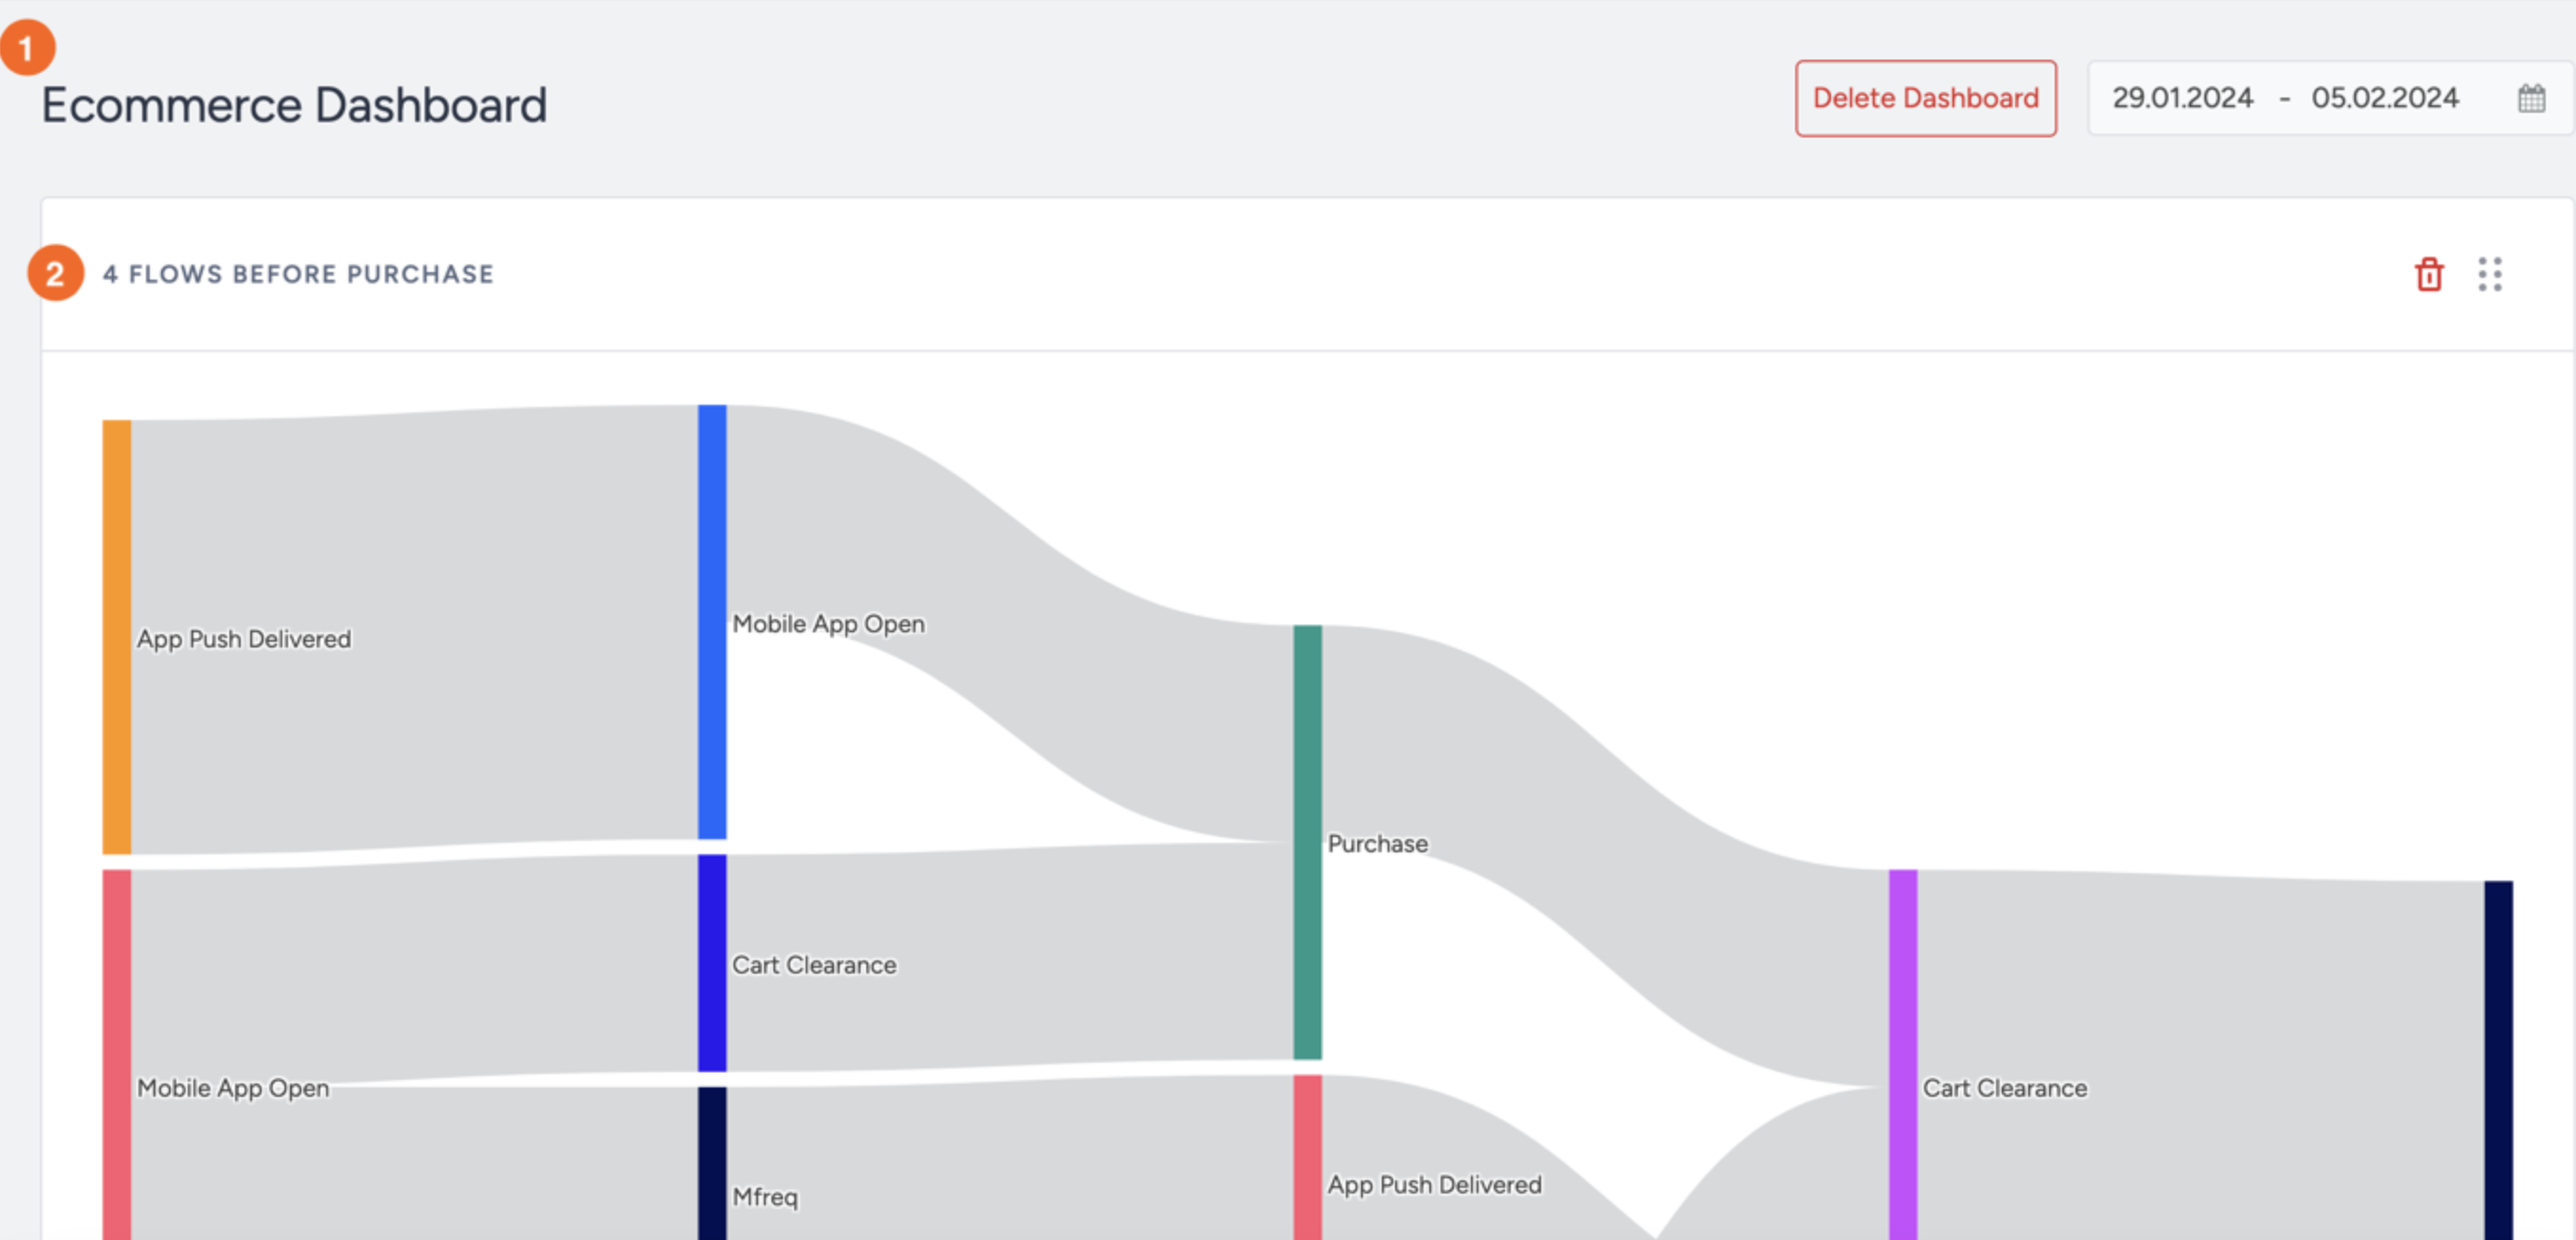
Once created, your dashboards will be listed under Behavior Analytics > Behavior Dashboards.
.png)