Insider’s machine learning infrastructure analyzes each customer's historical data and real-time actions to help brands predict users' future intent and actions. The visitors of web pages and mobile applications look for recommended content and products to save time and discover new merchandise related to their interests and affinities. Businesses use various tools like SMS, Email, Web, App Push, and WhatsApp channels to reach customers. Segmentation of these customers is a great way to understand the intent and behavior of a group of people following their paths that lead to purchases, cart abandonment, churn, or loyalty.
The Predictive Analytics Dashboard visualizes your users' predictive segment data and provides valuable insights. With this dashboard, you can track the overall performance of your predictive segments.
You can visit the dashboard through Predict > Predictive Dashboard.
If you are using this dashboard for the first time, make sure to have at least one month of data trained for your account. For more information, you can consult the Insider One team.
The Predictive Analytics dashboard offers visualized data and detailed reviews for the following segments:
Customer life cycle
Likelihood to purchase
Cohort metrics for the users who made purchases
Discount affinity analysis
Customer Life Cycle
This algorithm tracks the entire customer life cycle from initial acquisition to cross-selling efforts, all the way up to churn prevention and reactivation efforts. You can understand customer habits and lifestyle choices so that you can predict their behavior more accurately.
Read more about Customer Lifecycle Status.
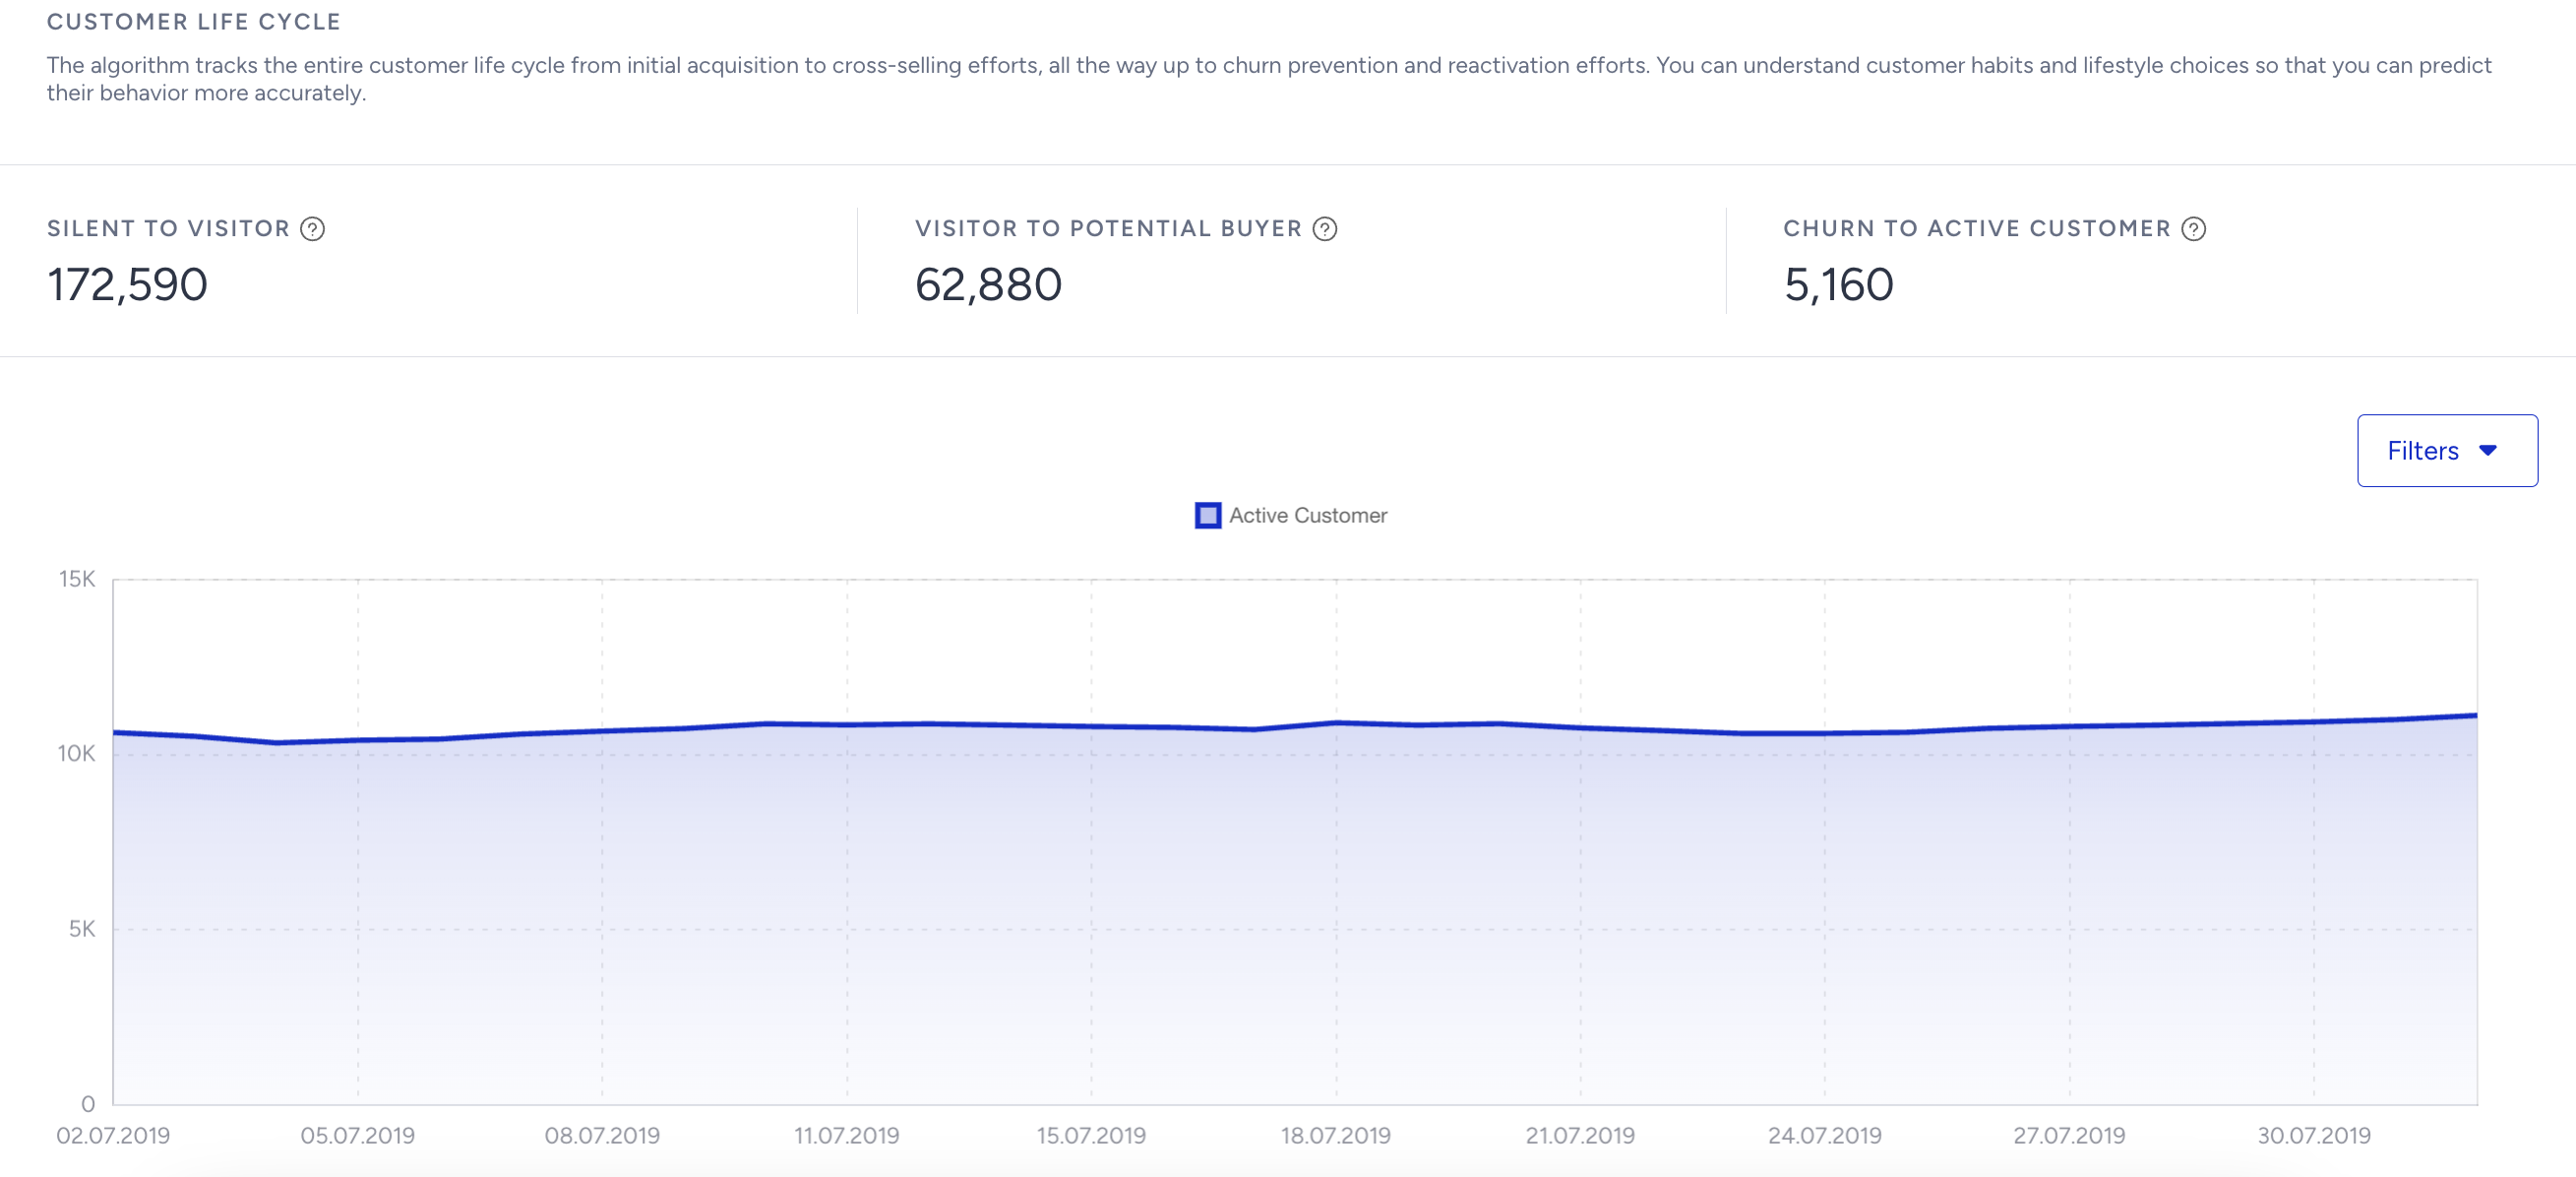 With this algorithm, you can build one-on-one relationships with all users throughout their lifecycle. The customer life cycle also offers insights about the users who are in the following phases:
Silent to visitor: The number of users who were inactive for some time but recently became active visitors
Visitor to potential buyer: The number of users who were visitors for some time but recently became potential buyers
Churn to active customer: The number of users who were about to churn but recently became active customers
Likelihood to Purchase
This algorithm tracks and learns from the users' behavior and predicts how they are likely to purchase. The statistics show the users that have a high likelihood to purchase.
Read more about Likelihood to Purchase.
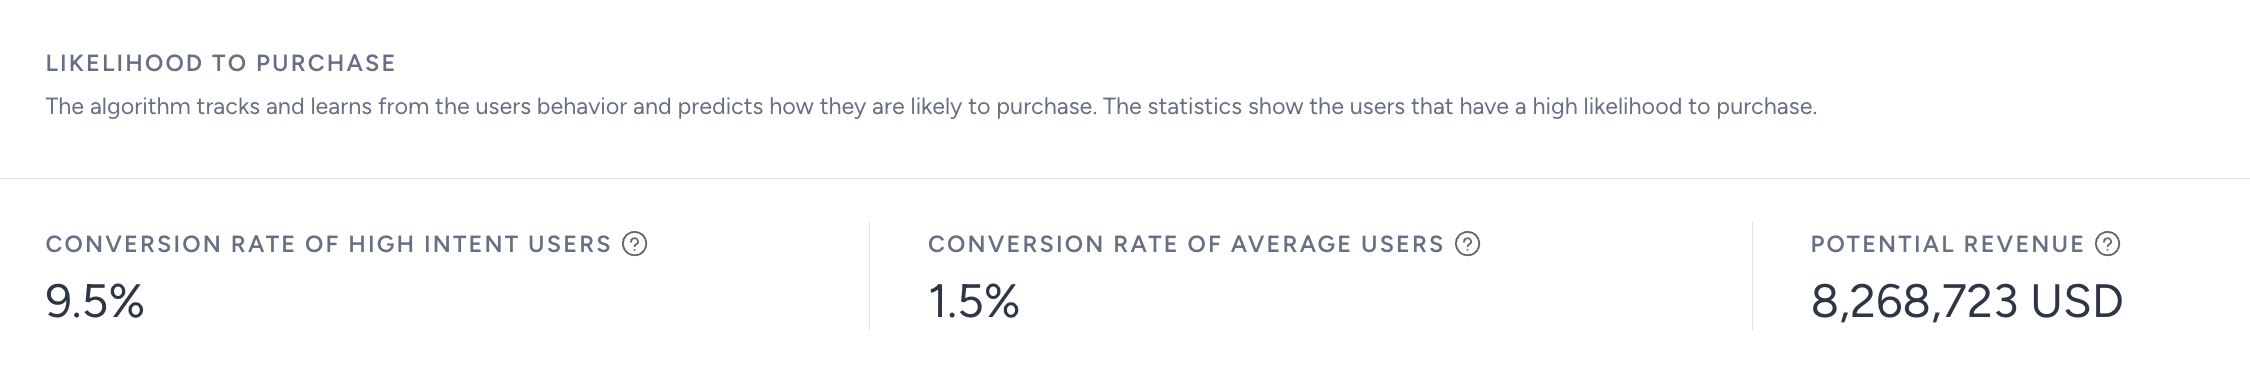
With this section, you can get insights about the following user groups:
Conversion rate of high-intent users: The conversion rate of the users who have a high likelihood to purchase. Users in this segment have a 5.6 times higher conversion rate than the average users.
Conversion rate of average users: The conversion rate of the users who have an average likelihood to purchase. Users in this segment have a 5.6 times lower conversion rate than the high intent users.
Potential revenue: The amount of revenue that you can expect to generate if the users who have a high likelihood to purchase are targeted
Cohort Metrics
This chart shows the percentages of the users who made a purchase in how many days after being segmented.
A cohort is a group of users who share a common characteristic. Cohort analysis helps you understand the behavior of the component groups of users.
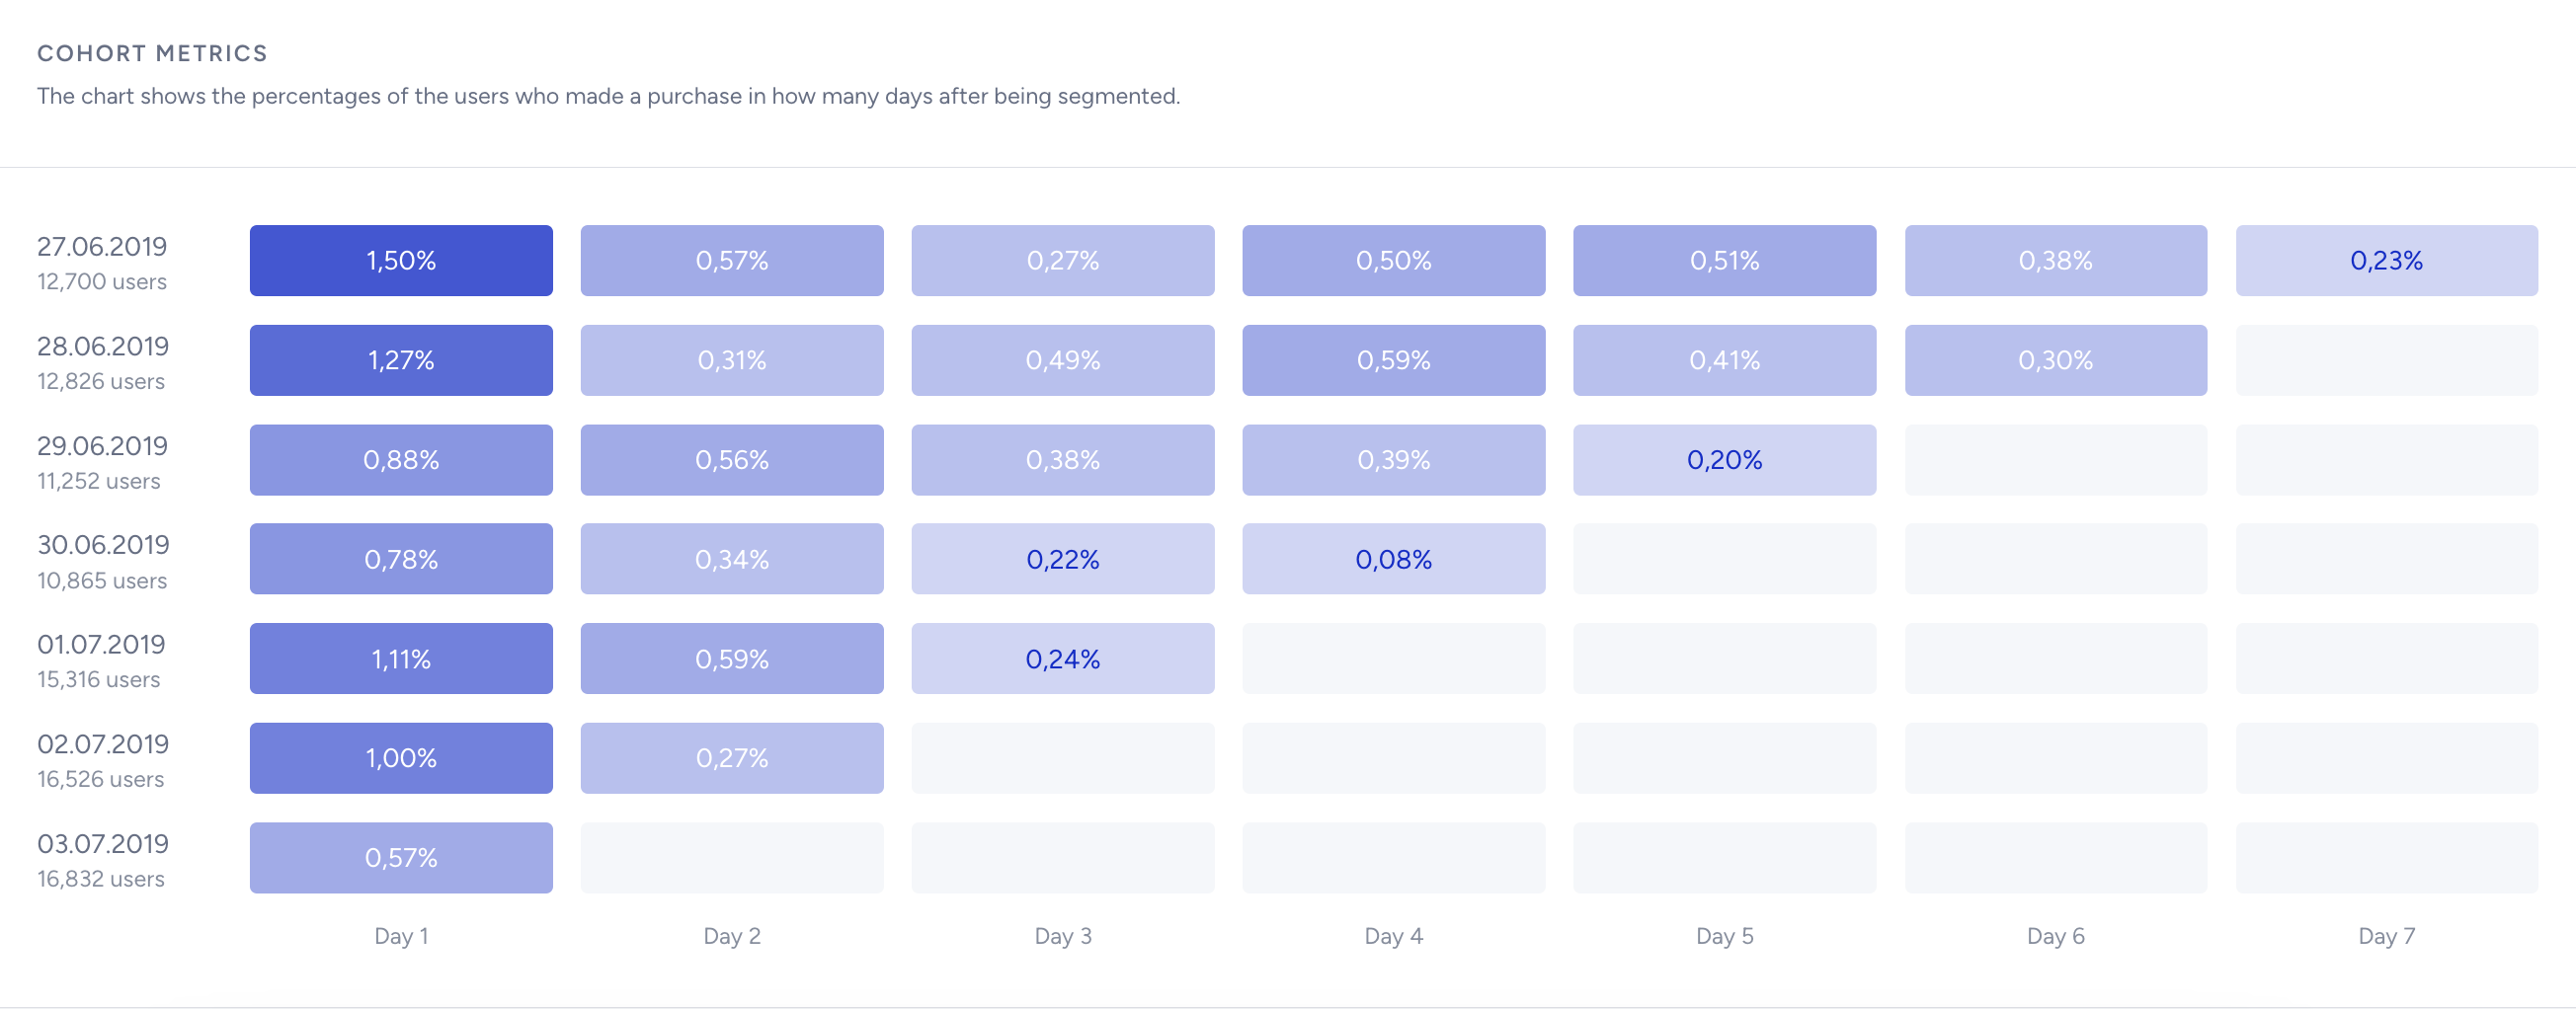
In the chart above, you can see how many users are segmented as Likelihood to Purchase: High every day and their conversion rate day by day.
Discount Affinity Analysis
The algorithm tracks the users' shopping behavior and segments them based on their affinity for discounts.
Read more about Discount Affinity.
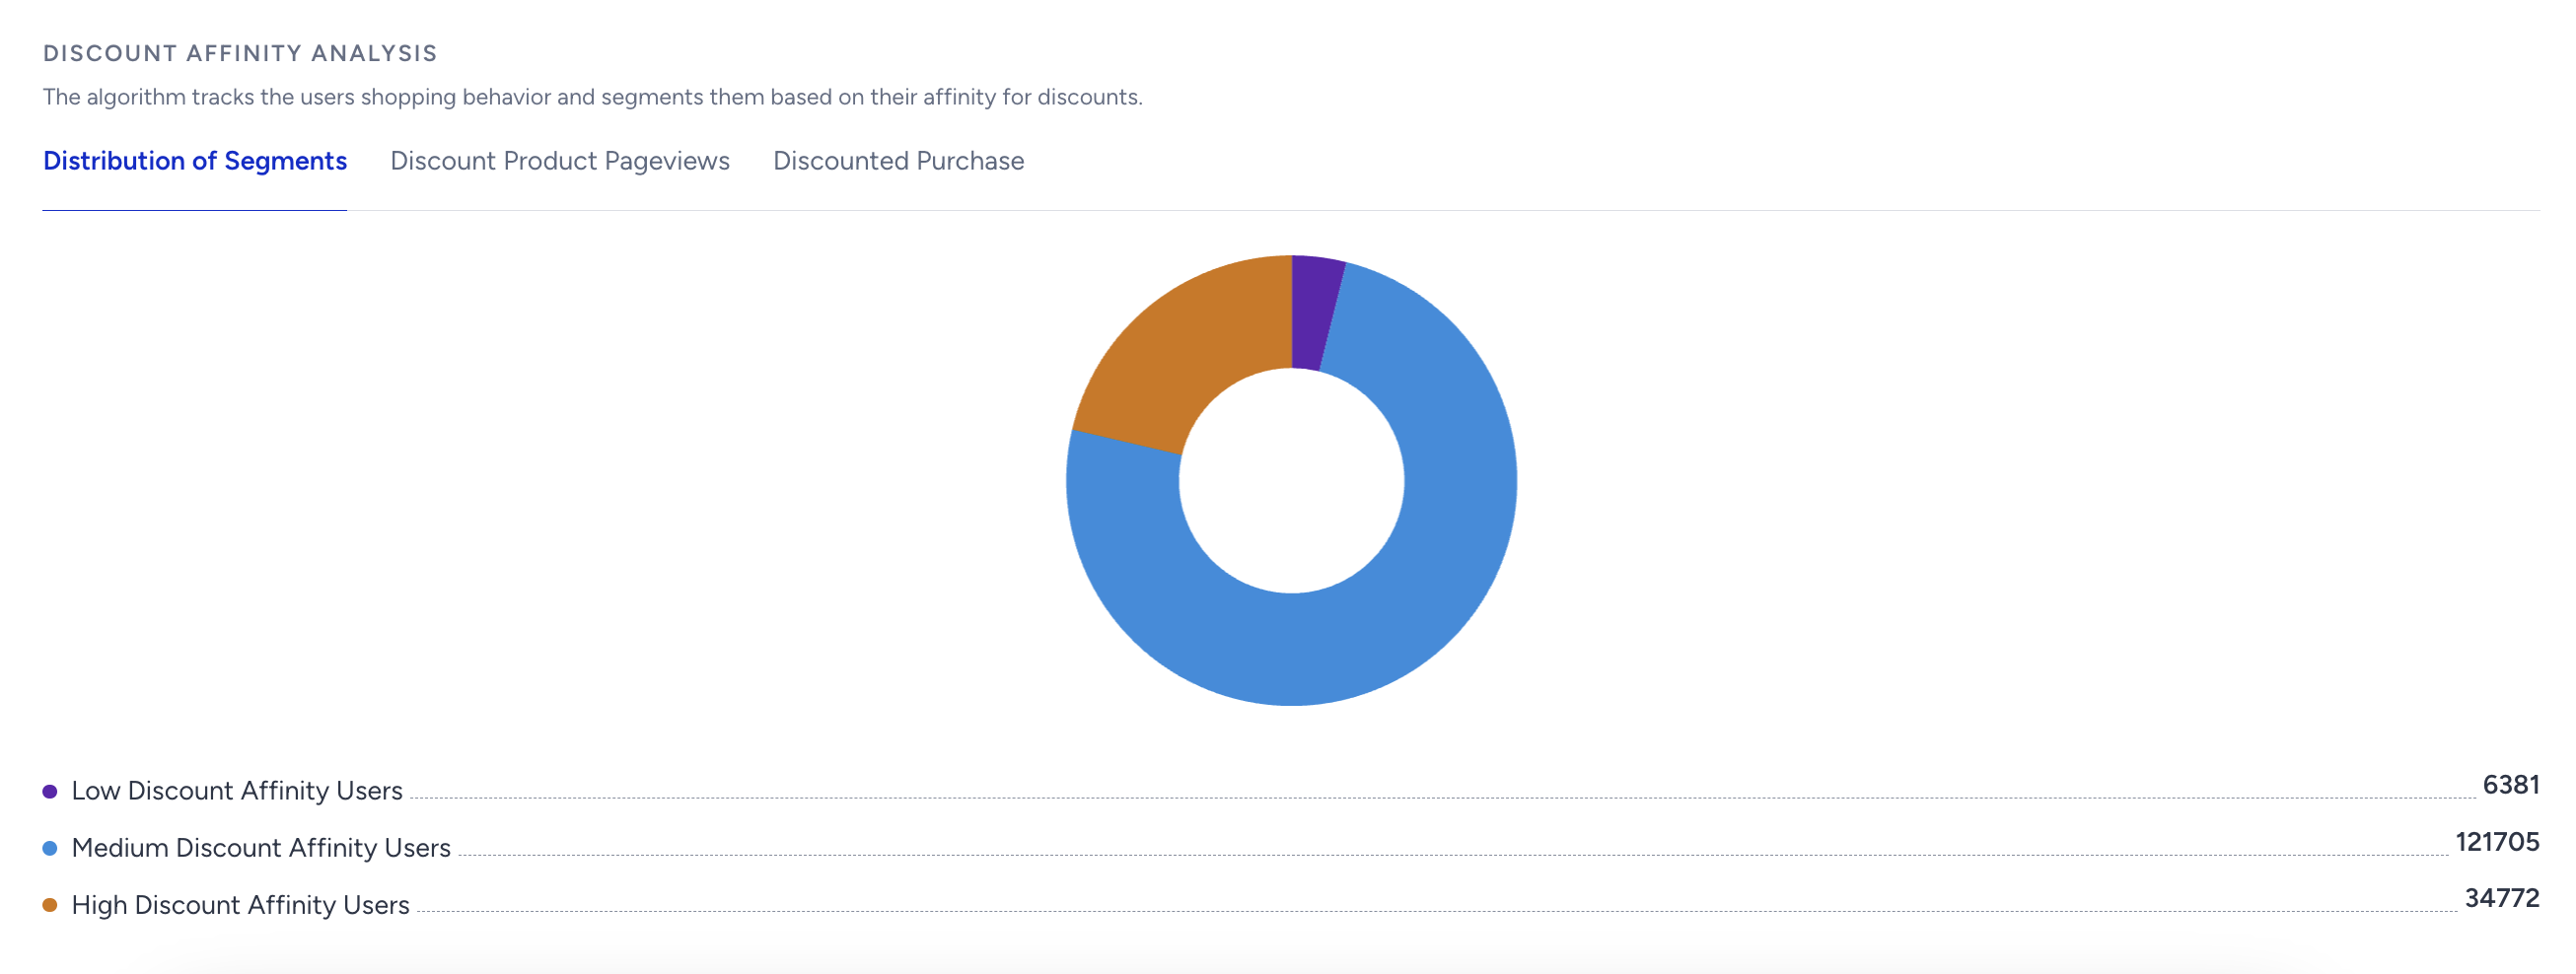
This chart displays the following insights:
Distribution of segments
Discount product pageviews
Discounted purchase