Flows show users' popular paths on your platform within the selected period. The purpose of the Flow is to display collective user flows for the selected event across all channels, such as the web, the application, and the API.
The video below briefly explains flow analytics.
If this video does not load in your region, you can watch it on our YouTube Channel.
Flow Analytics can help you with the following use cases:
View details by user type (also known as segments) to identify bottlenecks and target users with the right personalization at the right moment.
Get insights into users and their interactions at the feature/page levels to identify potential improvement areas and run A/B tests to optimize their experience.
You can create a specific path, change the time range of the flow, or add filters and parameters.
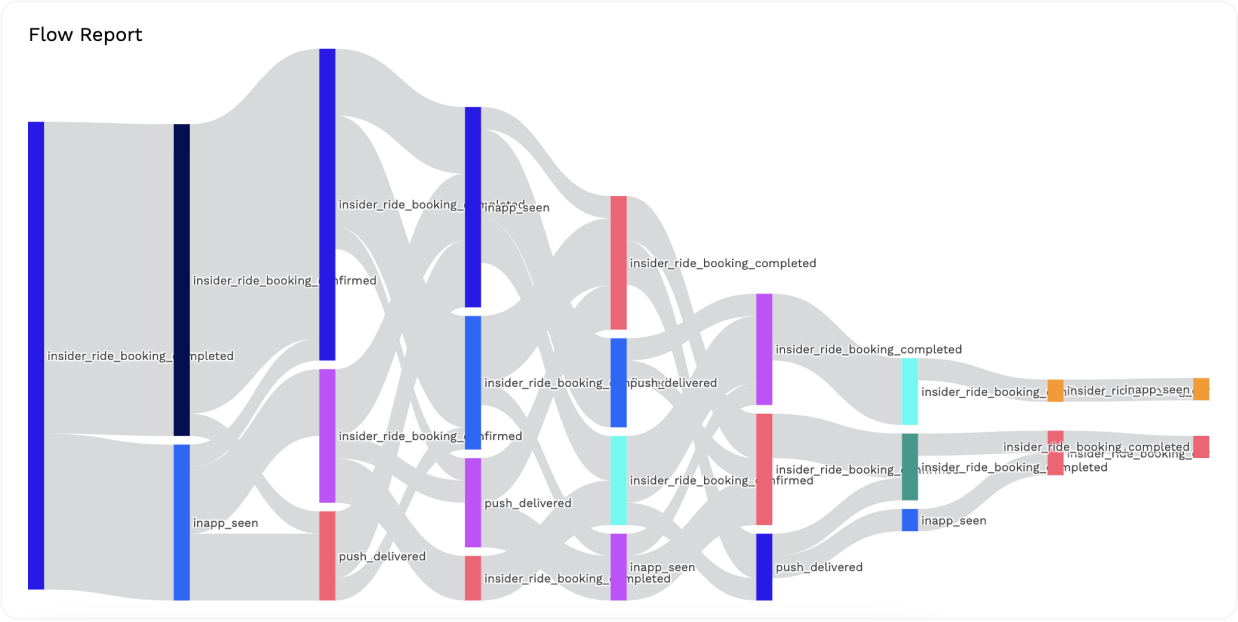
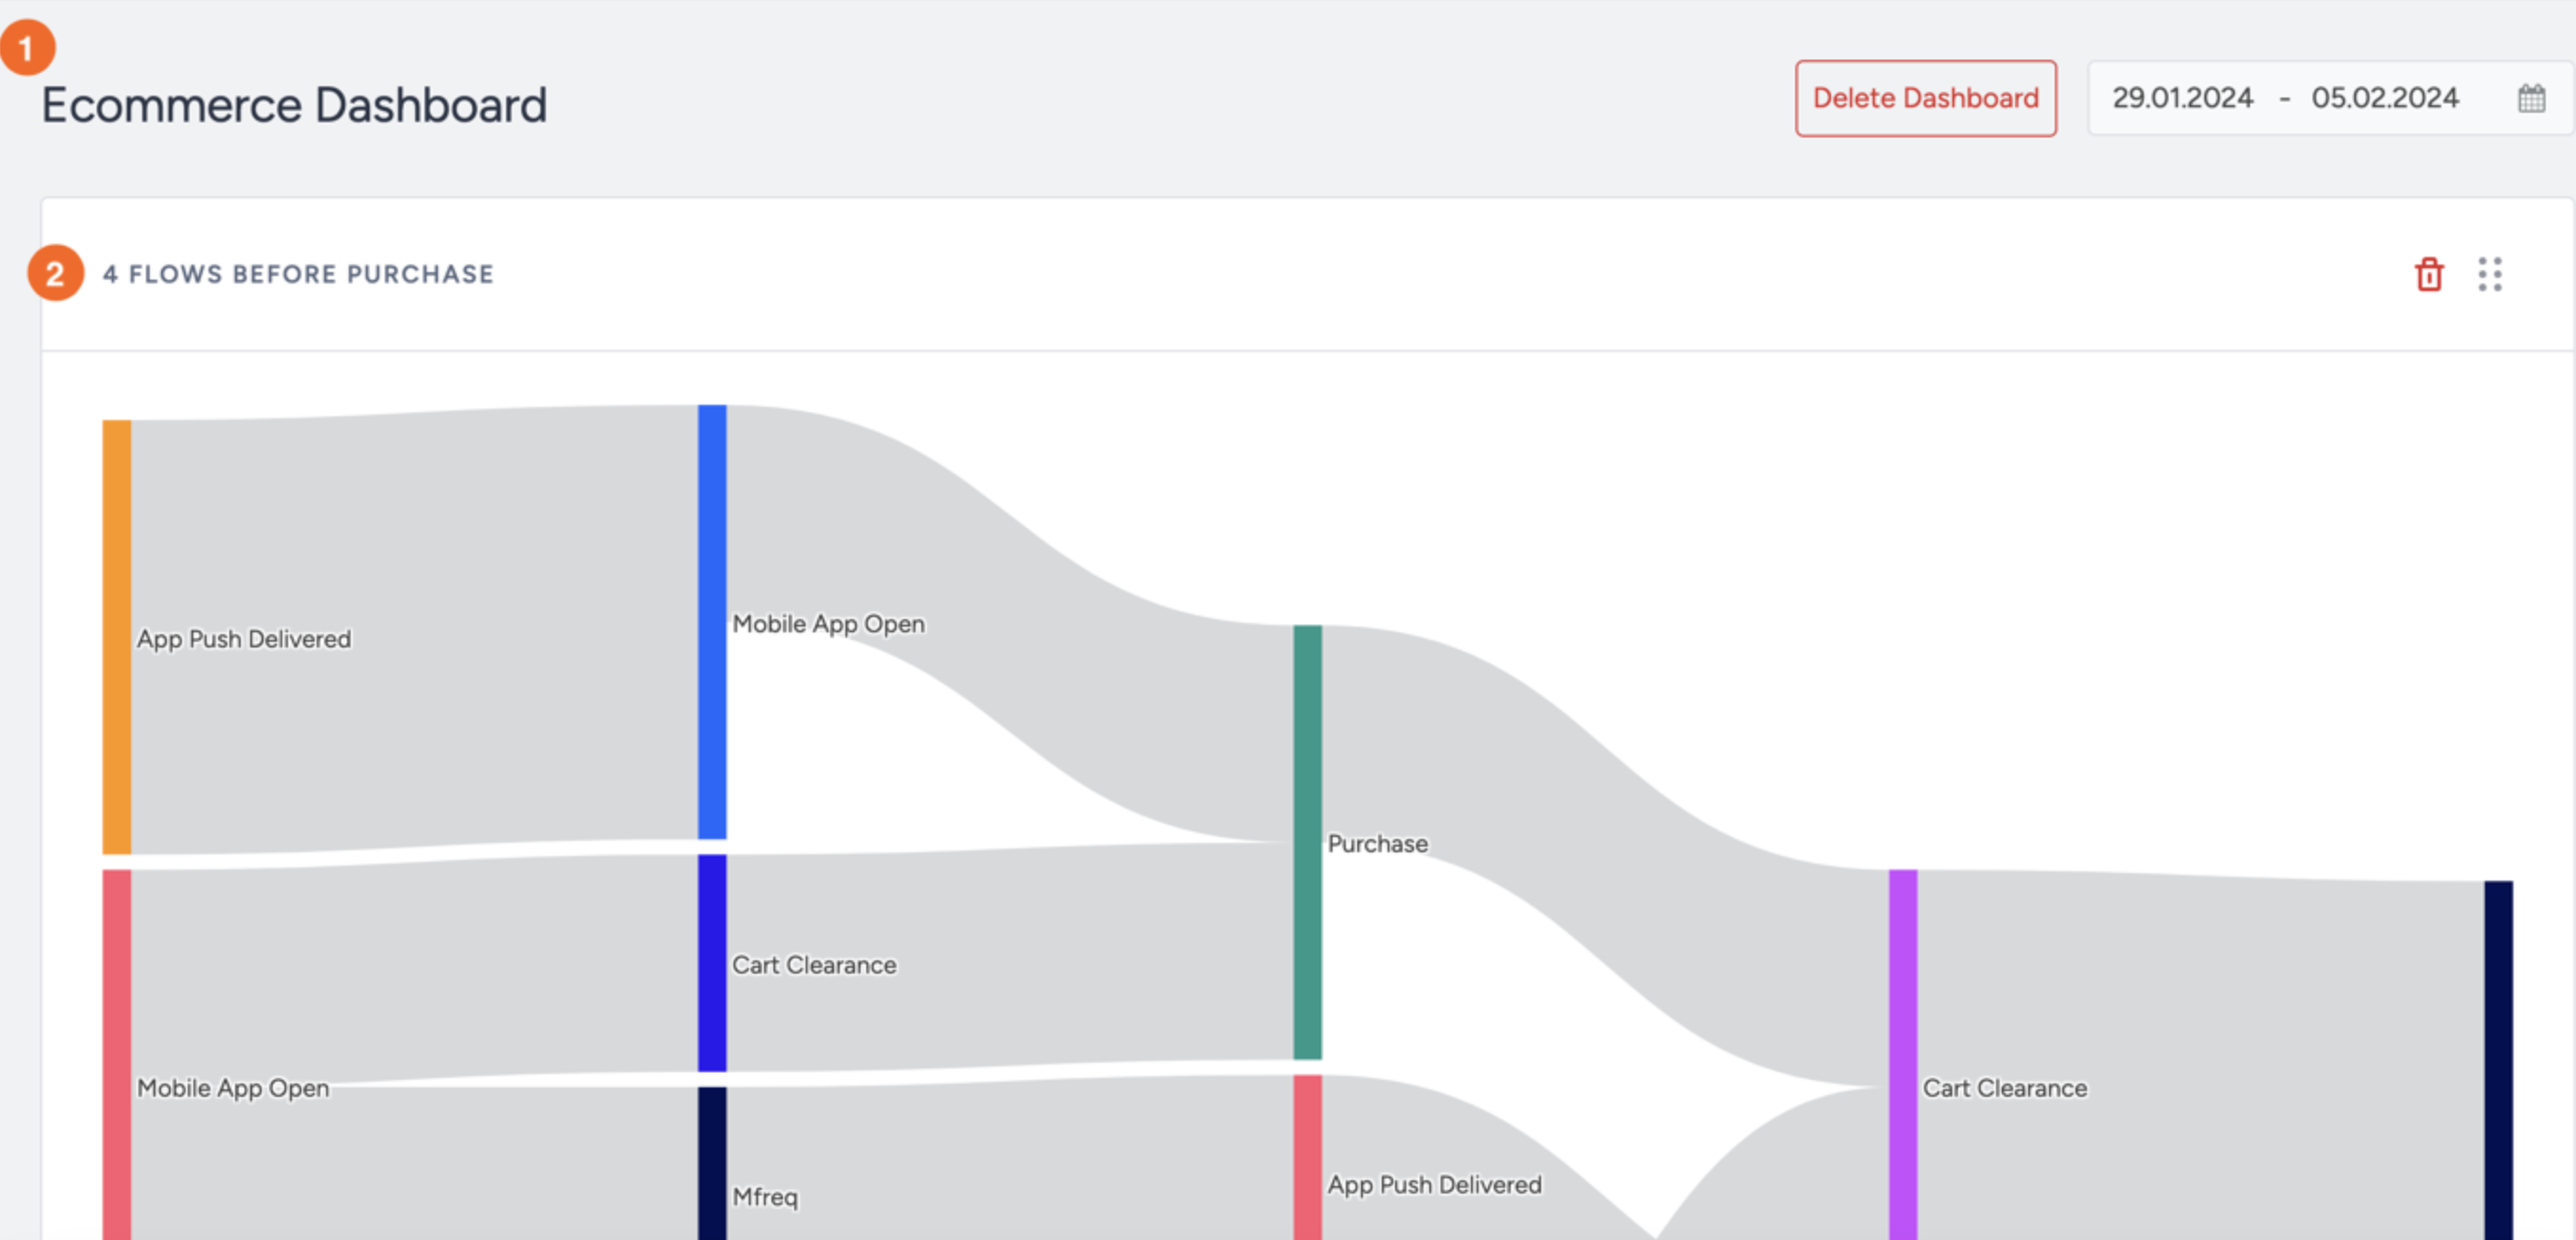
Flows help you analyze the user journey to identify trends and patterns. With user flow, you can better understand your users and use that knowledge to improve the user experience. In short, you can analyze your users' steps before or after an event you select.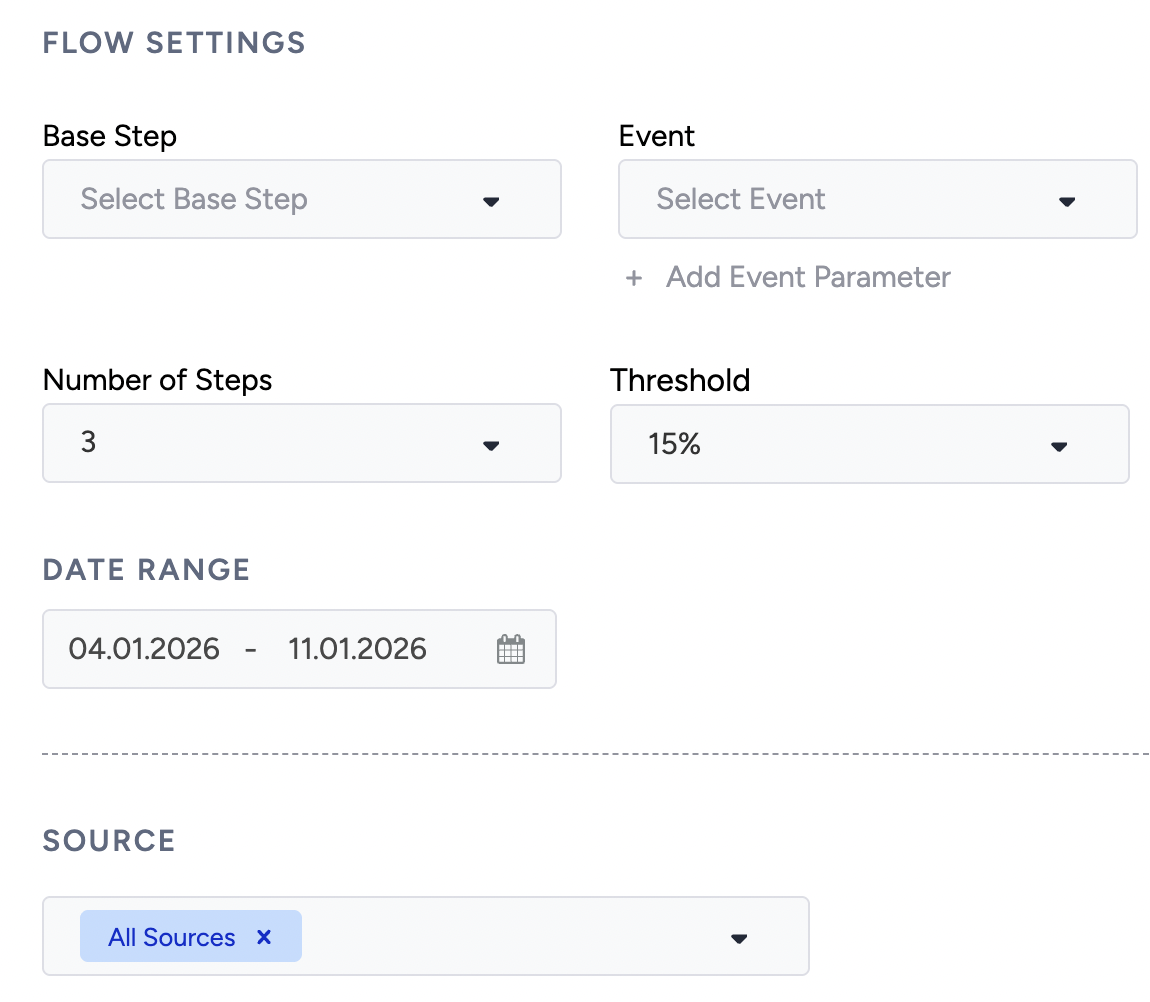
You can set up an event to analyze the outgoing (flows with events that occur after the selected event) or incoming (flows with events that occur before the selected event) flow using the base step. You can set the number of steps to display for the selected event in your flow.
Create a flow
To create a flow,
1. You should first select the Event you want to analyze. You can also add event parameters for the selected event.
2. Then, you should identify the Base Step, which aims to create a flow for the selected event, such as creating a flow starting with this event or creating streams ending with this event.
You can choose First Step to make the event the starting point for checking the user flow. For instance, selecting 'Homepage' will reveal users' subsequent actions (events) after visiting the homepage.
You can choose Last Step to make the event the final step in your user flow. For example, selecting "Purchase" as the last step lets you examine users' preceding actions (events) before purchasing. This insight empowers you to focus your efforts on further enhancing those activities.
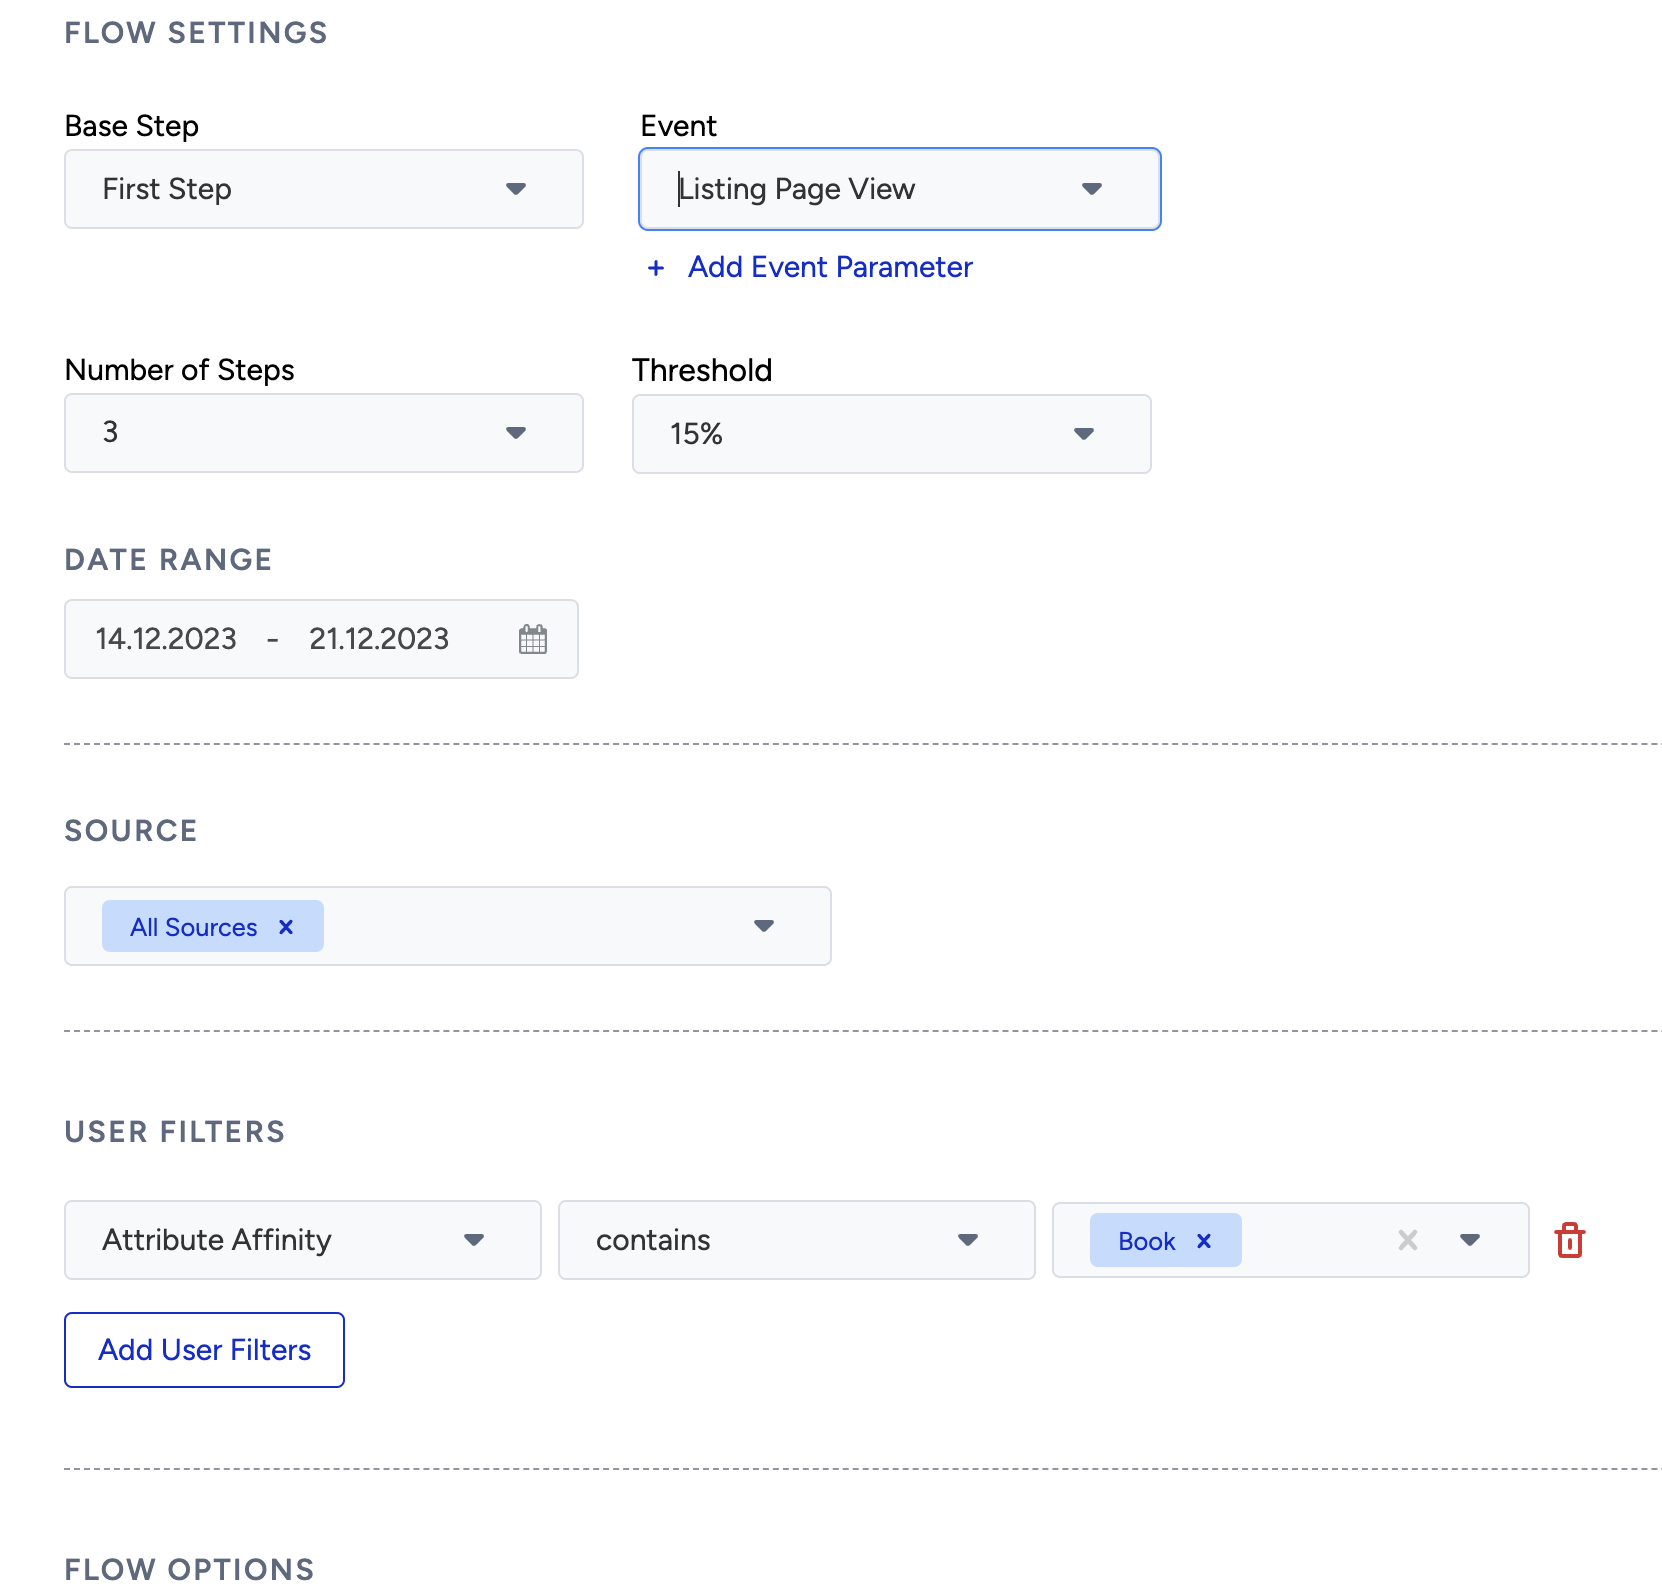
3. After the event selection, you should specify the number of steps for the flow. It indicates the number of stages you want to display after the Base Steps. However, it's important to note that specific visuals may be limited when dealing with many steps. For example, if you choose 3 as the maximum rank, your flow will be created for 3 steps before or 3 steps after the selected event.
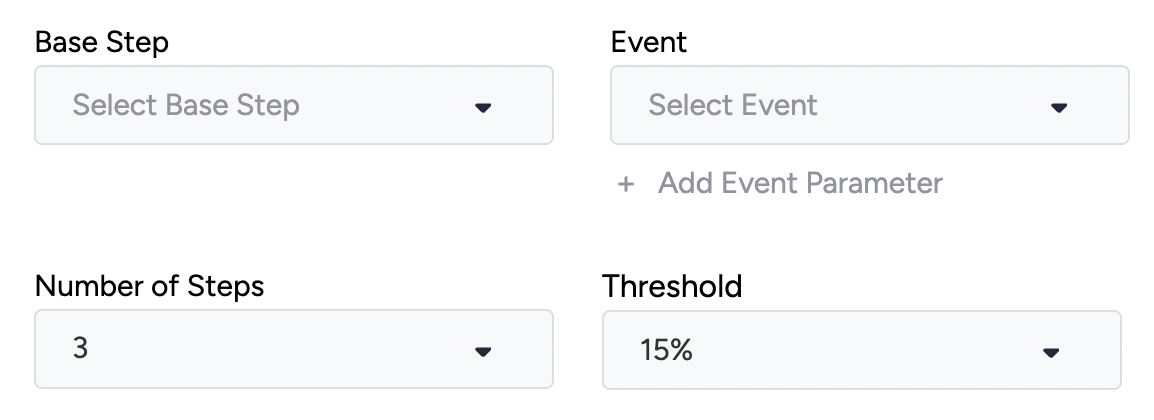
Base Step
You can choose either option:
First Step: You can choose any event as the starting point of checking your user flow. For example, you can choose “Homepage”. And it will show the actions (events) users take after visiting the homepage.
Last Step: You can choose any event as the end point for your user flow. For example, you can choose “Purchase” as the last step. And it will allow you to see the previous actions (Events) users take before making a purchase! So marketers can double down to improve more of those activities.
Number of Steps
Values range from 1 to 10. It shows how many stages you want to display after the Base Steps. Some of the visuals might be limited once you have a high number of steps.
Threshold
Normally, this can be quite a challenge to understand and raises most questions. Let’s start with some visualization examples first:
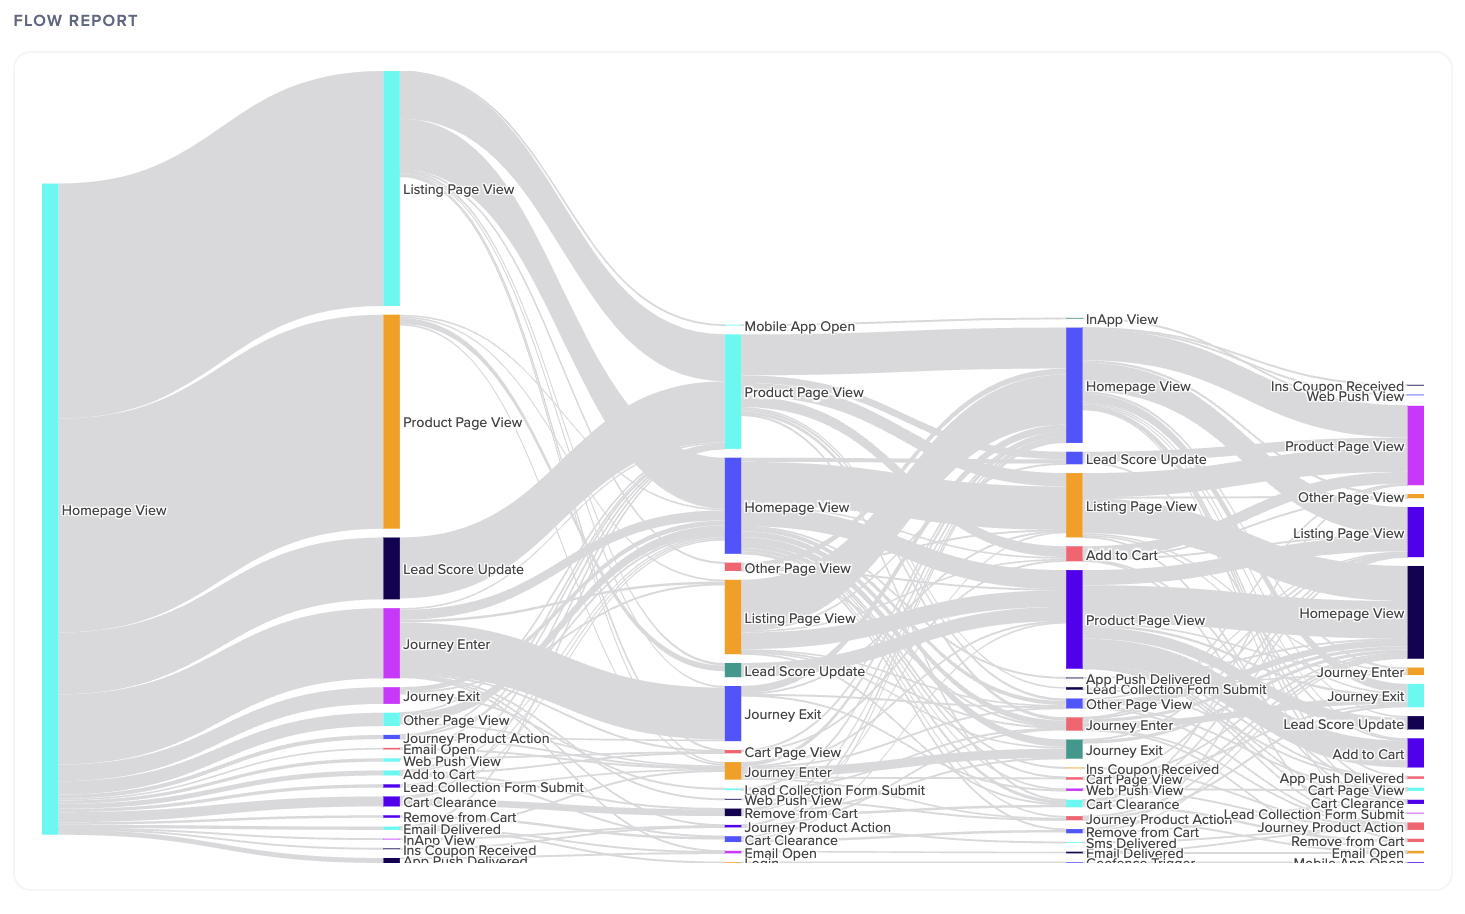
This is a flow with 10% Threshold.
This is a flow with 70% Threshold. All other settings is same as above.
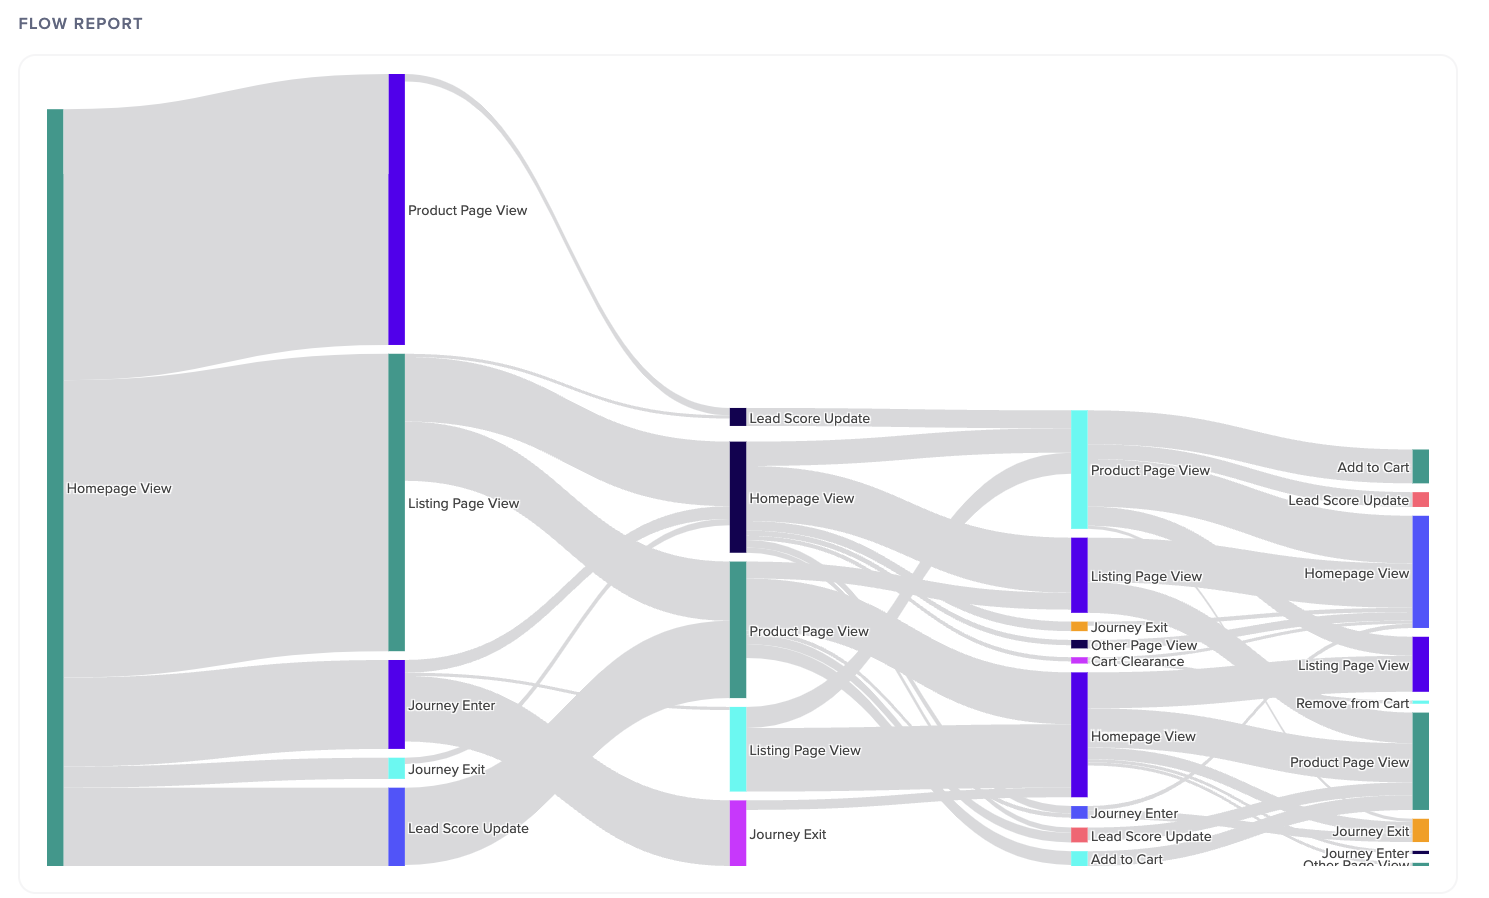
Threshold is a minimum allocation level calculated for each step. Elaborating more, suppose that you have 100 users who are passing through from the first step to 2nd step. When you set the threshold as 5%, it means that the next step will include events where 95% of your users are distributed. So, the lower you set the threshold, the more events you will see.
It orders the events from top-distributed to bottom-distributed. Then, upon ordering, it filters the event where the top 95% of the users are distributed.
4. To create a flow, select a date range.
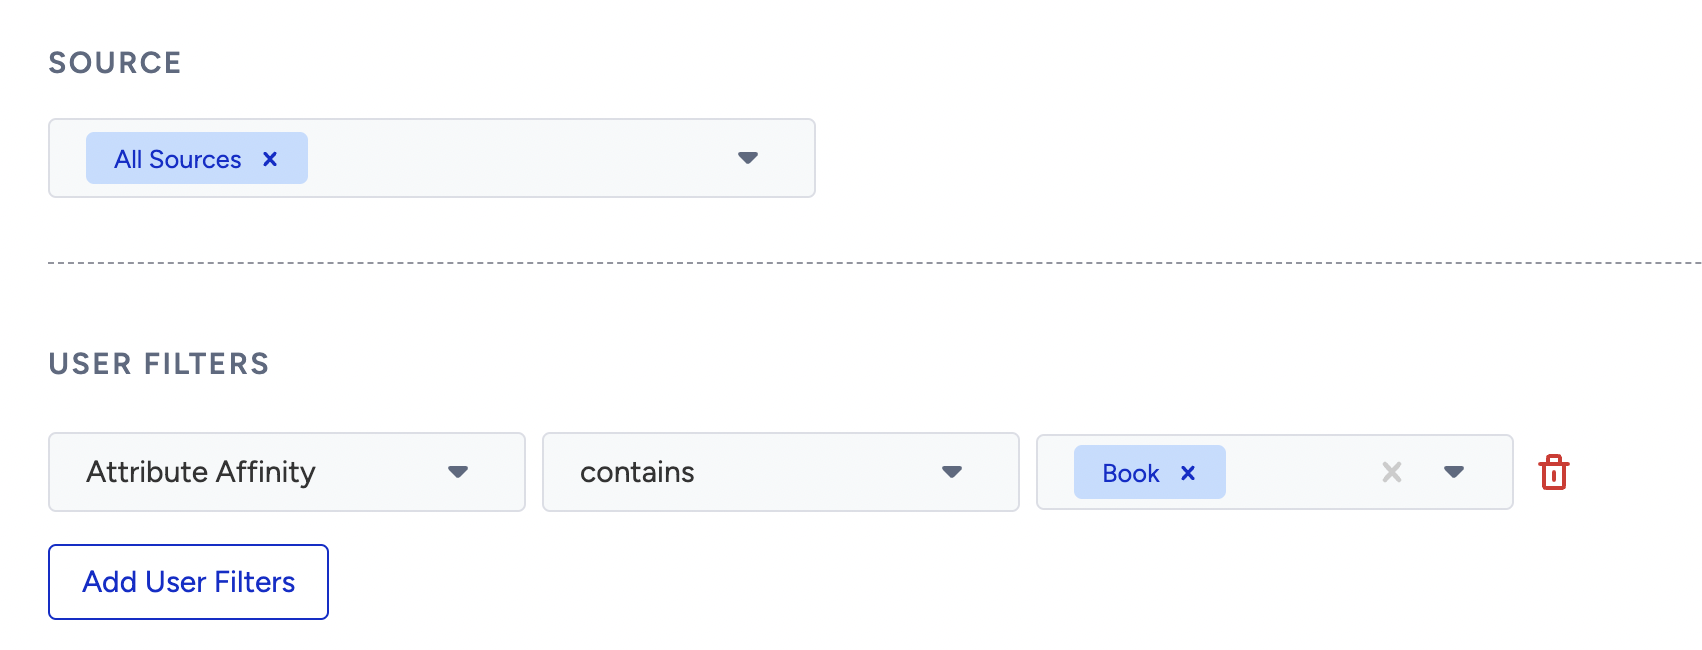
5. You can also adjust your flow for different data sources with source selection and set your flow for different user segments with user filters.
Add your flow to a dashboard
Before or after generating your flow, you can also add it to an existing dashboard or create a new one to add it.
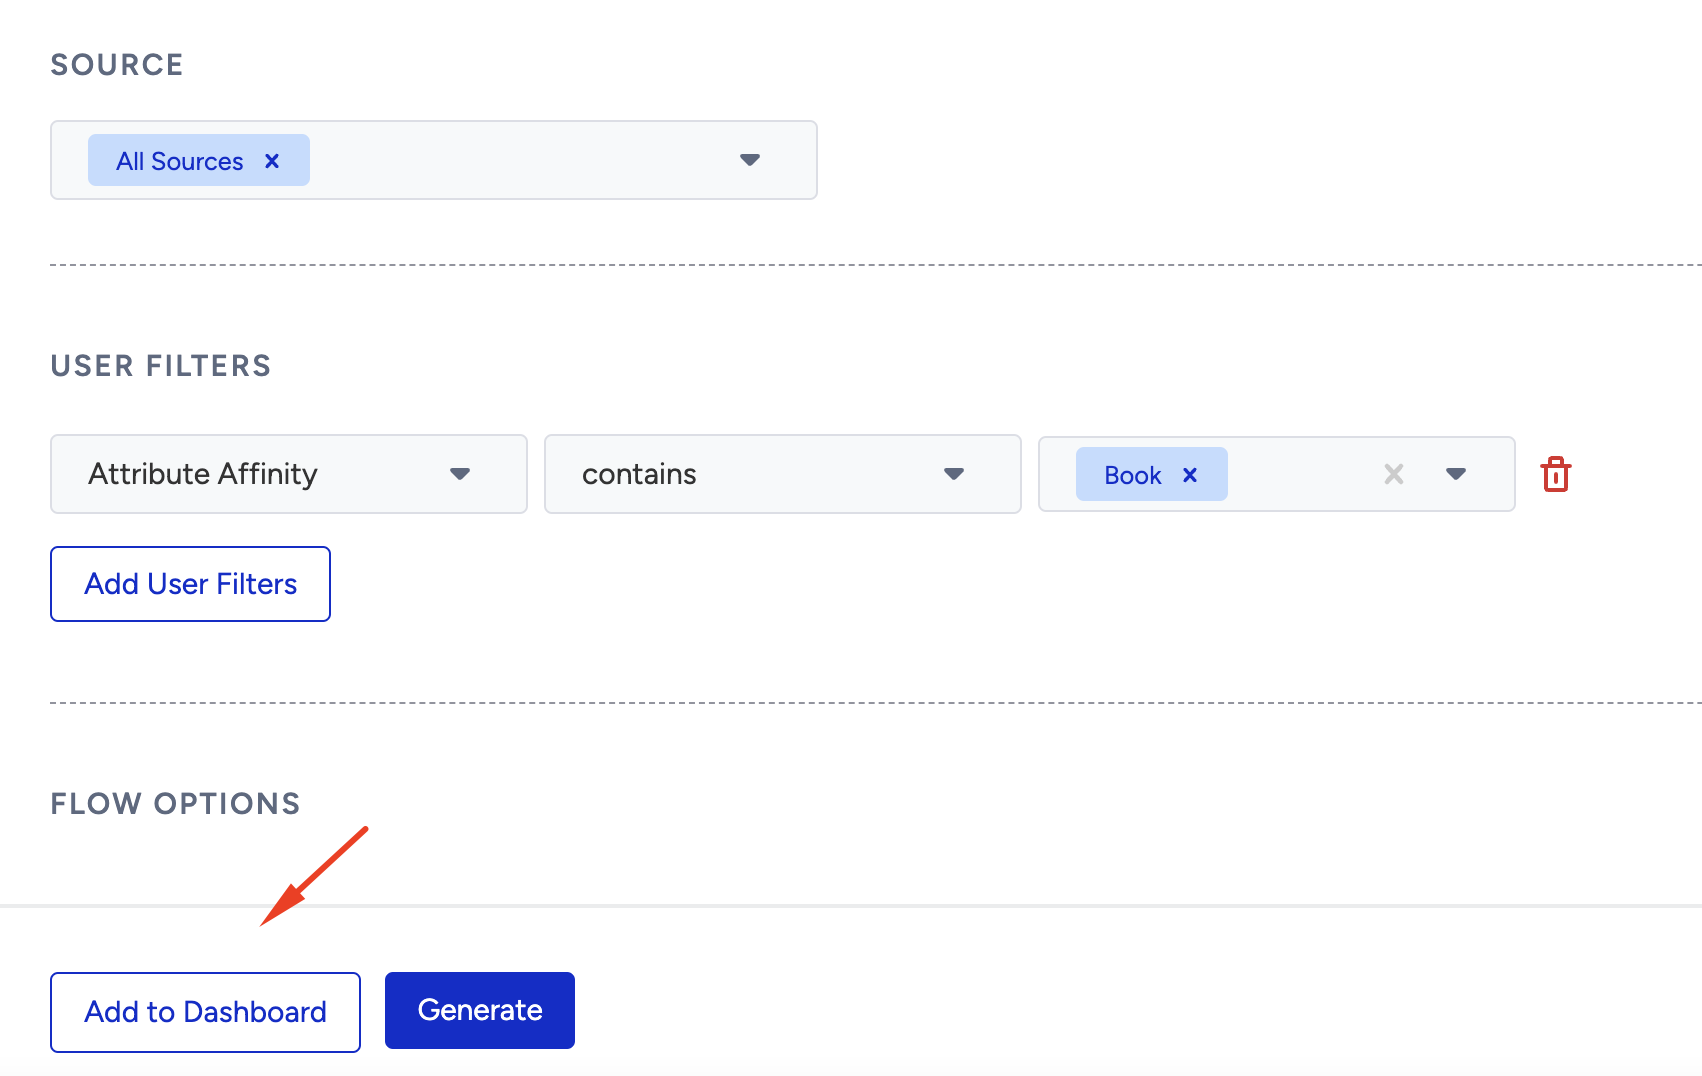
1. Click the Add to Dashboard button. A window will appear on the right-hand side of the screen.
2. Choose dashboard from: Select Existing or Create New to add your flow.
Select Existing displays the existing behavior dashboards from which you can select..png)
If you do not want to add this flow to your existing dashboards, or if you do not have any, you can also create a new one.
.png)
3. Type a chart name for your flow to appear on the dashboard. You can have multiple charts on a single dashboard.
4. Click the Add button at the bottom of the page to add your flow to the selected dashboard.
Once created, your dashboards will be listed under Behavior Analytics > Behavior Dashboards.
.png)