The Shopping Agent Analytics dashboard helps you understand how users interact with your Shopping Agent and how effectively it drives product discovery, engagement, and revenue.
By combining usage analytics, product discovery metrics, and revenue attribution, this dashboard allows product, analytics, and business teams to analyze the full shopping journey from user query to product impression, click, add to cart, and purchase with consistent and time-bound attribution.
These metrics are available for both your Web Shopping Agent and WhatsApp Shopping Agent, allowing you to analyze performance across channels in a single dashboard.
Navigate to the Shopping AI Agent Analytics
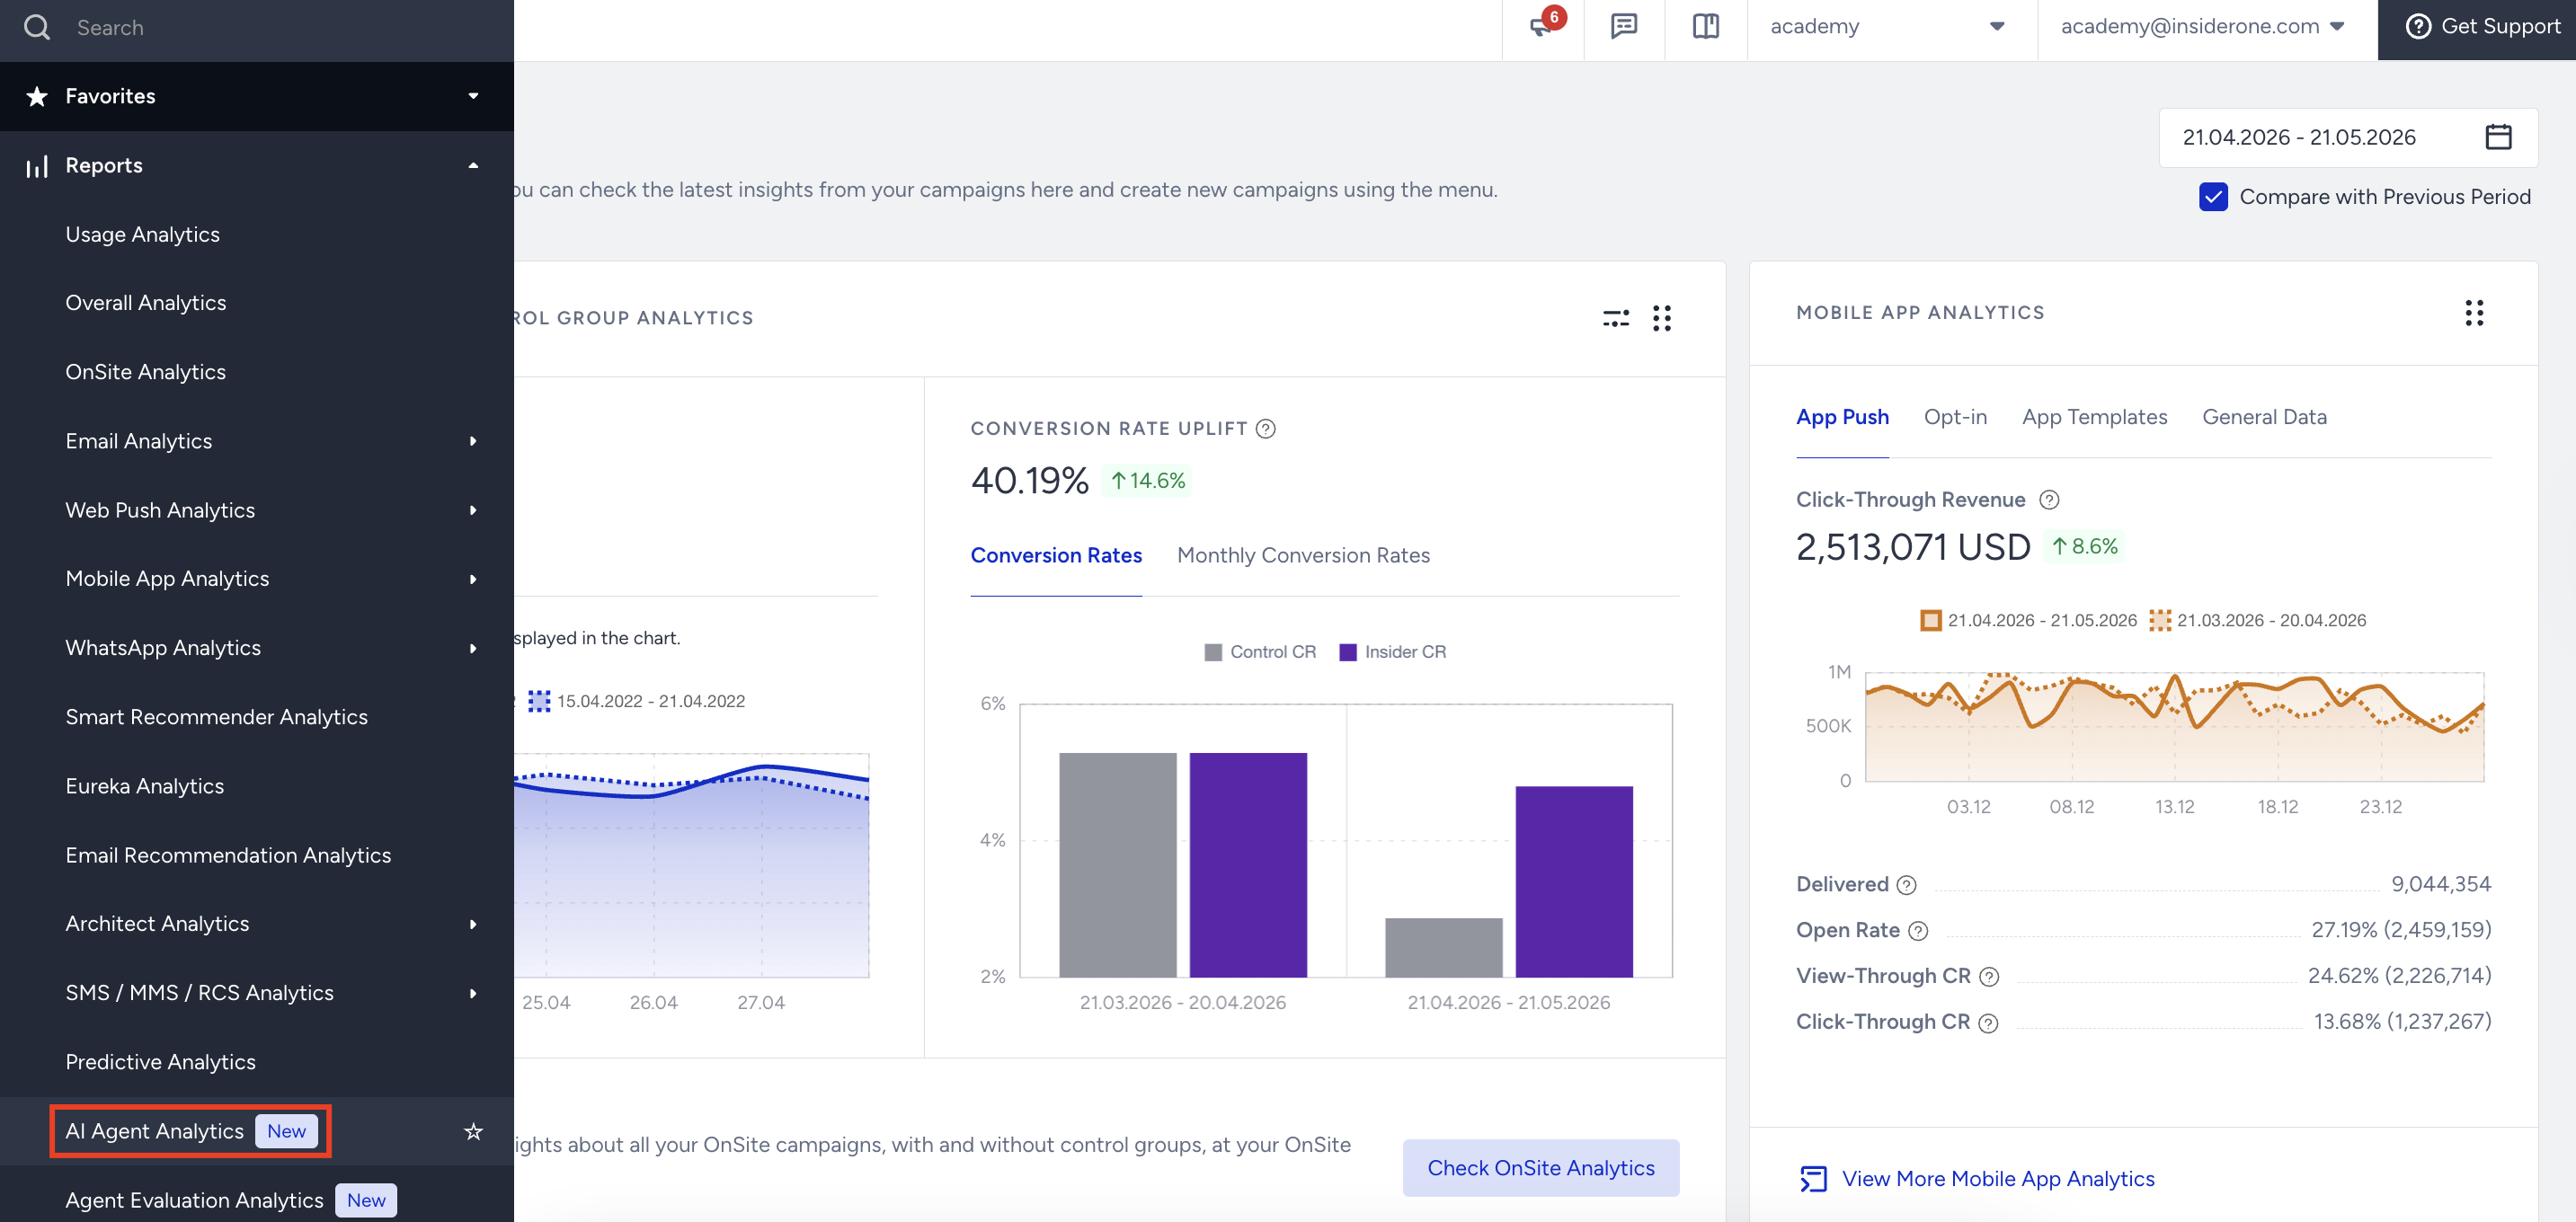
To access the Shopping Agent Analytics page, navigate to InOne > Reports > AI Agent Analytics.
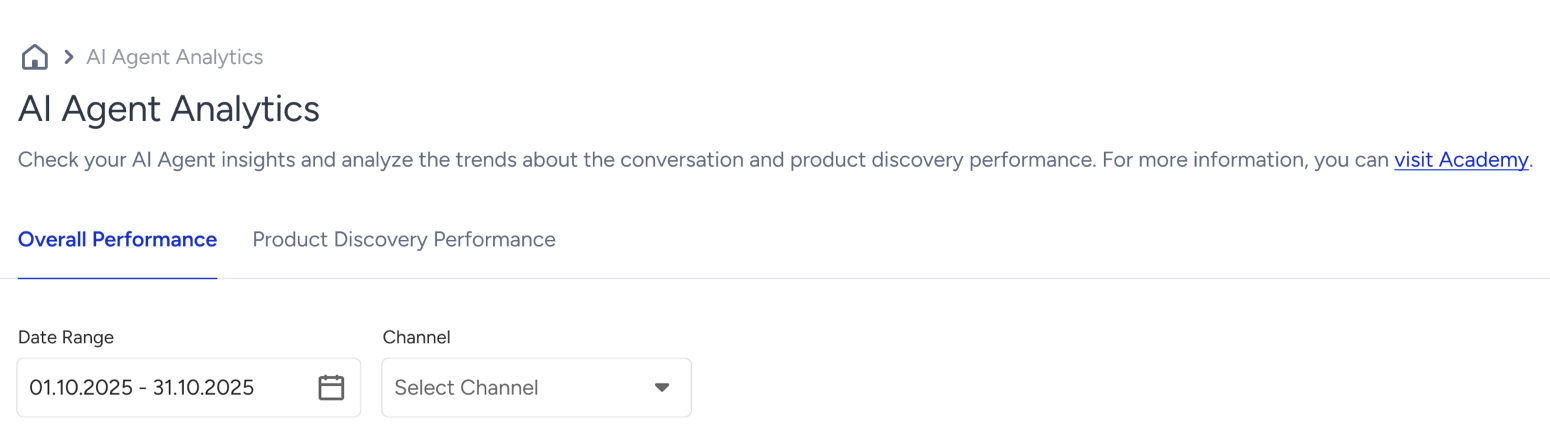
The dashboard includes two main tabs:
Overall Performance
The Overall Performance tab provides a high-level view of Shopping Agent usage and effectiveness. It focuses on adoption trends and baseline performance metrics.
This section is conceptually similar to Support AI Agent Analytics and follows the same structure and logic.
Refer to the Support AI Agent Analytics for further information about the Overall Performance page.
This section helps you understand baseline performance and adoption trends before diving deeper into product-level discovery metrics.
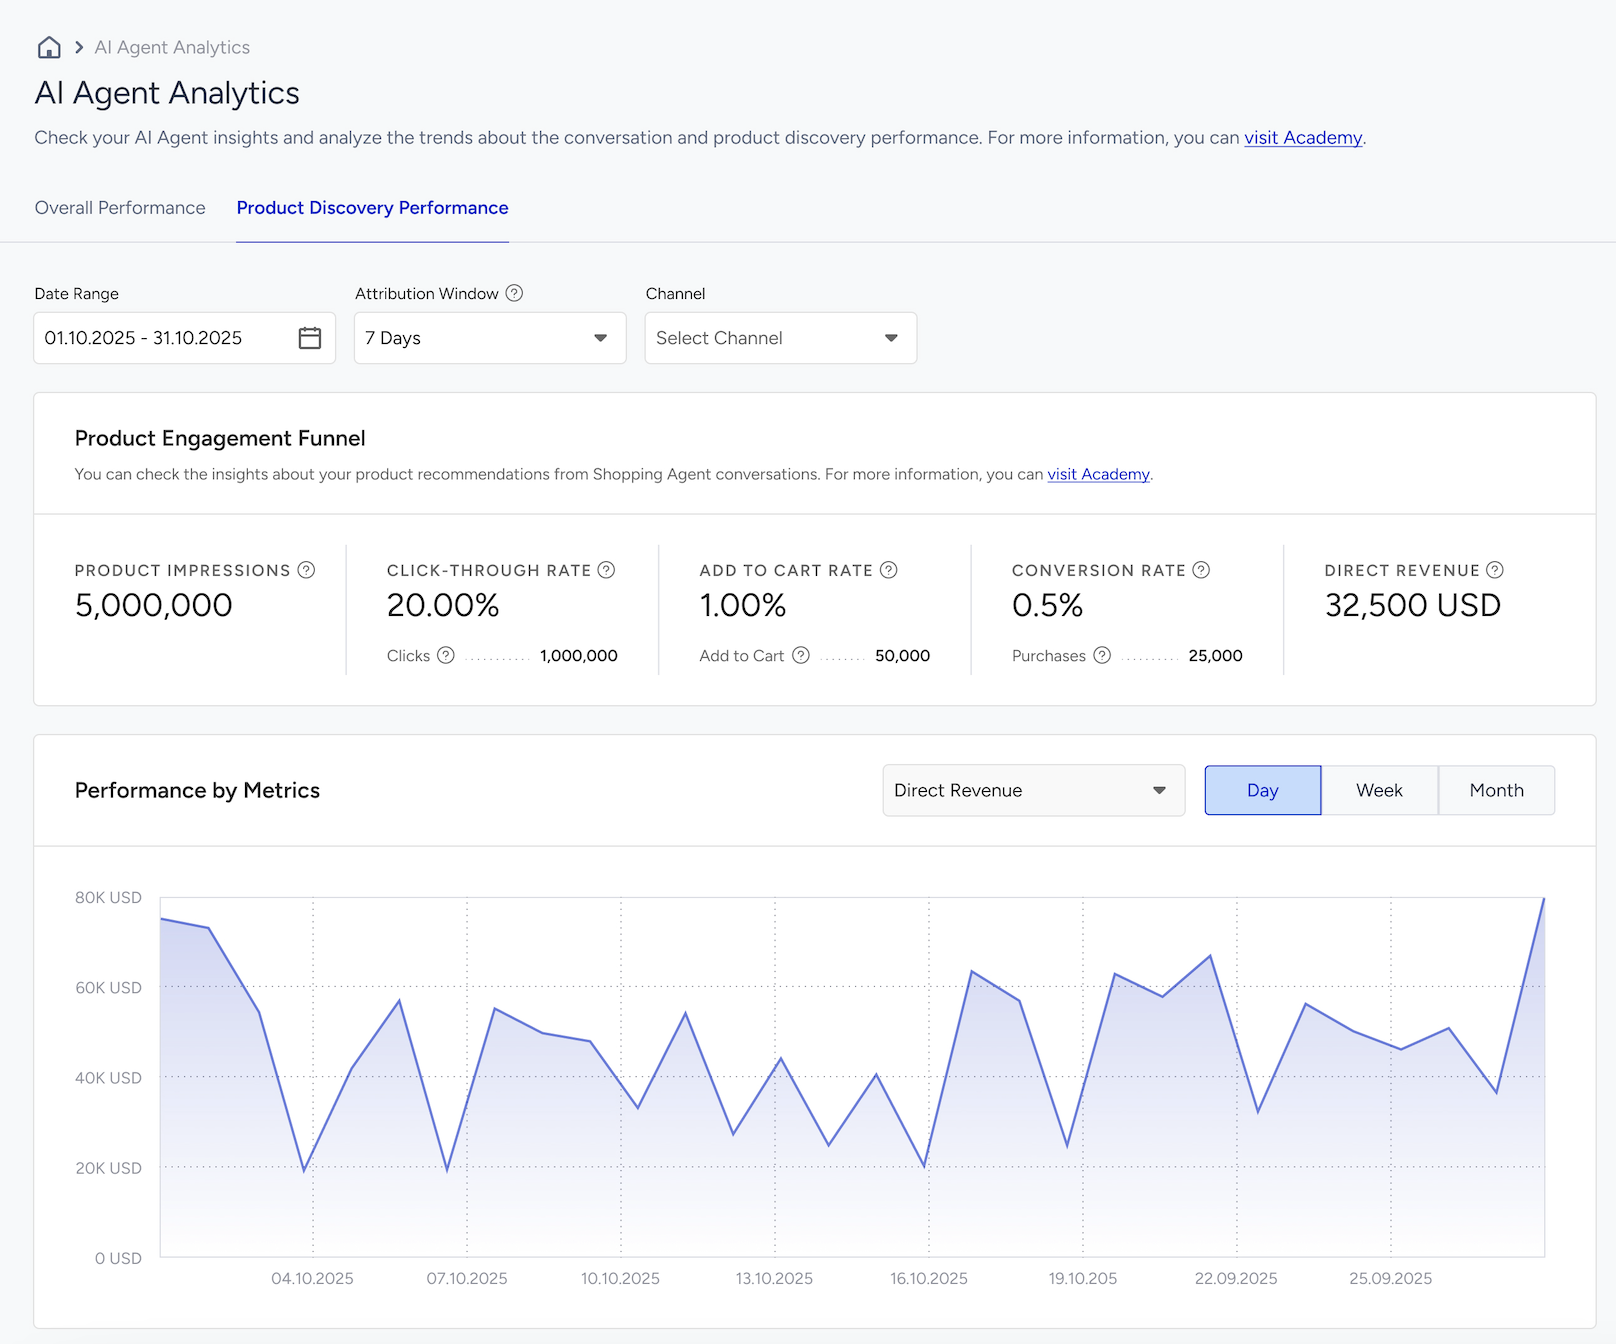
Product Discovery Performance
The Product Discovery Performance tab focuses on how effectively the Shopping Agent surfaces products and drives commerce outcomes across the funnel.
It measures each key step in the discovery and purchase journey: Impression → Click → Add to Cart → Purchase → Revenue
Date Range
Use the date picker in the top-left corner to filter results by a specific time period. After selecting a date range, click Apply to update the dashboard.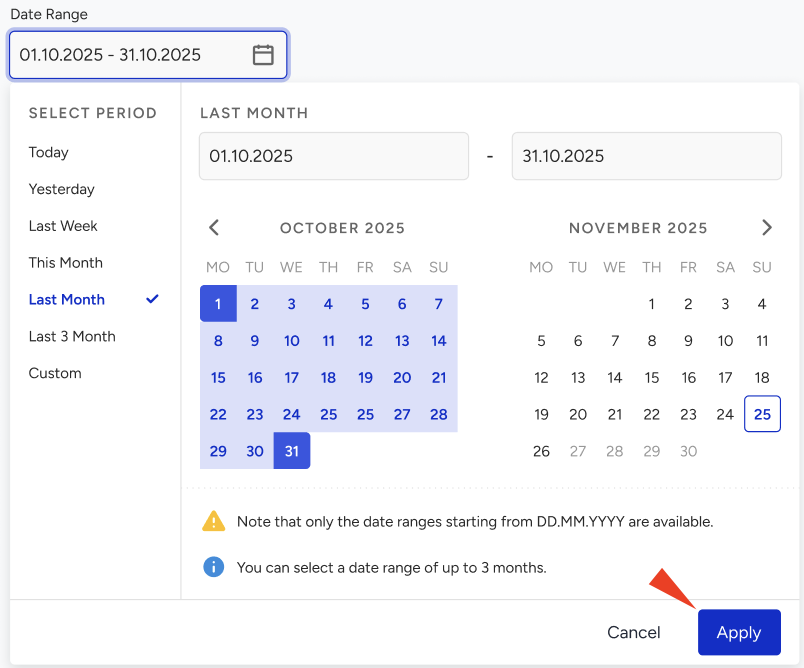
Attribution Window
The Attribution Window defines the time period during which a purchase can be attributed to a prior product impression or click generated by the Shopping Agent.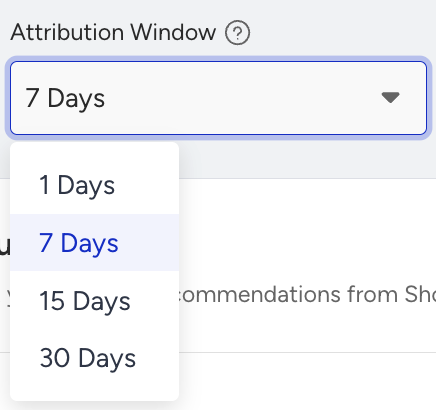
This setting ensures the impact of the Shopping Agent on conversions is measured accurately by accounting for different customer decision cycles. For example:
A fast-moving consumer goods retailer might see customers complete purchases within the same session or day.
A furniture retailer or other high-consideration product store might see purchases occur days or even weeks after the initial interaction.
If both use the same default attribution window, purchases that occur later in the decision journey might not be counted, which can lead to underreporting of Shopping Agent performance. Selecting an attribution window that aligns with customer behavior ensures analytics reflect real engagement and conversions.
How does the Attribution Window work?
The attribution window determines how long after a Shopping Agent interaction a purchase is credited to the Shopping Agent in analytics.
1 Day: Purchases completed within 24 hours of the interaction
7 Days: Purchases completed within 7 days of the interaction
15 Days: Purchases completed within 15 days of the interaction
30 Days: Purchases completed within 30 days of the interaction
Selecting the right attribution window ensures that Shopping Agent analytics accurately reflect customer behavior, whether for quick purchases or longer decision cycles.
Attribution Window and Metric Capture
The Attribution Window defines the period during which product interactions generated by the Shopping Agent are attributed to analytics metrics in Insider One.
Selecting the correct attribution window ensures the following metrics accurately reflect user behavior:
Add to Cart Rate
Conversion Rate
Revenue
This allows Shopping Agent performance to be evaluated based on realistic engagement and purchase timing.
The table below illustrates how different attribution windows affect which Shopping Agent interactions are counted toward Click, Add to Cart, and Revenue metrics for different purchase timelines.
Product | Click Day | Add to Cart | Purchase Day | 1 Day Window | 7 Day Window | 15 Day Window | 30 Day Window |
|---|---|---|---|---|---|---|---|
Product A | Day 1 | Day 2 | Day 6 | Click ✅ | Click ✅ | Click ✅ | Click ✅ |
Product B | Day 1 | Day 1 | Day 15 | Click ✅ | Click ✅ | Click ✅ | Click ✅ |
Channels
Select the channel where your Shopping Agent is active to view channel-specific metrics.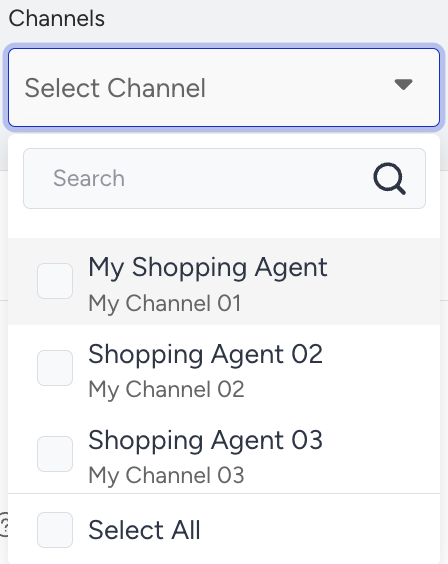
Product Engagement Funnel
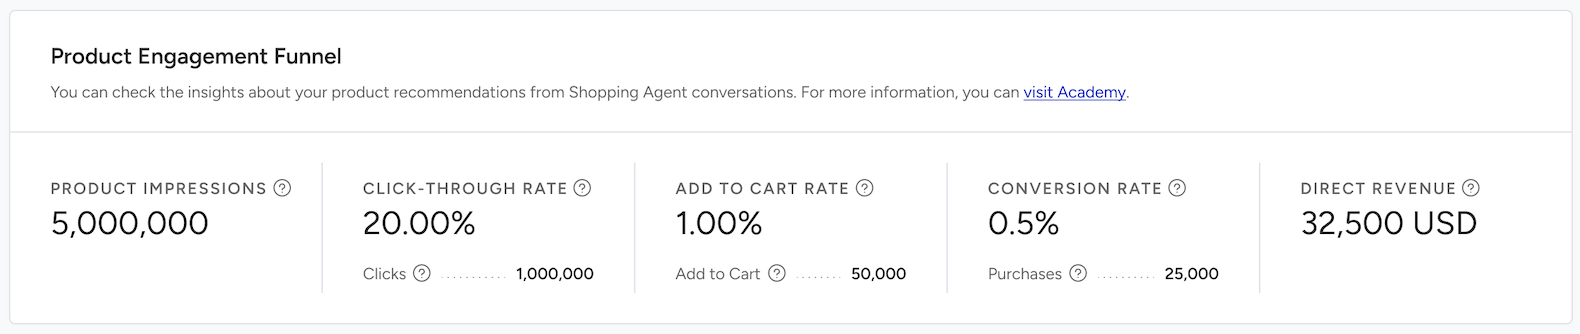
The Product Engagement Funnel shows how users move from product exposure to purchase.
It includes the following metrics:
Product Impressions: The number of successful product impressions displayed to users. Each impression represents a single product shown in search results that the user has actually seen. This metric measures how effectively the agent surfaces products, indicates recommendation coverage and visibility, and helps identify zero-result or low-coverage scenarios.
Click Through Rate (CTR): Percentage of product impressions that received at least one click. Click Through Rate shows how engaging and relevant the displayed products are, and helps evaluate recommendation quality and ranking logic. Low CTR may indicate poor relevance, pricing, or presentation.
Clicks: The total number of times users clicked on recommended product links.
Add To Cart Rate: Percentage of product impressions that resulted in an add to cart action. It measures intent to purchase after product discovery and indicates whether product details, availability, and offers are compelling. It is useful for diagnosing drop-offs between interest and intent.
Add to Cart: The total number of recommended products that users added to their carts after clicking on the product links within the attribution window.
Conversion Rate: Percentage of product impressions that ultimately led to a purchase. It reflects the agent’s true end-to-end effectiveness and measures performance from initial exposure to completed purchase. It is useful for comparing agent-driven discovery vs other channels
Purchases: The total number of recommended products for which users completed their orders within the attribution window.
Direct Revenue: Total monetary value of purchases supported through the Shopping Agent within the selected attribution window. It quantifies the direct commercial impact of the Shopping Agent and enables ROI measurement and revenue contribution analysis. It helps business teams justify investment and optimization efforts.
Performance by Metrics
The Performance by Metrics section visualizes Shopping Agent performance over time.
You can analyze metrics using Daily, Weekly, or Monthly views to understand short-term fluctuations and long-term trends.
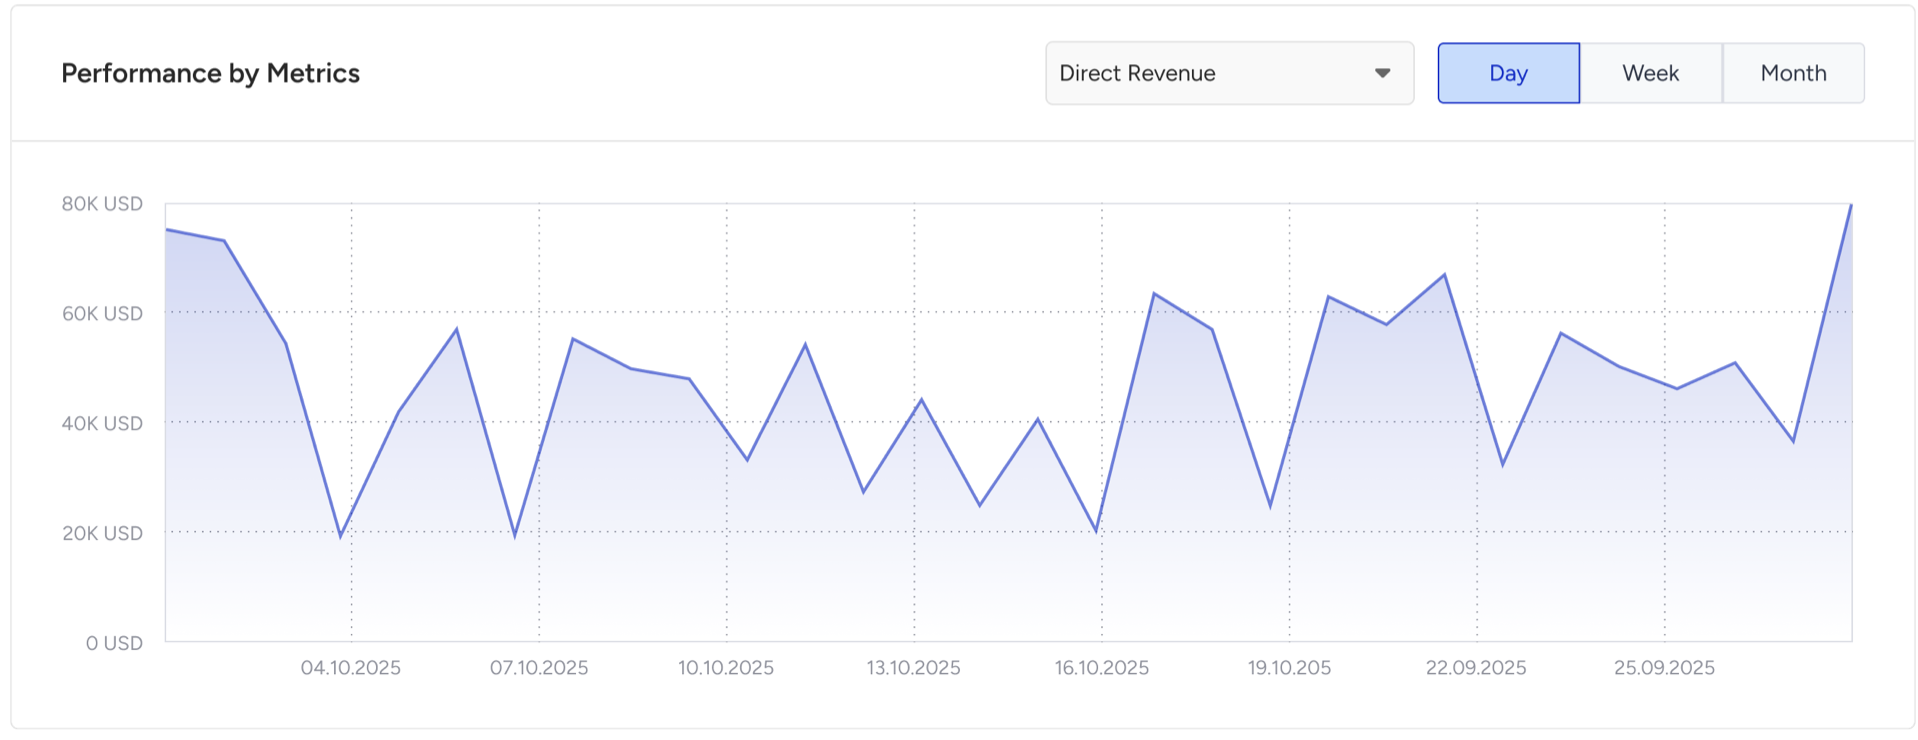
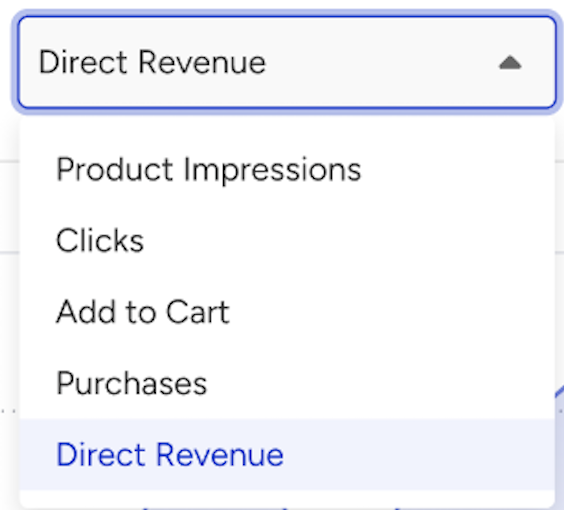
Use the metric selector dropdown to filter and compare specific metrics in the charts, such as:
Product Impressions
Clicks
Add to Cart
Purchases
Direct Revenue
This view helps you track trends, monitor success rates, and identify changes over time.
How can you use these insights?
Analyzing Overall Performance together with Product Discovery Performance, you can:
Identify where users drop off in the funnel
Improve recommendation relevance and ranking
Optimize product exposure and engagement
Increase conversion rates and revenue
Continuously enhance personalization and the shopping experience